1. Acknowledgements
Introduction Alamar Blue Viability Assay Results
Conclusion
Investigated the adjuvant properties of several gold nanovaccines in
vitro by measuring IL-12 cytokine production
Angel A. Garcés1, Emily Reiser1, Rebekah Drezek1,2
1. Department of Bioengineering, 2. Department of Electrical and Computer Engineering, Rice University, Houston, TX.
Future Directions
Cancer immunotherapy involves
training the natural immune system to
recognize and destroy tumors. In our lab,
gold nanoparticle (AuNP) cancer vaccines
(AuNV) successfully elicited an immune
response in vivo(1). However, we want to
determine which AuNV induces the
highest cytokine production, a property of
adjuvants. Higher cytokine production
theoretically corresponds to a stronger
immune response. Our investigation
involved introducing bare AuNPs, AuNP-
PEG, AuNP-PEG-OVA, AuNP-PEG-Trp2,
and AuNP-PEG-GP100 into J774.A
macrophages (Mac) and measured IL-12
cytokine production and cell viability.
Researching induced cytokine production
informs design of future AuNVs.
1: Lin et al. Nanoscale Research Letters 2013, 8:72
Immune Response Overview
Experimental Methods
EDC/Sulfo-NHS
Peptides
COOH
COOH
COOH
COOH
COOH
COOH
COOH
COOH
COOH
COOH
COOH
COOH
COOH
SH
PEG
Figure 2: Overview of AuNV Conjugation
Gold nanoparticles are PEGylated with HS-PEG5000-
COOH. Peptides are added to the carboxylic acid terminus
via the EDC/Sulfo-NHS mechanism.
Figure 4: Overview of the ELISA sandwich assay
A Quantikine® ELISA Mouse IL-12 p70 immunoassay
kit (sandwich assay) used. Higher intensities of color
change indicate higher cytokine concentrations
Courtesy of: Chakravarthy, Ankur. “ELISA- Enzyme Linked Immunosorbant Assay”
Figure 3: Overview of the Alamar Blue cell viability assay
J774A.1 mouse macrophages introduced to various AuNV
concentrations. Excitation wavelength: 570 nm. Maximum
fluorescence intensity peak wavelength: 586-588 nm.
Image courtesy: Thermo Scientific alamarBlue assay protocol
0
500000
1000000
1500000
2000000
2500000
3000000
3500000
4000000
MaximumFlorescenceIntensity
Maximum florescence intensity of different AuNVs
at varying concentrations
3.1395E-14 g/cell
6.279E-14 g/cell
9.4185E-14 g/cell
Figure 5: Concentration of AuNVs introduced affects cell
viability in vitro
Almost all AuNVs tested had similar maximum florescence
intensity values, indicating a similar viability. A similar
viability to the control indicates that the AuNVs are not
harming the cells.
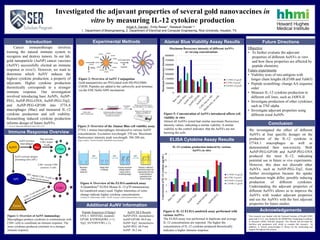
Figure 6: IL-12 ELISA sandwich assay performed with
various AuNVs
The ELISA assay was performed in duplicate and average
IL-12 concentrations are reported. The higher the
concentration of IL-12 cytokine produced theoretically
indicates a higher immune response.
ELISA Cytokine Assay Results
Peptide Sequences (Charge)
OVA-1: SIINFEKL (neutral)
GP100: KVPRNQDWL (+1)
Trp2: SVYDFFVWL (-1)
This research was funded with the National Institute of Health (NIH)
grant and A.A.G. was funded by the HHMI Rice Sustaining Excellence
in Research (SER) Scholars program. The Drezek lab provided the
facilities and equipment with which to conduct this research. In
addition, A. Garcés acknowledges E. Reiser for her mentorship and
support throughout this project.
Objective
• To further evaluate the adjuvant
properties of different AuNVs in vitro
and how these properties are affected by
peptide chemistry
Future experiments
• Viability tests of neo-antigens with
longer chain lengths (Kif18B and Tubb3)
• Peptide scrambling- change AA sequence
order
• Measure IL-12 cytokine production in
different cell lines, such as JAWS-II
• Investigate production of other cytokines,
such as TNF-alpha
• Investigate adjuvant properties using
different sized AuNPs
Additional AuNV information
We investigated the effect of different
AuNVs at four specific dosages on the
production of the IL-12 cytokine in
J774A.1 macrophages as well as
demonstrated their non-toxicity. Both
AuNP-PEG-GP100 and AuNP-PEG-OVA
produced the most IL-12, indicating
potential use in future in vivo experiments.
However, this does not discredit other
AuNVs, such as AuNP-PEG-Trp2, from
further investigation because the uptake
mechanism might differ, possibly inducing
production of different cytokines.
Understanding the adjuvant properties of
different AuNVs allows us to improve the
AuNVs with weaker adjuvant properties
and use the AuNVs with the best adjuvant
properties for future studies.
APC
Figure 1: Overview of AuNV immunology
Macrophages produce cytokines to communicate with
CD4+ cells to coordinate an immune response. The
more cytokines produced correlates to a stronger
immune response.
CD4+ recruits CD8+
cytotoxic T-cells
AuNV activates antigen
presenting cells (APC)
AuNV
CD4+
AuNV activates
macrophages
CD8+
APC
Tumor
Mac
Mac activates
CD4+ helper
T-cells
AuNV DLS Results
AuNP-OVA: inconclusive
AuNP-GP100: 94.0 nm
AuNP-Trp2: inconclusive
AuNP-PEG: 68.9 nm
AuNP: 36.2 nm
0
5
10
15
20
25
30
ConcentrationofIL-12cytokine(pg/mL)
IL-12 cytokine production induced by various
AuNVs in vitro
3.1395E-14 g/cell
6.279E-14 g/cell
9.4185E-14 g/cell
1.2558E-13 g/cell