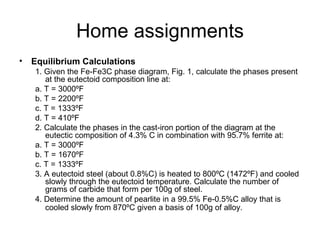
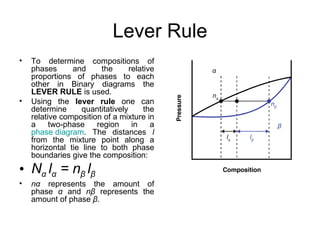
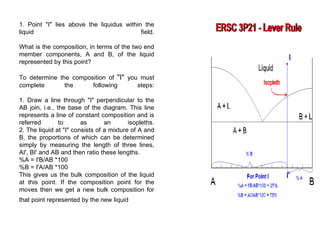
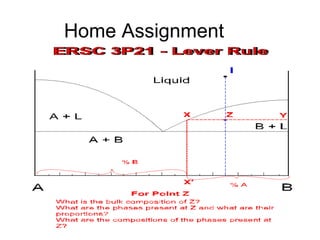
Downloaded 326 times

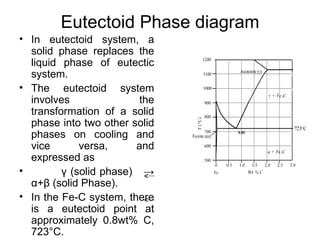
![Eutectoid
When the solution above the
transformation point is solid, rather than
liquid, an analogous eutectoid
transformation can occur.
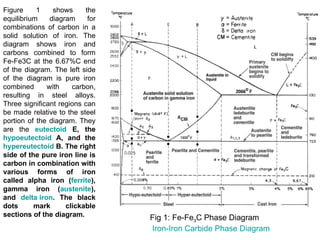
For instance, in the iron-carbon system,
the austenite phase can undergo a
eutectoid transformation to produce
ferrite and cementite (iron carbide),
often in lamellar structures such as
pearlite and bainite.
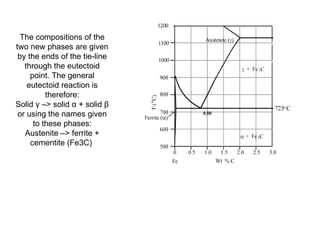
This eutectoid point occurs at 727°C
(1340.6 ºF) and about 0.83% carbon[5];
alloys of nearly this composition are
called high-carbon steel, while those Iron-carbon phase diagram, showing
which have less carbon are termed the euctectoid transformation
mild steel. The process analogous to between austenite (γ) and pearlite.
glass formation in this system is the
martensitic transformation.](https://image.slidesharecdn.com/phasediagrams-120310233557-phpapp02/85/Phase-diagrams-11-320.jpg)


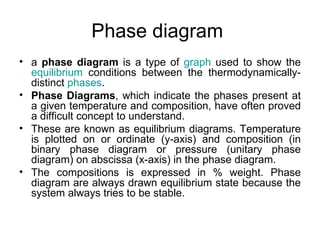
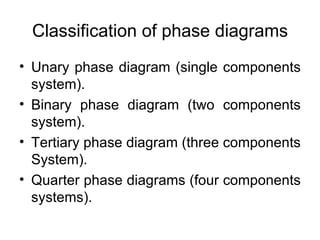
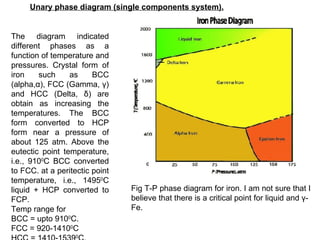
The document discusses phase diagrams and their classification. It defines a phase diagram as a graph used to show equilibrium conditions between thermodynamically distinct phases. It classifies phase diagrams as unary, binary, ternary and quaternary depending on the number of components involved. Binary phase diagrams are described in more detail, including examples of eutectic, eutectoid, peritectic and peritectoid diagrams. Gibbs' phase rule and its application to phase diagrams is also covered. Homework questions on interpreting phase diagrams and performing equilibrium calculations are provided.


