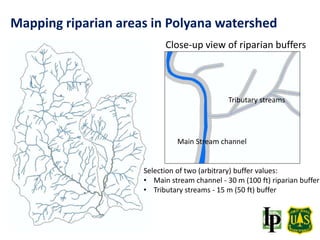
1. The document summarizes mapping riparian areas using both constant and variable buffer widths. It describes using 30m and 15m buffers for main streams and tributaries for the constant buffer approach.
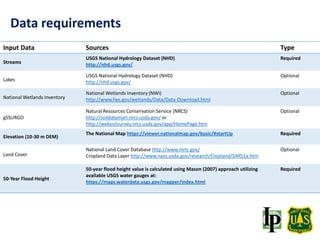
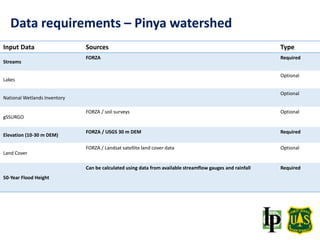
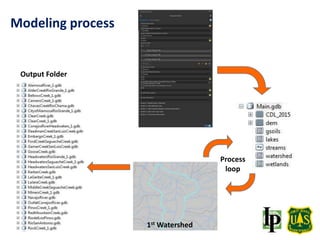
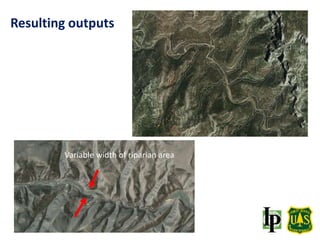
2. For the variable buffer approach, the document outlines using data on streams, lakes, wetlands, elevation, land cover, and flood heights. It also describes calculating a variable buffer width for each watershed cell.
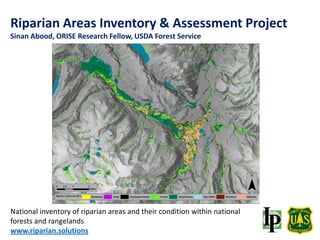
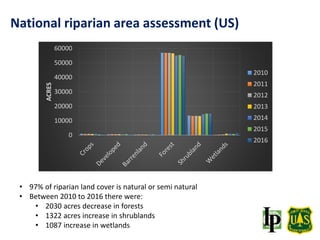
3. The document presents some results of mapping riparian area change from 2010 to 2016 in the US, finding a 2030 acre decrease in forests but increases of 1322 acres in shrublands and 1087 acres in wetlands.