The Ring programming language version 1.8 book - Part 13 of 202
•
0 likes•7 views

The Ring programming language version 1.8 book - Part 13 of 202

Recommended
Recommended
More Related Content
What's hot
What's hot (20)
Similar to The Ring programming language version 1.8 book - Part 13 of 202
Similar to The Ring programming language version 1.8 book - Part 13 of 202 (20)
More from Mahmoud Samir Fayed
More from Mahmoud Samir Fayed (20)
Recently uploaded
Recently uploaded (20)
The Ring programming language version 1.8 book - Part 13 of 202
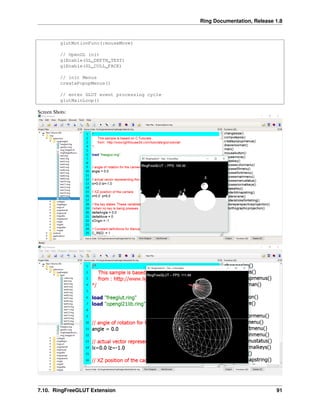
- 1. Ring Documentation, Release 1.8 glutMotionFunc(:mouseMove) // OpenGL init glEnable(GL_DEPTH_TEST) glEnable(GL_CULL_FACE) // init Menus createPopupMenus() // enter GLUT event processing cycle glutMainLoop() Screen Shots: 7.10. RingFreeGLUT Extension 91
- 2. Ring Documentation, Release 1.8 7.11 RingOpenGL Extension Ring 1.5 comes with RingOpenGL and support for the next versions • OpenGL 1.1 • OpenGL 1.2 • OpenGL 1.3 • OpenGL 1.4 • OpenGL 1.5 • OpenGL 2.0 • OpenGL 2.1 • OpenGL 3.0 • OpenGL 3.2 • OpenGL 3.3 • OpenGL 4.0 • OpenGL 4.1 • OpenGL 4.2 • OpenGL 4.3 • OpenGL 4.4 • OpenGL 4.5 • OpenGL 4.6 Example: /* This sample is based on C Tutorials from : http://www.wikihow.com/Make-a-Cube-in-OpenGL */ load "freeglut.ring" load "opengl21lib.ring" // ---------------------------------------------------------- // Global Variables // ---------------------------------------------------------- rotate_y=0 rotate_x=0 // ---------------------------------------------------------- // display() Callback function // ---------------------------------------------------------- func display // Clear screen and Z-buffer glClear(GL_COLOR_BUFFER_BIT|GL_DEPTH_BUFFER_BIT) // Reset transformations 7.11. RingOpenGL Extension 92
- 3. Ring Documentation, Release 1.8 glLoadIdentity() // Rotate when user changes rotate_x and rotate_y glRotatef( rotate_x, 1.0, 0.0, 0.0 ) glRotatef( rotate_y, 0.0, 1.0, 0.0 ) //Multi-colored side - FRONT glBegin(GL_POLYGON) glColor3f( 1.0, 0.0, 0.0 ) glVertex3f( 0.5, -0.5, -0.5 ) # P1 is red glColor3f( 0.0, 1.0, 0.0 ) glVertex3f( 0.5, 0.5, -0.5 ) # P2 is green glColor3f( 0.0, 0.0, 1.0 ) glVertex3f( -0.5, 0.5, -0.5 ) # P3 is blue glColor3f( 1.0, 0.0, 1.0 ) glVertex3f( -0.5, -0.5, -0.5 ) # P4 is purple glEnd() // White side - BACK glBegin(GL_POLYGON) glColor3f( 1.0, 1.0, 1.0 ) glVertex3f( 0.5, -0.5, 0.5 ) glVertex3f( 0.5, 0.5, 0.5 ) glVertex3f( -0.5, 0.5, 0.5 ) glVertex3f( -0.5, -0.5, 0.5 ) glEnd() // Purple side - RIGHT glBegin(GL_POLYGON) glColor3f( 1.0, 0.0, 1.0 ) glVertex3f( 0.5, -0.5, -0.5 ) glVertex3f( 0.5, 0.5, -0.5 ) glVertex3f( 0.5, 0.5, 0.5 ) glVertex3f( 0.5, -0.5, 0.5 ) glEnd() // Green side - LEFT glBegin(GL_POLYGON) glColor3f( 0.0, 1.0, 0.0 ) glVertex3f( -0.5, -0.5, 0.5 ) glVertex3f( -0.5, 0.5, 0.5 ) glVertex3f( -0.5, 0.5, -0.5 ) glVertex3f( -0.5, -0.5, -0.5 ) glEnd() // Blue side - TOP glBegin(GL_POLYGON) glColor3f( 0.0, 0.0, 1.0 ) glVertex3f( 0.5, 0.5, 0.5 ) glVertex3f( 0.5, 0.5, -0.5 ) glVertex3f( -0.5, 0.5, -0.5 ) glVertex3f( -0.5, 0.5, 0.5 ) glEnd() // Red side - BOTTOM glBegin(GL_POLYGON) glColor3f( 1.0, 0.0, 0.0 ) glVertex3f( 0.5, -0.5, -0.5 ) glVertex3f( 0.5, -0.5, 0.5 ) glVertex3f( -0.5, -0.5, 0.5 ) 7.11. RingOpenGL Extension 93
- 4. Ring Documentation, Release 1.8 glVertex3f( -0.5, -0.5, -0.5 ) glEnd() glFlush() glutSwapBuffers() // ---------------------------------------------------------- // specialKeys() Callback Function // ---------------------------------------------------------- func specialKeys key = glutEventKey() // Right arrow - increase rotation by 5 degree switch Key on GLUT_KEY_RIGHT rotate_y += 5 // Left arrow - decrease rotation by 5 degree on GLUT_KEY_LEFT rotate_y -= 5 on GLUT_KEY_UP rotate_x += 5 on GLUT_KEY_DOWN rotate_x -= 5 off // Request display update glutPostRedisplay() // ---------------------------------------------------------- // main() function // ---------------------------------------------------------- func main // Initialize GLUT and process user parameters glutInit() // Request double buffered true color window with Z-buffer glutInitDisplayMode(GLUT_DOUBLE | GLUT_RGB | GLUT_DEPTH) // Create window glutCreateWindow("Awesome Cube") // Enable Z-buffer depth test glEnable(GL_DEPTH_TEST) // Callback functions glutDisplayFunc(:display) glutSpecialFunc(:specialKeys) 7.11. RingOpenGL Extension 94
- 5. Ring Documentation, Release 1.8 // Pass control to GLUT for events glutMainLoop() // Return to OS Screen Shot: 7.12 Better Code Generator for Extensions The Code Generator is updated to support <constant> type, So we can have constants other than numbers, for example : Strings and Pointers. When we have pointers we can determine the pointer type. To use this feature, before <constant> and </constant> we can use $nDefaultConstantType = C_CONSTANT_TYPE_POINTER $cDefaultConstantPointerType = "void *" The next example from the RingFreeGLUT extension <runcode> $nDefaultConstantType = C_CONSTANT_TYPE_POINTER $cDefaultConstantPointerType = "void" </runcode> <constant> GLUT_STROKE_ROMAN GLUT_STROKE_MONO_ROMAN GLUT_BITMAP_9_BY_15 GLUT_BITMAP_8_BY_13 GLUT_BITMAP_TIMES_ROMAN_10 GLUT_BITMAP_TIMES_ROMAN_24 GLUT_BITMAP_HELVETICA_10 GLUT_BITMAP_HELVETICA_12 7.12. Better Code Generator for Extensions 95
- 6. Ring Documentation, Release 1.8 GLUT_BITMAP_HELVETICA_18 </constant> 7.13 Better Documentation Generator for Extensions The documentation generator for extensions is updated to generate a list of constants in the generated documentation The previous versions provides the functions prototype only, Now we have the list of constants too. 7.14 Ring VM - Tracing Functions In Ring 1.5 the next functions are added to Ring VM • RingVM_SetTrace(cCode) • RingVM_TraceData() –> aDataList • RingVM_TraceEvent() –> nTraceEvent • RingVM_TraceFunc() –> cCode • RingVM_ScopesCount() –> nScopes • RingVM_EvalInScope(nScope,cCode) • RingVM_PassError() • RingVM_HideErrorMsg(lStatus) • RingVM_CallFunc(cFuncName) Example: load "tracelib.ring" ringvm_settrace("mytrace()") see "Hello, world!" + nl see "Welcome" + nl see "How are you?" +nl mytest() new myclass { mymethod() } func mytest see "Message from mytest" + nl func mytrace see "====== The Trace function is Active ======" + nl + "Trace Function Name : " + ringvm_TraceFunc() + nl + "Trace Event : " switch ringvm_TraceEvent() on TRACEEVENT_NEWLINE see "New Line" on TRACEEVENT_NEWFUNC see "New Function" on TRACEEVENT_RETURN see "Return" on TRACEEVENT_ERROR see "Error" on TRACEEVENT_BEFORECFUNC see "Before C Function" on TRACEEVENT_AFTERCFUNC see "After C Function" off 7.13. Better Documentation Generator for Extensions 96
- 7. Ring Documentation, Release 1.8 see nl + "Line Number : " + ringvm_tracedata()[TRACEDATA_LINENUMBER] + nl + "File Name : " + ringvm_tracedata()[TRACEDATA_FILENAME] + nl + "Function Name : " + ringvm_tracedata()[TRACEDATA_FUNCNAME] + nl + "Method or Function : " if ringvm_tracedata()[TRACEDATA_METHODORFUNC] = TRACEDATA_METHODORFUNC_METHOD see "Method" else if ringvm_tracedata()[TRACEDATA_FUNCNAME] = NULL see "Command" else see "Function" ok ok see nl + Copy("=",42) + nl class myclass func mymethod see "Message from mymethod" + nl Output: ====== The Trace function is Active ====== Trace Function Name : mytrace() Trace Event : After C Function Line Number : 3 File Name : test1.ring Function Name : ringvm_settrace Method or Function : Function ========================================== ====== The Trace function is Active ====== Trace Function Name : mytrace() Trace Event : New Line Line Number : 5 File Name : test1.ring Function Name : Method or Function : Command ========================================== Hello, world! ====== The Trace function is Active ====== Trace Function Name : mytrace() Trace Event : New Line Line Number : 6 File Name : test1.ring Function Name : Method or Function : Command ========================================== Welcome ====== The Trace function is Active ====== Trace Function Name : mytrace() Trace Event : New Line Line Number : 7 File Name : test1.ring Function Name : Method or Function : Command ========================================== How are you? 7.14. Ring VM - Tracing Functions 97
- 8. Ring Documentation, Release 1.8 ====== The Trace function is Active ====== Trace Function Name : mytrace() Trace Event : New Line Line Number : 8 File Name : test1.ring Function Name : Method or Function : Command ========================================== ====== The Trace function is Active ====== Trace Function Name : mytrace() Trace Event : New Function Line Number : 8 File Name : test1.ring Function Name : mytest Method or Function : Function ========================================== ====== The Trace function is Active ====== Trace Function Name : mytrace() Trace Event : New Line Line Number : 12 File Name : test1.ring Function Name : mytest Method or Function : Function ========================================== Message from mytest ====== The Trace function is Active ====== Trace Function Name : mytrace() Trace Event : New Line Line Number : 14 File Name : test1.ring Function Name : mytest Method or Function : Function ========================================== ====== The Trace function is Active ====== Trace Function Name : mytrace() Trace Event : Return Line Number : 8 File Name : test1.ring Function Name : Method or Function : Command ========================================== ====== The Trace function is Active ====== Trace Function Name : mytrace() Trace Event : New Line Line Number : 9 File Name : test1.ring Function Name : Method or Function : Command ========================================== ====== The Trace function is Active ====== Trace Function Name : mytrace() Trace Event : New Line Line Number : 43 File Name : test1.ring Function Name : Method or Function : Command ========================================== ====== The Trace function is Active ====== 7.14. Ring VM - Tracing Functions 98
- 9. Ring Documentation, Release 1.8 Trace Function Name : mytrace() Trace Event : Before C Function Line Number : 9 File Name : test1.ring Function Name : ismethod Method or Function : Function ========================================== ====== The Trace function is Active ====== Trace Function Name : mytrace() Trace Event : After C Function Line Number : 9 File Name : test1.ring Function Name : ismethod Method or Function : Function ========================================== ====== The Trace function is Active ====== Trace Function Name : mytrace() Trace Event : New Function Line Number : 9 File Name : test1.ring Function Name : mymethod Method or Function : Method ========================================== ====== The Trace function is Active ====== Trace Function Name : mytrace() Trace Event : New Line Line Number : 44 File Name : test1.ring Function Name : mymethod Method or Function : Method ========================================== Message from mymethod ====== The Trace function is Active ====== Trace Function Name : mytrace() Trace Event : Return Line Number : 9 File Name : test1.ring Function Name : Method or Function : Command ========================================== ====== The Trace function is Active ====== Trace Function Name : mytrace() Trace Event : Before C Function Line Number : 9 File Name : test1.ring Function Name : ismethod Method or Function : Function ========================================== ====== The Trace function is Active ====== Trace Function Name : mytrace() Trace Event : After C Function Line Number : 9 File Name : test1.ring Function Name : ismethod Method or Function : Function ========================================== ====== The Trace function is Active ====== Trace Function Name : mytrace() 7.14. Ring VM - Tracing Functions 99
- 10. Ring Documentation, Release 1.8 Trace Event : Before C Function Line Number : 9 File Name : test1.ring Function Name : ismethod Method or Function : Function ========================================== ====== The Trace function is Active ====== Trace Function Name : mytrace() Trace Event : After C Function Line Number : 9 File Name : test1.ring Function Name : ismethod Method or Function : Function ========================================== ====== The Trace function is Active ====== Trace Function Name : mytrace() Trace Event : New Line Line Number : 11 File Name : test1.ring Function Name : Method or Function : Command ========================================== 7.15 Trace Library and Interactive Debugger Ring 1.5 comes with the Trace Library and the Interactive Debugger Using this library we can trace events, execute programs line by line, open the Interactive Debugger when an error happens or at breakpoints. Example: The next example uses a Breakpoint to open the Interactive Debugger! load "tracelib.ring" test1() func test1 x = 10 see :test1 + nl t = 12 BreakPoint() see "After breakpoint!" +nl see "t = " + t + nl see "End of program!" + nl Screen Shots: We have the Interactive Debugger at the Breakpoint! 7.15. Trace Library and Interactive Debugger 100