The Ring programming language version 1.5.4 book - Part 78 of 185
•
0 likes•9 views

The Ring programming language version 1.5.4 book - Part 78 of 185

Recommended
Recommended
More Related Content
What's hot
What's hot (20)
Similar to The Ring programming language version 1.5.4 book - Part 78 of 185
Similar to The Ring programming language version 1.5.4 book - Part 78 of 185 (20)
More from Mahmoud Samir Fayed
More from Mahmoud Samir Fayed (20)
Recently uploaded
Recently uploaded (20)
The Ring programming language version 1.5.4 book - Part 78 of 185
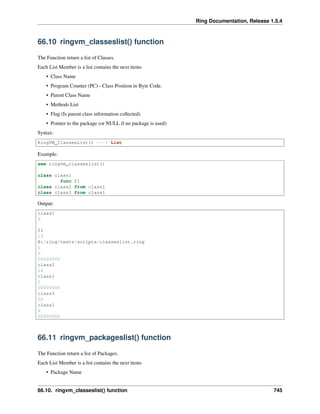
- 1. Ring Documentation, Release 1.5.4 66.10 ringvm_classeslist() function The Function return a list of Classes. Each List Member is a list contains the next items • Class Name • Program Counter (PC) - Class Position in Byte Code. • Parent Class Name • Methods List • Flag (Is parent class information collected) • Pointer to the package (or NULL if no package is used) Syntax: RingVM_ClassesList() ---> List Example: see ringvm_classeslist() class class1 func f1 class class2 from class1 class class3 from class1 Output: class1 9 f1 13 B:/ring/tests/scripts/classeslist.ring 0 0 00000000 class2 16 class1 0 00000000 class3 20 class1 0 00000000 66.11 ringvm_packageslist() function The Function return a list of Packages. Each List Member is a list contains the next items • Package Name 66.10. ringvm_classeslist() function 745
- 2. Ring Documentation, Release 1.5.4 • Classes List Syntax: RingVM_PackagesList() ---> List Example: see ringvm_packageslist() package package1 class class1 package package2 class class1 package package3 class class1 Output: package1 class1 11 0 00FEF838 package2 class1 17 0 00FEF978 package3 class1 23 0 00FEFF68 66.12 ringvm_memorylist() function The Function return a list of Memory Scopes and Variables. Each List Member is a list contains variables in a different scope. Each Item in the scope list is a list contains the next items • Variable Name • Variable Type • Variable Value • Pointer Type (List/Item) if the value is a list • Private Flag (if the variable is an attribute in a Class) Syntax: 66.12. ringvm_memorylist() function 746
- 3. Ring Documentation, Release 1.5.4 RingVM_MemoryList() ---> List Example: x = 10 test() func test y = 20 see ringvm_memorylist() Output: true 2 1 0 0 false 2 0 0 0 nl 1 0 0 null 1 0 0 ring_gettemp_var 4 00000000 0 0 ccatcherror 1 NULL 0 0 ring_settemp_var 4 00000000 0 0 ring_tempflag_var 2 0 0 0 stdin 3 50512DB8 file 0 0 66.12. ringvm_memorylist() function 747
- 4. Ring Documentation, Release 1.5.4 0 stdout 3 50512DD8 file 0 0 0 stderr 3 50512DF8 file 0 0 0 this 4 00000000 0 0 sysargv 3 B:ringbin/ring B:/ring/tests/scripts/memorylist.ring 0 0 x 2 10 0 0 y 2 20 0 0 66.13 ringvm_calllist() function The Function return a list of the functions call list. Each List Member is a list contains the next items • Function Type • Function Name • Program Counter (PC) • Stack Pointer (SP) • Temp. Memory List • Method or Function Flag • Caller PC • FuncExec Flag • ListStart Flag 66.13. ringvm_calllist() function 748
- 5. Ring Documentation, Release 1.5.4 • Nested Lists Pointer • State List Syntax: RingVM_CallList() ---> List Example: hello() func hello test() func test mylist = ringvm_calllist() for t in mylist see t[2] + nl next Output: function hello() in file B:/ring/tests/scripts/calllist.ring called from line 1 function test() in file B:/ring/tests/scripts/calllist.ring called from line 3 ringvm_calllist 66.14 ringvm_fileslist() function Function return a list of the Ring Files. Syntax: RingVM_FilesList() ---> List Example: load "stdlib.ring" see ringvm_fileslist() Output: B:/ring/tests/scripts/fileslist.ring B:ringbinstdlib.ring eval stdlib.ring stdlib.rh stdclasses.ring stdfunctions.ring stdbase.ring stdstring.ring stdlist.ring stdstack.ring stdqueue.ring stdmath.ring stddatetime.ring stdfile.ring stdsystem.ring stddebug.ring stddatatype.ring 66.14. ringvm_fileslist() function 749
- 6. Ring Documentation, Release 1.5.4 stdconversion.ring stdodbc.ring stdmysql.ring stdsecurity.ring stdinternet.ring stdhashtable.ring stdtree.ring 66.15 ringvm_settrace() The function ringvm_settrace() determine the Trace function name The trace function is a Ring function that will be called for each event Syntax: RingVM_SetTrace(cCode) 66.16 ringvm_tracedata() Inside the function that we will use for tracing events We can use the ringvm_tracedata() function to get the event data. The event data is a list contains the next items • The Source Code Line Number • The Source File Name • The Function/Method Name • Method or Function (Bool : True=Method, False=Function/File) Syntax: RingVM_TraceData() ---> aDataList 66.17 ringvm_traceevent() Inside the function that we will use for tracing events We can use ringvm_traceevent() to know the event type • New Line • Before Function • After Function • Runtime Error • Before C Function • After C Function Syntax: 66.15. ringvm_settrace() 750
- 7. Ring Documentation, Release 1.5.4 RingVM_TraceEvent() ---> nTraceEvent 66.18 ringvm_tracefunc() The function return the name of the function that we are using for tracing events. Syntax: RingVM_TraceEvent() ---> cCode 66.19 ringvm_scopescount() We can use the RingVM_ScopesCount() function to know the number of scopes used in the application. In the start of the program, We have the (global scope only) When we call a function, A new scope is created. When the function execution is done, the function scope is deleted. Syntax: RingVM_ScopesCount() ---> nScopes 66.20 ringvm_evalinscope() The function ringvm_evalinscope() is similar to the eval() function Unlike eval() which execute the code in the current scope Using RingVM_EvalInScope() we can execute the scope in a specific scope. Syntax: RingVM_EvalInScope(nScope,cCode) 66.21 ringvm_passerror() When we have runtime error, After printing the Error message, Ring will end the execution of the program. Using ringvm_passerror() we can avoid that, and continue the execution of our program. Syntax: RingVM_PassError() 66.22 ringvm_hideerrormsg() We can disable/enable displaying the runtime error messages using the RingVM_HideErrorMsg() function. Syntax: 66.18. ringvm_tracefunc() 751
- 8. Ring Documentation, Release 1.5.4 RingVM_HideErrorMsg(lStatus) 66.23 ringvm_callfunc() We can call a function from a string without using eval() using the ringvm_callfunc() Syntax: RingVM_CallFunc(cFuncName) 66.24 Example - Using the Trace Functions The next example use the Trace Functions to trace the program Events! In practical, We will use the Trace Library instead of these low level functions! load "tracelib.ring" ringvm_settrace("mytrace()") see "Hello, world!" + nl see "Welcome" + nl see "How are you?" +nl mytest() new myclass { mymethod() } func mytest see "Message from mytest" + nl func mytrace see "====== The Trace function is Active ======" + nl + "Trace Function Name : " + ringvm_TraceFunc() + nl + "Trace Event : " switch ringvm_TraceEvent() on TRACEEVENT_NEWLINE see "New Line" on TRACEEVENT_NEWFUNC see "New Function" on TRACEEVENT_RETURN see "Return" on TRACEEVENT_ERROR see "Error" on TRACEEVENT_BEFORECFUNC see "Before C Function" on TRACEEVENT_AFTERCFUNC see "After C Function" off see nl + "Line Number : " + ringvm_tracedata()[TRACEDATA_LINENUMBER] + nl + "File Name : " + ringvm_tracedata()[TRACEDATA_FILENAME] + nl + "Function Name : " + ringvm_tracedata()[TRACEDATA_FUNCNAME] + nl + "Method or Function : " if ringvm_tracedata()[TRACEDATA_METHODORFUNC] = TRACEDATA_METHODORFUNC_METHOD see "Method" else if ringvm_tracedata()[TRACEDATA_FUNCNAME] = NULL see "Command" else see "Function" 66.23. ringvm_callfunc() 752
- 9. Ring Documentation, Release 1.5.4 ok ok see nl + Copy("=",42) + nl class myclass func mymethod see "Message from mymethod" + nl Output: ====== The Trace function is Active ====== Trace Function Name : mytrace() Trace Event : After C Function Line Number : 3 File Name : test1.ring Function Name : ringvm_settrace Method or Function : Function ========================================== ====== The Trace function is Active ====== Trace Function Name : mytrace() Trace Event : New Line Line Number : 5 File Name : test1.ring Function Name : Method or Function : Command ========================================== Hello, world! ====== The Trace function is Active ====== Trace Function Name : mytrace() Trace Event : New Line Line Number : 6 File Name : test1.ring Function Name : Method or Function : Command ========================================== Welcome ====== The Trace function is Active ====== Trace Function Name : mytrace() Trace Event : New Line Line Number : 7 File Name : test1.ring Function Name : Method or Function : Command ========================================== How are you? ====== The Trace function is Active ====== Trace Function Name : mytrace() Trace Event : New Line Line Number : 8 File Name : test1.ring Function Name : Method or Function : Command ========================================== ====== The Trace function is Active ====== Trace Function Name : mytrace() Trace Event : New Function Line Number : 8 File Name : test1.ring 66.24. Example - Using the Trace Functions 753
- 10. Ring Documentation, Release 1.5.4 Function Name : mytest Method or Function : Function ========================================== ====== The Trace function is Active ====== Trace Function Name : mytrace() Trace Event : New Line Line Number : 12 File Name : test1.ring Function Name : mytest Method or Function : Function ========================================== Message from mytest ====== The Trace function is Active ====== Trace Function Name : mytrace() Trace Event : New Line Line Number : 14 File Name : test1.ring Function Name : mytest Method or Function : Function ========================================== ====== The Trace function is Active ====== Trace Function Name : mytrace() Trace Event : Return Line Number : 8 File Name : test1.ring Function Name : Method or Function : Command ========================================== ====== The Trace function is Active ====== Trace Function Name : mytrace() Trace Event : New Line Line Number : 9 File Name : test1.ring Function Name : Method or Function : Command ========================================== ====== The Trace function is Active ====== Trace Function Name : mytrace() Trace Event : New Line Line Number : 43 File Name : test1.ring Function Name : Method or Function : Command ========================================== ====== The Trace function is Active ====== Trace Function Name : mytrace() Trace Event : Before C Function Line Number : 9 File Name : test1.ring Function Name : ismethod Method or Function : Function ========================================== ====== The Trace function is Active ====== Trace Function Name : mytrace() Trace Event : After C Function Line Number : 9 File Name : test1.ring Function Name : ismethod 66.24. Example - Using the Trace Functions 754