
Recommended
Recommended
More Related Content
Similar to tech-uk-02-RSS simple explications.pdf
Similar to tech-uk-02-RSS simple explications.pdf (20)
More from michellouisfriedman
More from michellouisfriedman (19)
Recently uploaded
Recently uploaded (20)
tech-uk-02-RSS simple explications.pdf
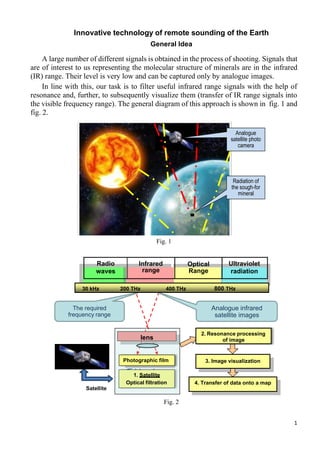
- 1. 1 Fig. 2 О T pt he icreq al F i u i r l t e r e d s Innovative technology of remote sounding of the Earth General Idea A large number of different signals is obtained in the process of shooting. Signals that are of interest to us representing the molecular structure of minerals are in the infrared (IR) range. Their level is very low and can be captured only by analogue images. In line with this, our task is to filter useful infrared range signals with the help of resonance and, further, to subsequently visualize them (transfer of IR range signals into the visible frequency range). The general diagram of this approach is shown in fig. 1 and fig. 2. Fig. 1 Radio waves Infrared range Optical Range Ultraviolet radiation Fig. 2 Analogue satellite photo сamera Radiation of the sough-for mineral The required frequency range Analogue infrared satellite images Satellite 4. Transfer of data onto a map 3. Image visualization 2. Resonance processing of image 1. Satellite Optical filtration Photographic film lens 30 kHz 200 THz 400 THz 800 THz
- 2. 2 Sequence of Works on Remote Survey of Areas 1. Preparatory works Fig. 3 Fig. 4 Fig. 5 Further the test wafers are used as a resonator during radiation-chemical processing of analogue satellite images of the territory obtained in the infrared range. Base № 1 1.2. Laboratory manufacture of test gel wafers Vacuum sputtering of gels and reference materials 1 N 1.1. Ordering and receiving analog infrared satellite imagery survey territory Test wafer № 1 Test wafer № N Reprinter
- 3. 3 2. Identification of the Sought-for Objects 2.1. Radiation-chemical processing of satellite images in the presence of test gel wafers in accordance with the patented technology Satellite image Test wafer X-ray film Location map Fig. 6 2.2. Chemical processing of exposed X-ray film 2.3. Visualization of the detected objects in high-tension impulse field High-tension impulse voltage Visualization and transfer of contours of deposits onto a map Computer Fig. 7 Radiation and chemical processing of analogue satellite images Isotrope α + γ radiation Radiation and chemical processing of analogue satellite images Resonancе Result Combined in a “sandwich” and placed in the IR-100 reactor zone Visualization and transfer of contours of deposits onto a map
- 4. 4 2.4. Detected object snap (fixation) Outcome – direction visualization of ground contours of deposits and calculation of occurrence depths of their horizons. 3. Analytic data processing Obtainment of deposit parameters: - coordinates of ground contours of the detected deposits, - number of horizons, - occurrence depths of horizons and their thickness, - reservoir rocks, - inundation of horizons - presence of gas caps and pressure in them. 4. Preparation and submission of report to the Customer Location map making, contouring of deposits, calculation of expected reserves of hydrocarbons, preparation of explanatory part of the report. Technical implementation Contouring Transfer contours on the map Depth calculation Deposit of oil Used physical effects Nuclear magnetic and paramagnetic resonance, Transfer of own spectral characteristics of samples of minerals onto test wafers, Electromagnetic object visualization. Equipment and materials Special chemical laboratory, Isotrope source of α and γ radiation, Analogue satellite images of a survey territory in infrared range, High-purity chemical reagents, High-sensitivity X-ray film.
- 5. 5 Duration of the survey (depending on the size) From 1 to 3 months