Tampa BSides - Chef's Tour of Microsoft Security Adoption Framework (SAF)
Plot to catchment impacts of prescribed fire on soil erosion
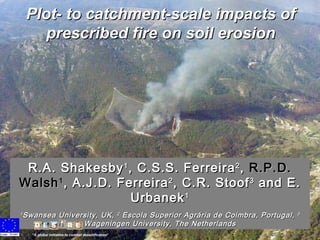
1. Plot- to catchment-scale impacts of prescribed fire on soil erosion R.A. Shakesby 1 , C.S.S. Ferreira 2 , R.P.D. Walsh 1 , A.J.D. Ferreira 2 , C.R. Stoof 3 and E. Urbanek 1 1 Swansea University, UK, 2 Escola Superior Agr ária de Coimbra, Portugal, 3 Wageningen University, The Netherlands “ A global initiative to combat desertification ”
6. Post-fire vegetation recovery Near to the watershed Lower impact on vegetation and litter Near the main drainage line Higher impact on vegetation and litter 1 month after fire 1 month after fire 4 months after fire 4 months after fire
7.
8. Water repellency – post-fire Surface soil remained water repellent after fire, indicating relatively low soil temperatures reached during fire
21. 0.001 0.01 0.1 1.0 10.0 Unburned Low-mod. fire severity High fire severity Erosion rate (t/ha/yr) Mediterranean data modified from Pausas et al., International Journal of Wildland Fire (2008) Estimated and measured annual post-fire erosion rates: study sites vs Mediterranean-wide values 0.0001 V Torto (bounded plot) V Torto (sub-catchment weir pool) V Torto – post-fire? Camelo - wildfire Espinho (control catchment)
22.
Editor's Notes
This presentation describes collaborative research between Escola Superior Agraria de Coimbra (ESAC), Swansea University and Wageningen University in the DESIRE project, which is investigating desertification andits mitigation. We are considering fire as a land degradation agent. Prescribed fire is a well known management tool for limiting the devastating effect of wildfire. There are a number of studies of prescribed fire effects, but few if any in the mainstream literature deal with prescribed fire effects in Portugal. According to Rego et al. (1987), prescribed fire was first described in Portugal in the early 19th century. An important question is whether prescribed fire in Portugal is indeed less damaging from an erosion point of view vs wildfire, and if so how much less damaging. Prescribed fire as we know it today was first used in Portugal in 1970, but only after 1980 were there many people working on it. It has increased in popularity as a potential management tool in Portugal since devastating wildfires in 2003 and 2006, in particular. In response to the first of these devastating ‘fire years’, the “Plano Nacional de Defesa da Floresta Contra Incêndios (PNDFCI)” (National Plan to Prevent Forest Wildfires) was made law in May 2006. Bulldozing is an alternative management tool but is recognized as causing increased soil erosion, so it is only used to make what are judged to be essential fire breaks. The DESIRE research project is concerned with identifying possible promising means of preventing or reducing the effects of desertification. Wildfire is one agent causing desertification. Prescribed fire is one tool to reduce the damaging effects of wildfire. This presentation considers early results of monitoring erosion from an ´’experimental’ fire (effectively, a ‘worst-case-scenario’ prescribed fire). (However, our sites are not in the hottest fire area.) ( Possibly useful information: Movement of the fire front in a real fire can be 50-60 m/hr, but in a prescribed fire in a Pinus area, it is usually only 5-10 m/hr. The fire intensity for a wildfire is 1000 kW/m, but for a prescribed fire it is usually c. 500 kW/m. Prescribed fire is done during the winter for wildfire prevention and during the summer to fight wildfires. Weather conditions are important for prescribed-fires: air temperature (±25ºC), moisture content (>35%), wind speed (maximum: 35km/h, ideal: 20-25km/h) and direction)
Vale Torto catchment lies in central Portugal some 50 km E of Coimbra. Mean annual rainfall is slightly more than 1000 mm (Carla estimates 1021 mm). The fuel load is high. It was estimated from 3 lines of 1 x 1m plots. The actual measurement is 2.3 kg/m2, which I calculate as 23 t/ha. This would rate as a high load for forest, but probably this is because there would not be such a high ground floor load in a forest. The catchment has been the subject of monitoring on earlier projects – hence the long-term records of erosion. Hottest area (5) is actually near the drainage line and doesn´t affect our measurements at the sediment fences.
Originally the fire was intended for early November, but it was delayed due to unsuitable weather. Fire was started from the catchment boundaries and allowed to burn more ‘freely’ and hotter towards the main channel. Speed of movement of the fire front and intensity were higher than expected for a prescribed fire, other than near the upper catchment boundaries.
The fire was started near the catchment boundaries (photo, right) and it was allowed to move progressively towards the valley bottom. Thermocouples and temperature-sensitive paints painted onto metal bars protected by a second, covering metal bar (see bottom image), were used to monitor temperatures reached in the soil. An infra-red ‘gun’ was used to measure flame temperatures (see photo left).
The fire burnt as a more or less ‘classic’ prescribed fire near the watershed (indicated by some barely touched vegetation) but this was not the case nearer the main drainage line in the valley bottom. The fire represents a ‘worst case scenario’ prescribed fire, and may be described as an experimental fire. There is some suggestion that the vegetation recovery has been better at the catchment boundary compared with nearer the main drainage line where the fire was hotter, but the carqueija is resprouting witout any problem.
The opportunity was taken to include monitoring of wildfire-affected hillslopes not far from Vale Torto. The fire occurred during summer 2008 and so preceded the Vale Torto experimental fire by some 8 months. More than double the fuel load compared with Vale Torto. From a distance vegetation recovery looks good by June 2009, but vegetation cover is only slightly greater than at Vale Torto from a visual impression.
Water repellency present in the post-fire surface soil at both sites. This photo shows the soil immediately below the thin ash and char layer at Camelo.
(The sediment fences are known as silt fences by Pete Robichaud (??), Lee MacDonald (??) and others who developed this approach.) Espinho catchment is about 6.5 ha in size, and so is somewhat smaller than Vale Torto (9 ha), but not too different in size.
The weir pool was set up some 10 years ago to monitor runoff from part of the catchment in Vale Torto. However, the pool behind the weir provides a good site to trap sediment
Sediment fence 1 has the largest contributing area of the 4 sediment fences installed prior to the fire. The geotextile fabric for all the fences was removed immediately prior to fire and new fabric reinstalled prior to the first rainfall event following fire. Vegetation recovery is mainly by resprouting, especially of so-called carqueija which forms most of the vegetation in the latest picture. Ground cover by vegetation is still relatively small (no figures at present).
The contributing areas and locations of sediment fences 1-4 and for the subcatchment weir pool are shown in this image. The first picture is an aerial photo of Vale Torto from Google Earth. Clicking ‘Enter’ or down-arrow fades in the GIS image on top of the aerial photo. (It is not possible to make the map semi-transparent, unfortunately.)
The rainfall simulator has two hand pumps (orange, near Carla) to maintain a near-constant pressure at the spray nozzle, which ensures that the rate of rainfall delivery remains similar throughout each experiment. The two pumps are connected to a switchable T-valve in order to switch between the two pumps to maintain a constant pressure. All simulation plots are located near to the original 4 sediment fences, so only the one near SF1, which is the sediment fence closest to the main drainage line, is right in the zone of comparatively high fire severity. The simulator is protected with a plastic curtain to prevent wind movement affecting the spray.
Plots kept ‘open’ at the upper and lower ends between simulations in an attempt to prevent too much interference with hillslope processes between measurements.
Camelo. Curiously, sediment losses during entirely dry period (8) produce the largest loss of amount of sediment per unit area for 2 fences (1 & 3). There is a surprisingly large amount of collected material in pre-fire period 6, when rainfall was high and there was a large number of wet days. Generally the amount of material collected post-fire exceeds that collected pre-fire. Sorry about the commas instead of points – Portuguese computers!! Rainfall ‘intensities’ indicated by the following: Period 1 Period 2 Period 3 Period 4 Period 5 Period 6 Period 7 Period 8 Period 9 Total 81 10 15 8 95 660 60 0 90 Days >= 10 mm 2 0 1 0 2 26 2 0 4 Days>= 20 mm 1 0 0 0 2 11 2 0 0
Period 8 had no rainfall (March 13-24).
In late March, there was a period with no rain, but there were still appreciable quantities of ash and char collected in the sediment fences which therefore reached the sediment fence by wind action assisted by gravity. The amounts collected on the fence ‘aprons’ following this rainless c. 12-day period were measured. The highest amount was 1.2 kg in sediment fence 1, shown in the photograph. Other amounts trapped behind the sediment fences range from 56-450g. All material was ash and char (Carla had recorded actual vegetation which I misinterpreted as organic matter content previously!). Very little has been written about wind blowing of post-fire ash or sediment but it was observed having a major effect on the exposed slopes of both the Camelo and Vale Torto sites after fire.
Figures are averaged for 3-4 plots in Vale Torto and for 3 plots for Camelo (burnt) and 2 plots for Camelo (unburnt). Wet and dry refer to wet antecedent and dry antecedent conditions. Soil was probably reasonably dry when the post-fire simulations were carried out. There is only one plot collecting sediment from the road in Vale Torto. The simulations were conducted during 1 hour. The Camelo plots are on 17-19 degree angles. The simulated rainfall rate is 43 +/- 3 mm/hr. Post-fire 1 was soon after fire and post-fire 2 in May. Drop in sediment loss on road between the two simulation is probably aresult of disturbance during the fire and settling down by May 2009. Nte that there is a large variation in suspended sediment between plots at Camelo and Vale Torto, as follows: Camelo – (270-4183) VTorto(wet) (0-1949) VTorto (dry) (0-737) VTorto (post-fire 1) (28-1162) VTorto (post-fire 2 in May 2009) (25-6438) Also note that I cheated by including results for one simulation plot in the post-fire period at Vale Torto that had been ‘lost’ during the pre-fire period(!). I didn’t think it warranted an explanation here – there isn’t enough time. The difference between pre-burn and post-burn suspended seds for V Torto is small. Camelo on the other hand, shows a big difference between unburnt site (1 st bar) and sediment losses at the burnt sites and this is despite a smaller volume of runoff. For V Torto, there is no evidence for water repellency having a marked effect as runoff and sediment losses are actually lower for the pre-burn dry conditions than for the wet conditions. (However, the plots are small and there is a big variation between the plots.) Post-fire erosion at Vale Torto is actually less than during wet conditions pre-fire!! The rainfall simulations for the road are much larger, showing that fire is a less effective disturbance factor in producing sediment than human-induced disturbance, by bulldozing in this case. Earlier work in the Agueda Basin showed that deep ploughing also led to high rates of erosion. The likelihood is that ploughing and bulldozing upset the stability of the surface caused by a stone lag cover.
One rainfall simulation plot (results on previous slide) was placed on this road. Also a sediment fence (although results not presented here.)
Espinho is a similarly sized catchment to V Torto.
Pausas et al. compiled erosion rates for years 1 and 2 after fire from available data from scrub and forest environments across the Mediterranean gleaned from the literature. The data they quote are essentially plot-based and would be expected to be relatively high compared with the hillslope scale for Vale Torto and Camelo results. There are insufficient data after the experimental fire in V Torto so far to suggest what the erosion rate will be, but the probable range is indicated by the vertical dashed line.
Nutrient losses according to Thomas et al. (1999, 2000) for the Agueda Basin showed that P losses in the very thin soil amounted to up to 50% of the soil store. There was no indication of where replacement of P might come from. Similar losses were reported for nutrient losses in overland flow. Prescribed fire timing: if it is scheduled for after the highest rainfall period (i.e. winter), then erosion will tend to be limited as the vegetation will have recovered by the following autumn when heavy rains returned. Very little has been written about wind action as a post-fire sediment redistribution process.