SlideShare a Scribd company logo
1 of 95
PERSPECTIVE
n engl j med 368;6 nejm.org february 7, 2013496
for aging. Highlighting the field’s
orphan status, a decade-long ini-
tiative by the Substance Abuse and
Mental Health Services Adminis-
tration implementing evidence-
based geriatric mental health
and substance-abuse programs
throughout the country was re-
cently eliminated, just as the
wave of Baby Boomers turning
65 began to crest.1 On the re-
search front, National Institutes
of Health policy has inexplicably
allowed the systematic exclusion
of study participants over 65
years of age in federally funded
research involving adults (but re-
quires detailed justification for
research that excludes women,
minority groups, and children).
This policy forces clinicians to
extrapolate from findings on the
safety and effectiveness of treat-
ments that have been tested only
in younger adults, and it perpetu-
ates what has been called the “ev-
idence-free” practice of geriatrics.
We believe that steps should be
taken to mandate the inclusion of
older adults in federally funded
research unless there is scientific
justification for excluding them,
and we agree with the IOM that
immediate steps are needed to re-
store the national program sup-
porting the implementation of
geriatric community mental health
and substance-use programs.
Emerging Medicare accountable
care organizations should inte-
grate geriatric mental health and
substance-use expertise as com-
ponents of health coaching and
chronic disease management for
patients with complex, high-cost
health conditions. The potential
for prevention must also be
tapped, in part through the adop-
tion of evidence-based psycholog-
ical interventions that reduce the
incidence of depression among
patients with health conditions
associated with greater risk, such
as stroke and macular degenera-
tion. Finally, the fragmentation and
neglect of services and research
may be addressed by creating a
dedicated federal office responsi-
ble for overseeing funding and
coordination across the different
agencies responsible for aging,
mental health, and substance-use
disorders.
Although these reforms are
necessary first steps, they will be
insufficient without dramatic
changes in what we do and how
we do it. If we recognize that
mental health care is a core com-
ponent of general health care for
aging Americans and transform
the health care workforce ac-
cordingly, there may be hope that
we can weather the approaching
“silver tsunami.”
Disclosure forms provided by the authors
are available with the full text of this article
at NEJM.org.
From the Departments of Psychiatry and of
Community and Family Medicine, Geisel
School of Medicine at Dartmouth, Ha-
nover, NH (S.J.B.); and the Dartmouth In-
stitute for Health Policy and Clinical Prac-
tice, Lebanon, NH (S.J.B., J.A.N.).
This article was published on January 23,
2013, and updated on February 7, 2013, at
NEJM.org.
1. Institute of Medicine. The mental health
and substance use workforce for older
adults: in whose hands? Washington, DC:
National Academies Press, 2012.
2. Bartels SJ, Clark RE, Peacock WJ, Dums
AR, Pratt SI. Medicare and Medicaid costs
for schizophrenia patients by age cohort
compared with costs for depression, demen-
tia, and medically ill patients. Am J Geriatr
Psychiatry 2003;11:648-57.
3. Diachun LL, Charise A, Lingard L. Old
news: why the 90-year crisis in medical elder
care? J Am Geriatr Soc 2012;60:1357-60.
4. Reynolds CF III, Albert SM. Management
of mental disorders: lessons from India. Lan-
cet 2010;376:2045-6.
5. Patel V, Araya R, Chatterjee S, et al. Treat-
ment and prevention of mental disorders in
low-income and middle-income countries.
Lancet 2007;370:991-1005.
DOI: 10.1056/NEJMp1211456
Copyright © 2013 Massachusetts Medical Society.
Underside of the Silver Tsunami
U.S. Governors and the Medicaid Expansion —
No Quick
Resolution in Sight
Benjamin D. Sommers, M.D., Ph.D., and Arnold M. Epstein,
M.D.
With President Barack Obama’s reelection in No-
vember, the Affordable Care Act
(ACA) will remain the law of the
land for the foreseeable future.
But since the Supreme Court rul-
ing on the ACA, states have been
grappling with the option the
Court presented — whether to
participate in the expansion of
Medicaid eligibility to all adults
with family incomes at or below
138% of the federal poverty level.
In the aftermath of the 2012
election, it is uncertain how this
process will play out, but what
the states decide will play a criti-
cal role in the future of the U.S.
health care system.
We undertook an in-depth ex-
ploration of the views expressed
by governors about the ACA Med-
icaid expansion from the time of
the Supreme Court ruling in
June through 1 month after the
November election. Although gov-
ernors are, of course, only part
of the state-level policymaking
process, they directly oversee
each state’s Medicaid program
n engl j med 368;6 nejm.org february 7, 2013
PERSPECTIVE
497
U.S. GovernorS and The Medicaid expanSion
in the executive branch and of-
ten set the terms of debate with
the legislature. We collected pub-
lic statements (for full methods
and references, see the Supple-
mentary Appendix, available with
the full text of this article at
NEJM.org)1,2 from documents
published in the summer and
fall of 2012. In five states with
newly elected governors, we in-
cluded campaign statements from
the winning candidate. We iden-
tified major themes voiced by
governors and cross-tabulated
them according to whether each
governor supports the expan-
sion, opposes it, or remains un-
decided (see Table 1). We then
identified any changes since the
election.
Table 1. Likelihood of U.S. Governors’ Support
for Expanding Medicaid under the ACA.*
State
(Governor’s Party)
View on
Medicaid Expansion
State
(Governor’s Party)
View on
Medicaid Expansion
Before
Election
After
Election†
Before
Election
After
Election†
Florida (R) Oppose Undecided Alabama (R) Undecided Oppose
Georgia (R) Oppose Oppose Alaska (R) Undecided Undecided
Iowa (R) Oppose Undecided Arizona (R) Undecided Undecided
Louisiana (R) Oppose Oppose Colorado (D) Undecided Support
Maine (R) Oppose Oppose Idaho (R) Undecided Undecided
Mississippi (R) Oppose Oppose Indiana (R)§ Undecided Oppose
Nebraska (R) Oppose Oppose Kansas (R) Undecided Undecided
South Carolina (R) Oppose Oppose Kentucky (D) Undecided
Undecided
Texas (R) Oppose Oppose Michigan (R) Undecided Undecided
Virginia (R) Oppose Oppose Missouri (D) Undecided Support
Arkansas (D) Support Support Montana (D)§ Undecided Support
California (D) Support Support Nevada (R) Undecided Support
Connecticut (D) Support Support New Hampshire (D)§
Undecided Support
Delaware (D) Support Support New Jersey (R) Undecided
Undecided
District of Columbia (D)‡ Support Support New Mexico (R)
Undecided Support
Hawaii (D) Support Support North Carolina (R)§ Undecided
Undecided
Illinois (D) Support Support North Dakota (R) Undecided
Undecided
Maryland (D) Support Support Ohio (R) Undecided Undecided
Massachusetts (D) Support Support Oklahoma (R) Undecided
Oppose
Minnesota (D) Support Support Pennsylvania (R) Undecided
Undecided
New York (D) Support Support South Dakota (R) Undecided
Oppose
Oregon (D) Support Support Tennessee (R) Undecided
Undecided
Rhode Island (I) Support Support Utah (R) Undecided
Undecided
Vermont (D) Support Support West Virginia (D) Undecided
Undecided
Washington (D)§ Support Support Wisconsin (R) Undecided
Undecided
Wyoming (R) Undecided Oppose
* ACA denotes Affordable Care Act, D Democrat, I
Independent, and R Republican.
† “After election” refers to views as of January 13, 2013. In
states with newly elected governors, “before election” refers to
the
views of the outgoing governor, and “after election” refers to
the views of the governor-elect.
‡ The mayor is the head of the government of the District of
Columbia. In our analysis, we therefore treated the mayor of the
District of Columbia as the figure comparable to the governors
in the 50 states.
§ In these states, a new governor was elected in November
2012.
PERSPECTIVE
n engl j med 368;6 nejm.org february 7, 2013498
Table 2 shows the most com-
mon themes, according to gov-
ernors’ support for or opposi-
tion to the Medicaid expansion.
Among governors opposed to
expanding Medicaid, statements
about affordability and impact
on state budgets were nearly
universal (92%). Cost concerns
fell into several categories. Some
pointed to the so-called wood-
work effect, in which the ACA
could draw previously eligible
but unenrolled persons into
Medicaid, at greater cost to the
state. More than half the gover-
nors opposing expansion pre-
dicted that the federal govern-
ment would renege on the
generous terms of the ACA and
scale back its share of Medicaid
spending. Newly elected Gover-
nor Mike Pence (R-IN) compared
the expansion to “the classic
gift of a baby elephant. . . .
The federal government says,
‘We’ll pay for all the hay — for
the first few years.’”
Beyond cost, governors ex-
pressed concern about the lack
of state f lexibility or their belief
that Medicaid may foster depen-
dence among beneficiaries. For
instance, Dennis Daugaard (R-SD)
declared that “able-bodied adults
should be self-reliant” — in con-
trast to children or people with
disabilities, the traditional Med-
icaid beneficiaries. Others argued
that Medicaid itself is the prob-
lem, calling it a “broken pro-
gram” that provides poor care.
Most vividly, Rick Perry (R-TX)
said that adding uninsured Tex-
ans to Medicaid is “not unlike
adding a thousand people to the
Titanic.”
Governors supporting the ex-
pansion focused on the desire to
expand coverage to uninsured
persons, arguing that insurance
would lead to greater access to
care and improved health. Jay
Nixon (D-MO) explained, “This
will improve the health and the
quality of life for hundreds of
thousands of Missourians.” Many
governors who support the Med-
icaid expansion argued that it
builds on previous coverage ex-
pansions in their states and that
it would actually save their
states money by replacing local
dollars with federal funds. Peter
Shumlin (D-VT) explained that
opponents “are acting like we are
not already paying for this. What
we’re proposing . . . is to pay
less for something that we are
already paying for right now.”
Among uncommitted gover-
nors, there were three dominant
themes. First, three quarters of
these governors said they need-
ed more information on federal
requirements, cost and enroll-
ment projections, and policy al-
ternatives. Second, affordability
was a key concern, including the
possibility of decreased federal
funding in the future; as Jan
U.S. GovernorS and The Medicaid expanSion
Table 2. Common Themes in Governors’
Statements on Expanding Medicaid,
Stratified by Support for or Opposition to the
Expansion.*
Group and Theme
No. of
Governors (%)
13 Governors opposing Medicaid expansion
Concerns about impact on state budget 12 (92)
States need more flexibility, freedom from federal oversight 9
(69)
Federal government will renege on funding 7 (54)
States would have to raise taxes to pay for it 7 (54)
Uncertainty, need more information 7 (54)
Medicaid is a “broken program,” harms its beneficiaries 5 (38)
Entitlement programs create dependency 4 (31)
18 Governors supporting Medicaid expansion
Medicaid will help cover the uninsured 14 (78)
Expansion bolsters state’s preexisting efforts in health care 11
(61)
Will save state or taxpayers money 7 (39)
Medicaid will improve people’s health 4 (22)
20 Undecided governors
Uncertainty, need more information 15 (75)
Concerns about impact on state budget 11 (55)
States need more flexibility, freedom from federal oversight 9
(45)
Worried about having to cut funding for education and other
programs
6 (30)
Waiting until after election to make decision 6 (30)
* Data are based on an analysis of 253 articles published
between June 28 and
December 7, 2012. Support for or opposition to the Medicaid
expansion was deter-
mined on the basis of the most recent comments made by
governors, their admin-
istrations, or both. Since the time of this analysis, 3 additional
governors announced
their support for the expansion in early January, bringing the
revised total to 21 gov-
ernors in support and 17 undecided. See the Supplementary
Appendix for details
on methods and a full reference list.
n engl j med 368;6 nejm.org february 7, 2013
PERSPECTIVE
499
U.S. GovernorS and The Medicaid expanSion
Brewer (R-AZ) explained, “At any
whim they could just pull the
money. So yeah, I’m a little gun-
shy.” Finally, early on, nearly one
third of undecided governors said
they were waiting until the elec-
tion to evaluate their options.
Although some may have ex-
pected the uncertainty to resolve
swiftly after the election, that
has not happened: as of January
2013, a total of 15 of the 26
governors who were undecided
before the election remained un-
decided (see Table 1). Some of
this uncertainty reflects ongo-
ing efforts to gather information
about what will be permissible
under the law. Several governors
petitioned Medicaid to permit
partial expansions, such as in-
cluding only people with in-
comes of up to 100% of the fed-
eral poverty level. They reasoned
that the federal government
would pay the full cost of tax
credits for people with incomes
between 100 and 138% of the
poverty level who sought health
insurance through an exchange,
whereas under the Medicaid ex-
pansion, states will have to pay
10% of the costs in the long
run. However, the Department of
Health and Human Services re-
cently clarified that partial expan-
sions would not be permitted.3
Some ACA supporters con-
tended that governors’ opposition
after the Supreme Court ruling
was simply preelection political
posturing and that most states
would find the ACA’s generous
federal funding impossible to
refuse.4 Some of the movement
since the election bolsters this
perspective: six governors have
newly announced their support,
including the first two Republi-
can governors to publicly en-
dorse the expansion. Two other
governors who previously op-
posed the expansion have now
indicated that their minds are
not completely made up. Rick
Scott (R-FL), previously one of
the most vocal opponents of the
law, explained, “The election is
over, and President Obama won.
I’m responsible for the families
of Florida. . . . If I can get to
yes, I want to get to yes.”
However, not everyone chang-
ing position has endorsed ex-
panding Medicaid. Five previously
undecided Republican governors
are now opposed, and some
governors say they won’t decide
until 2015 or 2016. Some oppo-
sition may remain a negotiating
ploy by governors with respect
to opposing lawmakers or the
federal government, but predic-
tions of a rapid, pro-expansion
resolution were apparently mis-
taken. Moreover, governors are
only part of the story; several
statehouses (including the Re-
publican-led Missouri legisla-
ture and the newly Democratic
Maine legislature) plan to op-
pose their governors’ positions
on the expansion.
Overall, these results demon-
strate governors’ conflicting
views about the value of expand-
ing insurance coverage versus
the costs and federal oversight
involved in doing so through
Medicaid. As the dust has set-
tled after the elections, no clear
consensus has emerged, with 17
states still undecided and well
under half supporting Medicaid
expansion. It now appears that
the ACA’s 2014 coverage expan-
sion will have large unintended
gaps, as low-income adults in at
least a dozen states remain in-
eligible for any kind of public
subsidy for health insurance. Al-
though those with incomes
above 100% of the federal pov-
erty level will be eligible for tax
credits for exchange coverage in
states that decline to expand
Medicaid, that will still leave
millions of adults living below
the poverty level without health
insurance and without the
means of acquiring it.
Though Medicaid was initially
enacted in 1965, nine states did
not participate until 1970 or lat-
er, and it took nearly 20 years
before the last holdout joined.5
One can only speculate about
whether that history is about to
be repeated, with insurance cov-
erage for millions and the fate of
the ACA hanging in the balance.
Disclosure forms provided by the au-
thors are available with the full text of this
article at NEJM.org.
From the Department of Health Policy and
Management, Harvard School of Public
Health, Boston.
This article was published on January 16,
2013, at NEJM.org.
1. Where each state stands on ACA’s Medic-
aid expansion. Washington, DC: Advisory
Board Company, 2012 (http://www.advisory
.com/Daily-Briefing/2012/11/09/
MedicaidMap).
2. Across the USA. McLean, VA: USA Today,
2012 (http://usatoday30.usatoday.com/news/
usaedition/2012-07-13-states13box_
st_u.htm).
3. Frequently asked questions on exchanges,
market reforms, and Medicaid. Baltimore:
Centers for Medicare & Medicaid Services,
December 10, 2012 (http://cciio.cms.gov/
resources/files/exchanges-faqs-12-10-2012
.pdf).
4. Medicaid expansion may turn out to be an
offer states can’t refuse. Mother Jones. July
18, 2012 (http://www.motherjones.com/
kevin-drum/2012/07/medicaid-expansion-
may-turn-out-be-offer-states-cant-refuse).
5. A historical review of how states have re-
sponded to the availability of federal funds
for health coverage. Washington, DC: Kaiser
Commission on Medicaid and the Uninsured,
August 2012 (http://www.kff.org/medicaid/
upload/8349.pdf).
DOI: 10.1056/NEJMp1215785
Copyright © 2013 Massachusetts Medical Society.
Reproduced with permission of the copyright owner. Further
reproduction prohibited without permission.
Findings from Massachusetts Health Reform: Lessons
for Other States
Sharon K. Long
Karen Stockley
Kate Willrich Nordahl
Coverage, Access, and
Affordability under
Health Reform:
Learning from the
Massachusetts Model
While the impacts of the Affordable Care Act will vary across
the states given their
different circumstances, Massachusetts’ 2006 reform initiative,
the template for
national reform, provides a preview of the potential gains in
insurance coverage, access
to and use of care, and health care affordability for the rest of
the nation. Under reform,
uninsurance in Massachusetts dropped by more than 50%, due,
in part, to an increase in
employer-sponsored coverage. Gains in health care access and
affordability were
widespread, including a 28% decline in unmet need for doctor
care and a 38% decline in
high out-of-pocket costs.
In April 2006, Massachusetts passed a compre-
hensive health reform bill, An Act Providing
Access To Affordable, Quality, Accountable
Health Care (Chapter 58 of the Acts of 2006),
that sought to move the state to near universal
coverage. That legislation provided the tem-
plate for the 2010 federal Affordable Care Act
(ACA). Massachusetts’ reform initiative, like
the ACA, includes, among other changes: an
expansion of publicly subsidized coverage for
low- and moderate-income people; the creation
of health insurance exchanges for individuals
and small businesses; insurance market re-
forms; a mandate that individuals obtain in-
surance coverage if affordable coverage is
available; and a requirement that employers
contribute toward health insurance premiums
for their workers or face a penalty.1 Given the
parallels with the Massachusetts legislation,
the experience under reform in Massachusetts
provides a preview of the potential implications
of the ACA for the rest of the nation. While
the impacts of the ACA will vary across the
states given the complexity of their health care
systems and policies in place prior to reform
and the differences in their choices under the
new law, the findings for Massachusetts are a
confirmation that major gains in coverage and
health care access are possible.
To provide an assessment of the potential
trajectory of the nation under the ACA based
on the Massachusetts example, this paper
summarizes the evidence of the impacts of
Massachusetts’ health reform effort on insur-
ance coverage, access to and use of care, and
health care affordability for individuals since
2006. Our primary focus is on the findings
based on the Massachusetts Health Reform
Survey (MHRS), a comprehensive survey of
nonelderly adults in Massachusetts that has
provided the core assessment of the state’s
reform effort to date (see, most recently, Long,
Sharon K. Long, Ph.D., is a senior fellow at the Urban Institute.
Karen Stockley, B.A., is a doctoral student in the
Department of Economics, Harvard University. Kate Willrich
Nordahl, M.S., is director of the Massachusetts Medicaid
Policy Institute, Blue Cross Blue Shield of Massachusetts
Foundation. Stockley acknowledges support from the
National Science Foundation Graduate Research Fellowship
under grant no. DGE-1144152. Address correspondence to
Dr. Long at the Urban Institute, 2100 M St. N.W.,Washington
DC 20037. Email: [email protected]
Inquiry 49: 303–316 (Winter 2012/2013). ’ 2012 Excellus
Health Plan, Inc.
ISSN 0046-9580 10.5034/inquiryjrnl_49.04.03
www.inquiryjournal.org 303
Stockley, and Dahlen 2012a,b). We supple-
ment that overview with findings from studies
that have used other data sources and methods
as a check on the MHRS results, with a focus
on studies that rely on stronger evaluation
designs than the pre/post model that is possible
with the MHRS. We end with a summary of
some of the key challenges that Massachusetts
has faced under health reform, the state’s
strategies in addressing those challenges, and
the prognosis for the ACA based on the
Massachusetts case study.
Comparison of Massachusetts Reform and
the ACA
As noted previously, there are many similar-
ities between Massachusetts’ health reform
and the ACA. Both include a requirement
for individuals to obtain health insurance if
affordable insurance is available to them,
although the ACA requires this of all people
while the Massachusetts law only requires it of
adults. Both require employers above a certain
size to offer coverage to their employees or
face penalties, although the specifics of the
requirements and penalties vary. Both expand
Medicaid coverage and subsidize coverage for
low-income populations to help make insur-
ance more affordable, although the specifics
here vary as well. Insurance market reforms,
including guaranteed issue and modified com-
munity rating, which had been implemented
previously in Massachusetts in the mid-1990s,
are also critical to the ACA.
While there are broad similarities in the
structure of health reform in Massachusetts
and the ACA, few—if any—states, including
Massachusetts, are implementing the ACA
under political and economic conditions as
favorable as those facing Massachusetts in
2006. First, Massachusetts’ reform effort
built on many years of incremental reform
that laid the foundation for the 2006 push for
near universal coverage (McDonough et al.
2006). Of particular importance, the state had
previously implemented insurance market
reforms and had expanded Medicaid cover-
age under an earlier Section 1115 Medicaid
waiver. That waiver provided $385 million
in federal funds that could be used to support
the 2006 expansion of coverage to the
previously uninsured. Second, support for
health reform was strong in the state, with the
2006 legislation the product of bipartisan
compromise under a Republican governor
(Mitt Romney) and Democratic majority
legislature. Commitment to reform was also
strong in the state across public and private
stakeholders who supported the concept of
‘‘shared responsibility’’ by consumers, gov-
ernment, and business for insurance coverage.
In 2006, 69% of nonelderly adults in Massa-
chusetts supported the state’s reform effort
(Long, Stockley, and Dahlen 2012a), and in
2008, only 33% of employers disagreed with
the statement that health reform had been
‘‘good for Massachusetts’’ (Gabel et al. 2008).
Further, business leaders from across the
state, including the Associated Industries of
Massachusetts, the Greater Boston Chamber
of Commerce, the Massachusetts Business
Roundtable, and the Massachusetts Taxpayer
Foundation, report that health reform has
been good for business in Massachusetts
(Raymond 2012). As a result, Massachusetts
was able to move quickly to implement
reform, expand coverage, and create the
new health insurance exchange over a very
short period of time (Dorn, Hill, and Hogan
2009). Thus, the gains from reform could be
seen quickly in the state, which served to
reinforce stakeholder support.
By contrast, the rhetoric around the ACA
has been intensely partisan, with strong
opposition continuing after passage of the
legislation. The share of the nation’s adults
reporting a favorable opinion of the ACA
has ranged from 34% to 50% since the law’s
passage (Kaiser Family Foundation 2012),
and within months of enactment, numerous
lawsuits were filed challenging the constitu-
tionality of key provisions. Eventually, the
Supreme Court’s June 28, 2012, decision
upheld the key provision of the law—its
individual mandate—but effectively modified
the law’s Medicaid expansion to give states the
option to expand Medicaid coverage (SCO-
TUS 2012). These political issues, combined
with the lengthier timeline for implementation
of many of the ACA’s key elements, mean that
the process of implementing national reform is
moving much more slowly and with more
acrimony than did reform in Massachusetts.
Inquiry/Volume 49, Winter 2012/2013
304
In addition to political differences, there
are also strong economic differences between
Massachusetts in 2006 and the nation today.
Most notably, the country entered a severe
economic recession in 2007 that, combined
with the collapse of the housing market, has
created long-lasting economic challenges. Al-
though the recession officially ended in June
2009, the national unemployment rate stood
at nearly 10% in March 2010 when the ACA
was passed,2 with uninsurance at 16.3% in
that year.3 By contrast, as health reform in
Massachusetts began in 2006, the unemploy-
ment rate in Massachusetts was at 4.8%,4 and
uninsurance was at 10.4%.5 Thus, while we
would expect the experiences under health
reform in Massachusetts to be broadly appli-
cable to the rest of the country, we would also
expect variation across the states, reflecting
their different starting points and their differ-
ent political and economic environments.
Data and Methods
The Massachusetts Health Reform Survey
The MHRS collects information on insurance
coverage, access to and use of health care,
and health care costs and affordability from
working-age adults ages 19 to 64 in Massa-
chusetts.6 The survey was first conducted in
fall 2006, just before the implementation of
many of the key elements of reform in the
state,7 with additional rounds of the survey
conducted each fall from 2007 to 2010. In
survey years 2006 to 2009, the MHRS was
based on stratified random samples of house-
holds with a land-line telephone. In 2010, a
random sample of cell phones was added to
the survey to supplement the land-line tele-
phone sample given the rapid increase in the
share of adults in cell phone-only households
(Blumberg and Luke 2011).
The MHRS obtains information from a new
cross-sectional sample of approximately 3,000
adults each year, with oversamples of unin-
sured adults and lower-income adults. The
overall response rate for the survey in 2010 was
39%, which combines the response rates for
the land-line telephone sample (42%) and the
cell phone sample (31%). While response rates
for cell phone samples are generally lower than
those for land-line samples, adding the cell
phone sample captures a part of the popula-
tion (the more than 25% of adults in cell
phone-only households) that is missed com-
pletely in surveys that focus only on the
population with a land-line telephone. As a
result, the combined land-line and cell phone
samples provide survey data that are more
representative of the population than a land-
line sample alone. The response rate for earlier
years of the survey, which relied on land-line
samples only, ranged from 43% to 49%.8 All
tabulations based on the survey data were
prepared using weights that adjust for the
complex design of the survey and for under-
coverage and survey nonresponse.
Like all survey-based research, the MHRS
relies on self-reported information. The quality
of the data depends on the survey respondent’s
ability to understand the questions and the
response categories, to remember the relevant
information, and to report the information
accurately. We would not expect there to have
been changes in recall and reporting accuracy
over the time period of the survey.
Changes over Time under Health Reform
We compare the outcomes for cross-sectional
samples of adults in periods following the
implementation of health reform to the out-
comes for a similar cross-sectional sample of
adults just prior to the implementation of
health reform (2006) using a pre/post frame-
work. Any differences between the baseline
time period (2006) and the follow-up time
periods will reflect the impacts of Chapter
58 as well as other factors, beyond health
reform, that changed during the time period.
Thus, we cannot attribute trends over time
since 2006 solely to the effects of health
reform. Given this limitation, we draw on the
findings from studies using evaluation meth-
ods that offer the potential for controlling for
such confounding factors as a check on the
findings from the MHRS.
In this analysis, we estimate the following
regression model:
Yi~azb1jXijzb2kREGIONik
zb3 Y2007izb4 Y2008i
zb5 Y2009izb6 Y2010izei,
ð1Þ
Coverage, Access, and Affordability
305
where Yi is the outcome of interest for
individual i (e.g., insurance status, health
care use); Xij is a series of variables to capture
the characteristics of the individual and his or
her family (including age, sex, race/ethnicity,
citizenship, marital status, educational attain-
ment, employment, firm size, self-reported
health status, disability status, whether the indi-
vidual had a chronic condition or was preg-
nant, and family income);9 and REGIONik
is a series of dummy variables to capture the
region of the state in which the individual
lived.10 We also include a series of dummy
variables for each year 2007 to 2010, with
2006, the pre-reform year, omitted from the
model. We test for differences in the out-
comes for each year relative to 2006, reporting
here on any differences in 2008 relative to 2006
(b4) as the measure of the early impacts of
health reform, and any differences in 2010
relative to 2006 (b6) as the more long-term
impacts that also capture the impacts of
the recession and other changes beyond health
reform. For ease of comparison across mod-
els, we estimate linear probability models. All
of the analyses were weighted and control for
the complex design of the sample using the
survey estimation procedures (svy) in Stata 11
(StataCorp 2009).
In presenting the findings, we report out-
comes for adults in the state as of 2010 and
estimates of how those adults would have
fared in Massachusetts in earlier years. To
calculate the latter, we use the parameter
estimates from the regression models to
predict the outcomes that the adults in the
2010 sample would have had if they had been
observed in each of the preceding study years.
Estimates of differences across years for the
2010 sample were obtained using the margins
command in Stata.
We provide estimates for the overall
population of nonelderly adults in the state
and for lower-income adults with family
incomes less than 300% of the federal poverty
level (FPL)—the target population for many
of the reforms under Chapter 58. In Massa-
chusetts, most adults below 150% of FPL
were eligible for MassHealth (the Medicaid
program in Massachusetts) or, if they did
not have access to coverage through an em-
ployer, fully subsidized coverage under the
new Commonwealth Care program. Partial
subsidies under Commonwealth Care contin-
ued for adults with incomes up to 300% of
FPL. This compares to the ACA expansion of
Medicaid to nearly all adults with incomes up
to 138% of FPL and subsidies for private
coverage up to 400% of FPL.11
In summarizing the findings, we report on
a core set of outcome measures; a more
comprehensive set of outcomes is available in
the full evaluation report (Long, Stockley,
and Dahlen 2012b) and in an earlier paper
(Long, Stockley, and Dahlen 2012a).
Summary of Impacts of Health Reform
in Massachusetts
Insurance Coverage
Health insurance coverage expanded signif-
icantly in Massachusetts under health re-
form, increasing from 86.6% of nonelderly
adults in 2006 to 94.2% in 2010 based on the
MHRS (Table 1). The gains in coverage were
particularly strong for lower-income adults,
with the share that was insured increasing
from 75.9% to 90.1% between 2006 and
2010. The increase in insurance coverage in
Massachusetts over this period is in sharp
contrast to the trend in the nation as a
whole, where the share of nonelderly adults
who were insured fell from 80.2% to 78.7%
between 2006 and 2010 (Cohen, Ward, and
Schiller 2011).12
The gains in insurance coverage under
reform in the state reflect growth in both
employer-sponsored insurance (ESI) coverage
and public or other coverage. ESI coverage
in Massachusetts was nearly four percentage
points higher in 2010 than it was prior to
health reform for all nonelderly adults (68.0%
versus 64.4%) and more than six percentage
points higher for lower-income adults (41.9%
versus 35.8%). There is no evidence that
public coverage has ‘‘crowded out’’ ESI
coverage under health reform in the state.
Under reform, employers are more likely
to offer health insurance coverage to their
workers, with the share of employers offering
coverage up from 70% in 2005 to 77% in 2010
(Massachusetts Division of Health Care
Finance and Policy 2011). Nationally, 69%
of employers offered coverage in 2010. Gabel
Inquiry/Volume 49, Winter 2012/2013
306
and colleagues (2008) have speculated that
one factor in increasing employer offer rates
in the state may be the individual mandate,
which increased the demand for insurance
coverage by workers. Under reform, employ-
ers may need to offer insurance coverage to
their workers to remain competitive.
These pre/post findings on insurance cover-
age from the MHRS are supported by other
studies using national survey data and stronger
quasi-experimental designs.13 For example,
using data for 2004 to 2007 from the Current
Population Survey (CPS), Long, Stockley, and
Yemane (2009) estimated difference-in-differ-
ences models, comparing trends in insurance
coverage in Massachusetts to trends in other
similar states. They found that insurance
coverage increased by 6.6 percentage points
among nonelderly adults in the first year
of reform, with ESI coverage increasing by
3.1 percentage points, and public and other
coverage increasing by 3.5 percentage points.
Consistent with the MHRS findings, the
largest gains were for lower-income adults. In
a similar study, Long and Stockley (2011)
estimated difference-in-differences models for
2003 to 2008 from the National Health
Interview Survey (NHIS) and also found an
increase in insurance coverage due to the
reforms, although the estimates from the NHIS
are somewhat smaller–an increase of three
percentage points for adults overall and four to
six percentage points for lower-income adults.
However, unlike the findings from the MHRS
and CPS, the results from the NHIS did not
show any evidence of a change in the levels of
ESI coverage under reform.
Finally, two studies have used the Behavior-
al Risk Factor Surveillance System (BRFSS)
to examine the impacts of health reform in
Massachusetts using difference-in-differences
models for 2006 to 2008 (Zhu et al. 2010) and
interrupted time-series models for 2002 to 2009
(Pande et al. 2011). While the insurance
coverage measure in the BRFSS is more
limited than those in the other surveys, both
studies also found gains in coverage under
reform in Massachusetts.
Access, Use and Affordability of Health Care
Massachusetts’ Chapter 58 was expected to
increase access to and use of health care in the
state by expanding health insurance coverage
and by creating new standards that health
plans needed to meet to count as coverage
under the individual mandate. These ‘‘mini-
mum creditable coverage’’ standards include
requirements that call for a comprehensive set
of benefits and limits on out-of-pocket spend-
ing and on benefit caps, all of which would
tend to lower the out-of-pocket costs of health
care services for individuals.
Consistent with the expanded insurance
coverage and new minimum creditable cov-
erage standards, health care access and use
improved between 2006 and 2010 (Table 2).
For example, in 2010, nonelderly adults in
Massachusetts were more likely to have a
place they usually went to when they were
sick or needed advice about their health (up
Table 1. Changes in health insurance coverage for all adults and
lower-income adults 19 to
64 in Massachusetts, 2006 to 2010
All adults (%) Lower-income adults (%)
2006 2008 2010 2006 2008 2010
Had insurance coverage at the time of the survey 86.6 95.1**
94.2** 75.9 91.9** 90.1**
Employer-sponsored coverage 64.4 69.3** 68.0** 35.8 43.5**
41.9**
Public or other coverage 22.2 25.8** 26.2** 40.1 48.4** 48.2**
Had insurance coverage for all of the past year 80.5 88.4**
87.9** 64.3 81.0** 79.8**
Source: 2006–2010 Massachusetts Health Reform Surveys (all
adults N515,544; lower-income adults N57,769).
Notes: Lower-income is defined as less than 300% of the federal
poverty level (FPL). The table’s regression-adjusted
estimates are derived from models that control for age, gender,
race/ethnicity, citizenship, marital status, parent status,
education, employment, firm size, health status, disability
status, whether the individual has chronic conditions or is
pregnant, family income, and region-level fixed effects.
Regression-adjusted estimates are predicted values calculated
using
the parameter estimates from the regression models to predict
the outcomes that the individuals in the 2010 sample would
have had if they had been observed in each of the preceding
study years.
* (**) Significantly different from the value in 2006 at the .05
(.01) level, two-tailed test.
Coverage, Access, and Affordability
307
from 85.7% to 90.4%), suggesting a stronger
connection to the health care system. They
were also more likely to have had a preventive
care visit (up from 69.9% to 75.8%) and more
likely to have had multiple doctor visits (up
from 64.7% to 69.7%) over the past year. The
patterns of gains in access under reform were
similar for all adults and for lower-income
adults.
Additional evidence of improvements in
access to care in Massachusetts can be seen by
the decline in emergency department (ED)
use between 2006 and 2010. Relative to 2006,
the shares of nonelderly adults reporting any
ED visit and ED visits for non-emergency
conditions14 were lower in 2010, although the
drop was not statistically significant for
lower-income adults. The reduction in ED
visits for non-emergency conditions, in par-
ticular, is consistent with improvements in
access to care and improved care delivery in
the community. This could reflect the effects
of health reform or other changes in the state
targeted at ED use.15
Another element of access to care is the
ability to obtain needed care in a timely
manner. Nonelderly adults in Massachusetts
were much less likely to report that they did
not get needed care in 2010 relative to 2006.
As shown in Table 2, reductions in unmet
need were reported for doctor care; medical
tests, treatment, or follow-up care; and pre-
ventive care screenings. Reductions in unmet
need were reported for all adults and for
lower-income adults.
With the increased insurance coverage and
improved access to health care, we also find
evidence of gains in the affordability of health
care for nonelderly adults in Massachusetts
under health reform (Table 3). These include
a reduction in the burden of out-of-pocket
health care spending and less unmet need for
care because of costs. Unmet need for care
because of costs was also lower in 2010 for
doctor care; medical tests, treatment, or
follow-up care; and preventive care screen-
ings. These patterns held true for adults
overall and for lower-income adults. Lower-
income adults were also more likely to report
a significant drop in problems paying medical
bills under health reform. In 2010, 26.1%
of lower-income nonelderly adults reported
Table 2. Changes in health care access for all adults and lower-
income adults 19 to 64 in
Massachusetts, fall 2006 to fall 2010
All adults (%) Lower-income adults (%)
2006 2008 2010 2006 2008 2010
Has a usual source of care (excluding
the emergency department [ED]) 85.7 91.2** 90.4** 78.5
86.5** 84.2*
Health care use in past year
Any general doctor visit 79.5 84.1** 81.7 74.7 79.2 77.9
Visit for preventive care 69.9 76.2** 75.8** 64.5 71.8** 72.1**
Multiple doctor visits 64.7 68.6* 69.7** 61.0 65.7 68.5**
Any ED visits 34.2 33.2 30.4* 45.3 44.6 42.4
Most recent ED visit was for
non-emergency conditiona 16.0 14.6 12.2** 22.9 20.8 18.8
Did not get needed care in past year
Doctor care 8.1 6.9 5.8* 13.4 12.0 9.3*
Medical tests, treatment, or follow-up care 9.2 7.8 7.0** 14.0
13.0 9.6**
Preventive care screening 6.9 5.6 4.4** 8.3 9.3 5.2**
Source: 2006–2010 Massachusetts Health Reform Surveys (all
adults N515,544; lower-income adults N57,769).
Notes: Lower-income is defined as less than 300% of the federal
poverty level (FPL). The table’s regression-adjusted
estimates are derived from models that control for age, gender,
race/ethnicity, citizenship, marital status, parent status,
education, employment, firm size, health status, disability
status, whether the individual has chronic conditions or is
pregnant, family income, and region-level fixed effects.
Regression-adjusted estimates are predicted values calculated
using
the parameter estimates from the regression models to predict
the outcomes that the individuals in the 2010 sample would
have had if they had been observed in each of the preceding
study years.
* (**) Significantly different from the value in 2006 at the .05
(.01) level, two-tailed test.
a A condition that the respondent thought could have been
treated by a regular doctor if one had been available.
Inquiry/Volume 49, Winter 2012/2013
308
problems paying medical bills, as compared
to 30.7% in 2006.
Other studies of the impacts on health care
access and affordability using national survey
data also support the gains found in the
MHRS, although the work generally has been
constrained by short follow-up periods for
tracking changes in access to care and a
limited set of measures. Long and Stockley’s
(2011) study using the 2003 to 2008 NHIS
found some evidence of reductions in unmet
need for care, delays in obtaining needed care
overall, and delays in obtaining needed care
due to costs by 2008. However, they also
found some evidence of increases in delayed
care because of difficulty getting an appoint-
ment for adults overall, and increases in
delayed care because of difficulty getting to
the provider during office hours for lower-
income adults. Similarly, the study by Zhu
et al. (2010), which used the 2006 to 2008
BRFSS, found a reduction in unmet need for
care due to cost (a decline of two percentage
points by 2008), but no change in the
probability of having a usual source of care.
Using a longer time period in the BRFSS
(2002 to 2009) and a different model specifi-
cation than Zhu and colleagues, Pande et al.
(2011) found evidence of a stronger reduction
in unmet need for care due to cost (down 4.8
percentage points) and an increase in the
share of nonelderly adults with a usual source
of care (up 6.6 percentage points).16
Finally, in work using 2002 to 2008
hospital discharge data for multiple states
and difference-in-differences methods, Miller
(2012) found evidence of a reduction in
aggregate ED use by Massachusetts residents
of between 5% and 8%, mostly due to a
reduction in nonurgent visits. Those patterns
are consistent with the ED reductions for
non-emergency care reported for Massachu-
setts in the MHRS.
Given the important role of public coverage
expansions in the Massachusetts reform, well
designed studies of the impacts of public
coverage expansions in other states can also
inform our understanding of the effects of
reform in Massachusetts. The recent Oregon
Health Insurance Experiment, which expand-
ed Medicaid coverage to randomly selected
applicants in the state, provides the best
available evidence on the impacts of public
coverage expansions to low-income popula-
tions (Finkelstein et al. 2012). Evidence from
the first year of the Oregon study shows
Table 3. Changes in affordability of health care for all adults
and lower-income adults 19 to
64 in Massachusetts, fall 2006 to fall 2010
All adults (%) Lower-income adults (%)
2006 2008 2010 2006 2008 2010
Out-of-pocket health care spending over the past year
was 10% or more of family incomea 9.8 7.9 6.1** 13.3 10.8
7.5**
Had problems paying bills in the past year
Medical bills 19.4 17.2 17.5 30.7 26.1* 26.1*
Other bills 23.4 23.4 25.2 34.1 36.8 38.1
Unmet need for care because of costs in the past year
Doctor care 5.7 2.8** 3.2** 11.1 5.0** 4.7**
Medical tests, treatment, or follow-up care 6.0 3.6** 3.7** 10.8
6.5** 5.1**
Preventive care screening 3.5 2.3* 2.3* 5.8 4.3 3.1**
Prescription drugs 5.3 3.7** 4.4 9.6 5.1** 6.2**
Source: 2006–2010 Massachusetts Health Reform Surveys (all
adults N515,544; lower-income adults N57,769).
Notes: Lower-income is defined as less than 300% of the federal
poverty level (FPL). The table’s regression-adjusted
estimates are derived from models that control for age, gender,
race/ethnicity, citizenship, marital status, parent status,
education, employment, firm size, health status, disability
status, whether the individual has chronic conditions or is
pregnant, family income, and region-level fixed effects.
Regression-adjusted estimates are predicted values calculated
using
the parameter estimates from the regression models to predict
the outcomes that the individuals in the 2010 sample would
have had if they had been observed in each of the preceding
study years.
a Because of the way the income information is collected in the
survey, the measures of spending relative to family income
cannot be constructed for adults with family income above
500% of FPL.
* (**) Significantly different from the value in 2006 at the .05
(.01) level, two-tailed test.
Coverage, Access, and Affordability
309
improvements in access to care and reductions
in medical debt as a result of the expansion in
coverage, findings similar to those in Massa-
chusetts for the lower-income adults targeted
by the expansion of public coverage.
Key Challenges under Health Reform
in Massachusetts
While Massachusetts has experienced signifi-
cant gains in coverage, access to care, and
affordability of care under health reform,
achieving those gains has been challenging.
Chapter 58 introduced a complex set of
changes in the state’s health insurance and
health care sectors, made more complicated by
the changing economic and political landscape.
Continuing Increase in Health Care Costs
Health care costs in Massachusetts are high
and continue to grow, reflecting, in part, the
state’s decision to defer addressing costs in
the 2006 legislation so as not to hold up
the expansion in coverage. Between 2004 and
2009, personal health care spending per capita
in Massachusetts increased by an average of
5.8% per year, to $9,278 in 2009, as compared
to an average increase of 4.7%, to $6,815, for
the nation as a whole (Cuckler et al. 2011).
Consequently, the affordability of health care
and financial problems related to high health
care costs continue to burden many families in
the state (Table 3). In 2010, more than one-
quarter of nonelderly adults in Massachusetts
reported that health care spending had caused
financial problems for their family over the
year, and a quarter reported that they were
‘‘not too confident’’ or ‘‘not confident at all’’
in their ability to afford the health care their
family will need in the coming year (Figure 1).
These findings are even starker for lower-
income adults, where more than one-third
reported that health care spending has caused
financial problems for their family and more
than one-third reported concern about their
family’s ability to afford needed health care in
the coming year.
In the absence of any intervention, the
burden of high health care costs will likely
worsen, as health care spending per capita
in Massachusetts, already the highest in the
country, is projected to nearly double between
2010 and 2020 (Massachusetts Health Care
Quality and Cost Council 2009). Beginning
with the Massachusetts Health Care Quality
and Cost Council that was created as part of
the 2006 legislation, Massachusetts has invest-
ed considerable public and private resources
Figure 1. Massachusetts adults 19 to 64 reporting financial
problems related to health care
spending and with concerns about ability to afford health care
in the future, 2010 (Source:
2010 Massachusetts Health Reform Survey, N53,032) (Lower-
income adults are defined as adults
with family income at or below 300% of the federal poverty
level; higher-income adults are above
that cutoff)
Inquiry/Volume 49, Winter 2012/2013
310
into understanding the drivers of health care
costs in the state. That has included wide-
ranging discussions across stakeholders of
potential strategies to ‘‘bend the curve,’’ as
well as extensive annual public hearings on
health care costs sponsored by the Division
of Health Care Finance and Policy beginning
in 2010, and reports issued by the Office of
the Attorney General analyzing variation in
health care prices (see, for example, Massa-
chusetts Attorney General’s Office 2011).
There is strong consensus in the state on the
need to address rising health care costs as
evidenced by a 2011 opinion poll showing 78%
of respondents believing the high cost of health
care to be either a ‘‘major problem’’ or ‘‘crisis’’
in the state (SteelFisher et al. 2011).
After much debate in the state legislature,
the state enacted a new law to address health
care costs in August 2012: An Act Improving
the Quality of Health Care and Reducing
Costs Through Increased Transparency, Ef-
ficiency and Innovation (Chapter 224 of the
Acts of 2012). This law establishes a statewide
goal of bringing the rate of growth in per-
capita health care spending down to the rate
of growth of the gross state product. That
reduction is to be accomplished by, among
other things, encouraging wide adoption of
alternative payment methodologies by both
public and private payers (including specific
targets for Medicaid); supporting the expan-
sion of electronic health records and health
information technology; placing new scrutiny
on health care market power and price
variation (with the potential of penalties for
health care entities that exceed cost growth
benchmarks); and increasing price transpar-
ency for consumers (Gosline and Rodman
2012). In addition to those changes, for a
number of years now, there have been private
efforts experimenting with alternative pay-
ment methods by providers and insurers in
the state to improve health care quality and
reduce costs (see, for example, Blue Cross
Blue Shield of Massachusetts’ Alternative
Quality Contract in Chernew et al. 2011).
Concerns about Provider Capacity with
Expanded Coverage
With the significant increase in insurance
coverage under health reform in Massachu-
setts, there were concerns about the ability of
the health care system to meet the care needs
of those who gained coverage while maintain-
ing provider access for those who were already
insured. While hard data on provider capacity
in Massachusetts are difficult to come by,
Figure 2. Massachusetts adults 19 to 64 reporting problems
getting care over the past year
due to provider access issues, 2010 (Source: 2010
Massachusetts Health Reform Survey,
N53,032) (Lower-income adults are defined as adults with
family income at or below 300% of the
federal poverty level; higher-income adults are above that
cutoff)
Coverage, Access, and Affordability
311
some residents have reported problems finding
providers. In 2010, for example, 17.9% of
nonelderly adults in the state reported prob-
lems getting care because of difficulties finding
a provider who would see them (Figure 2). As
shown, a quarter (24.5%) of lower-income
adults and 12.8% of higher-income adults
reported problems getting care because they
were told that a provider was not taking new
patients or not taking patients with their type
of insurance. While these questions were not
included in the MHRS prior to health reform,
the NHIS shows some increases in the delays
in obtaining needed care because of difficulty
getting an appointment under health reform in
Massachusetts (Long and Stockley 2011).
The state is taking several approaches to
broaden provider capacity under its new pay-
ment reform law. These initiatives include:
expanding the role of physician assistants to
act as primary care providers; expanding the role
of limited service clinics to act as a point of
access to health care services provided by nurse
practitioners; expanding an existing workforce
loan forgiveness program to include providers of
behavioral, substance use disorder and mental
health services; and, establishing a new primary
care residency program supported by the state.
Churning in Coverage
While Massachusetts has had a significant gain
in insurance coverage under health reform,
including an increase in the share of adults with
full-year coverage, just under one in 10 non-
elderly adults were uninsured at some point over
the prior year and one in five experienced a
change in insurance coverage in 2010 (Figure 3).
Further, almost a quarter (22%) of lower-
income adults and almost one in 10 (9.4%)
higher-income adults reported that they were
‘‘not too confident’’ or ‘‘not confident at all’’ in
their ability to keep their current insurance
coverage in the coming year. Transitions in
coverage raise concerns about continuity of care
because individuals may have to change health
plans and providers as they change coverage or
because they may experience periods with no
insurance coverage at all.
The state has implemented, or is in the
process of implementing, a number of opera-
tional improvements to reduce unnecessary
churn in its Medicaid program, some of which
were directives in the new payment reform law
recently passed by the legislature. These efforts
include: providing families with Medicaid
renewal forms that are already filled in with
information obtained from administrative
Figure 3. Massachusetts adults 19 to 64 reporting lack of
coverage or unstable insurance
coverage over the past year and concerns about keeping
insurance coverage in the future, 2010
(Source: 2010 Massachusetts Health Reform Survey, N53,032)
(Lower-income adults are defined as
adults with family income at or below 300% of the federal
poverty level; higher-income adults are
above that cutoff)
Inquiry/Volume 49, Winter 2012/2013
312
records to facilitate recertification; imple-
menting ‘‘express lane’’ policies for Medicaid
renewal for subgroups of enrollees who are
unlikely to have had changes in eligibility;
increasing administrative data matching with
other state agencies to obtain the informa-
tion needed to determine Medicaid eligibili-
ty; relying on the eligibility redetermination
processes of other programs, such as the
Supplemental Nutrition Assistance Program
(SNAP, formerly food stamps), to satisfy
Medicaid eligibility requirements; and creat-
ing a centralized electronic document man-
agement system to facilitate the sharing of
information across programs and agencies.
Strategies to Reach the Remaining Uninsured
While Massachusetts enjoys the lowest uninsur-
ance rate in the country, there is an ongoing effort
in the state to bring the remaining uninsured into
coverage. Those who remain without coverage in
Massachusetts are often young, male, single, and
without children, with many reporting low family
incomes that would likely make them eligible for
public coverage (Long, Stockley, and Dahlen
2012b). These are often population groups that
are hard to reach and can be difficult to persuade
to obtain coverage.
Massachusetts has invested considerable
resources into reaching hard-to-cover popula-
tions, including a statewide outreach and
enrollment effort, with the Medicaid program
as the lead for coordinating public and private
initiatives (Raymond 2011; Stoll 2012). During
the first four years of reform, the state
provided grants totaling $11.5 million to
support outreach and enrollment assistance
by nonprofit organizations. In addition, since
2006, the Blue Cross Blue Shield of Massa-
chusetts Foundation has awarded $3 million in
community grants for outreach and enroll-
ment. Also, the Commonwealth Health Insur-
ance Connector Authority, Massachusetts’
exchange, implemented an extensive ($7
million) marketing campaign, which included
paid advertising and in-kind contributions
from a range of business and nonprofit par-
tners, and extensive outreach at community
events.
Prognosis for the Nation
Massachusetts has achieved its goal of near
universal health insurance coverage and im-
proved access to care under its 2006 health
reform initiative. The evidence from a range of
studies shows strong gains in insurance cover-
age, improvements in access to and use of health
care, and reductions in the burden of health care
costs for Massachusetts residents. There is also
some evidence that those gains have translated
into improvements in health status among the
state’s residents (Long, Stockley, and Dahlen
2012b; Courtemanche and Zapata 2012), which
is consistent with the evidence of improved self-
reported health status under the Oregon Health
Insurance Experiment (Finkelstein et al. 2012)
and reductions in mortality under earlier Med-
icaid expansions (Sommers, Baicker, and Ep-
stein 2012).
Overall, the findings for Massachusetts
suggest considerable optimism for the poten-
tial impacts of national reform for states that
move forward with the Medicaid expansion
under the ACA. While states have very
different starting points and very different
political and economic environments, the
potential for gains in health care access and
health, along with improvements in financial
protections from expanded insurance cover-
age for states’ residents, is substantial. How-
ever, achieving those gains will involve
difficult trade-offs and challenges for the
states—including many that Massachusetts
has faced, as well as new challenges reflecting
the more contentious atmosphere around
national reform and the more constrained
economic environment facing the country.
Notes
1 For a summary of the ACA, see www.kff.org/
healthreform/8061.cfm. For a crosswalk be-
tween the ACA and the 2006 Massachusetts
legislation, see Seifert and Cohen (2011).
2 Data from the U.S. Department of Labor,
Bureau of Labor Statistics, Current Popula-
tion Survey. Available at: http://data.bls.gov/
timeseries/LNS14000000.
Coverage, Access, and Affordability
313
3 Data from the U.S. Census Bureau, Current
Population Survey, Annual Social and Eco-
nomic Supplements. Table HI06. Health Insur-
ance Coverage Status by State for All People:
2010 Available at: http://www.census.gov/hhes/
www/cpstables/032011/health/toc.htm.
4 Data from U.S. Department of Labor, Bureau
of Labor Statistics, Local Area Unemploy-
ment Statistics. Available at: http://www.bls.
gov/lau/lastrk06.htm.
5 Data from the U.S. Census Bureau, Current
Population Survey, Annual Social and Economic
Supplements. Table HIA-4: Health Insurance
Coverage Status and Type of Coverage by
State—All People: 1999 to 2009. Available at:
http://www.census.gov/hhes/www/hlthins/data/
historical/.
6 Additional information on the survey is available
at: http://www.urban.org/publications/411649.html.
7 The fall 2006 survey was fielded as the
Commonwealth Care program was beginning
for adults with family income under 100% of
the FPL. Enrollment in the program began in
October 2006, with about 18,000 enrolled by
the end of the year (Massachusetts Division of
Health Care Finance and Policy 2011).
8 Response rates for telephone surveys are
declining nationally (Curtin, Presser, and Sing-
er 2005). However, the response rate is just one
element to consider in assessing the reliability of
survey estimates as lower response rates are not
in and of themselves an indicator of survey
quality (Groves 2006). Of relevance to this
study, estimates of the uninsurance rate for
nonelderly adults in 2010 were quite similar for
the MHRS (5.8%) and national surveys with
higher response rates: the American Commu-
nity Survey (6.2%), and the National Health
Interview Survey (5.4%).
9 The analysis sample is limited to observations
with complete data for the regression models.
In general, there was little item nonresponse in
the survey; however, between 4% and 6% of the
sample did not provide any information on
family income and another 3% to 5% would
only provide information on whether income
was above or below 300% of the FPL in each
year. We used hotdeck procedures to impute
values for the missing income data and to
address an error in the income question in 2010
(Long, Stockley, and Dahlen 2012b).
10 We use the Massachusetts Executive Office of
Health and Human Services (EOHSS) regions:
Boston, Metro West, Northeast, Central, West,
and Southeast.
11 The ACA establishes an eligibility standard of
family income up to 133% of FPL for Medicaid
for nonelderly adults, with a 5% income disregard.
12 These estimates are for adults 18 to 64 years
old, whereas the MHRS provides estimates for
adults 19 to 64 years old.
13 By quasi-experimental design, we mean meth-
ods that are designed to approximate a ran-
domized experiment, where outcomes of the
treatment group are compared to a suitable
control group. Common examples of these
designs include difference-in-differences and
instrumental variables models. Because all
MHRS respondents were affected by the
reform, there is no available comparison group
in the MHRS. This lack of a comparison group
limits the analysis using these data to a pre/post
design, which is vulnerable to the influence
of confounding changes over the same time
period. However, as noted earlier, the MHRS
has the advantages of a large sample size for
Massachusetts and a larger set of outcome
measures than is available in national surveys.
14 These are emergency department visits that the
respondent thought could have been treated
by a regular doctor if one had been available.
15 For example, Massachusetts received a $4.5
million grant from the Centers for Medicare
and Medicaid Services to support an emer-
gency department diversion program over this
period (Eccleston 2011). In addition, emergen-
cy department copayment levels for many
private insurance plans increased during this
time period, which may also have impacted
emergency department use.
16 Several other studies have used BRFSS data in
pre/post models of the impacts of health reform
on access to care, including work by Clark et al.
(2011) that found mixed evidence on changes in
preventive care use and reductions in unmet
need due to costs, and Tinsley et al. (2010) that
found gains in the shares of the population with
a personal health care provider and with a
routine checkup in the past year.
References
Blumberg, S. J., and J. V. Luke. 2011. Wireless
Substitution: Early Release of Estimates from
the National Health Interview Survey, July–
December 2010. Hyattsville, Md.: National
Center for Health Statistics. http://www.cdc.
gov/nchs/data/nhis/earlyrelease/wireless201112.
pdf. Accessed September 2, 2012.
Chernew, M. E., R. E. Mechanic, B. E. Landon,
and D. G. Safran. 2011. Private-Payer Inno-
vation in Massachusetts: The ‘‘Alternative
Quality Contract.’’ Health Affairs 30(1):51–61.
Clark, C. R., J. Soukup, U. Govindarajulu, H. E.
Rinden, D. A. Tovar, and P. A. Johnson. 2011.
Lack of Access Due to Costs Remains a
Inquiry/Volume 49, Winter 2012/2013
314
Problem for Some in Massachusetts Despite
the State’s Health Reform. Health Affairs
30(2):247–255.
Cohen, R. A., B. W. Ward, and J. S. Schiller.
2011. Health Insurance Coverage: Early Re-
lease of Estimates from the National Health
Interview Survey, 2010. Hyattsville, Md.:
National Center for Health Statistics. http://
www.cdc.gov/nchs/data/nhis/earlyrelease/insur
201106.pdf. Accessed September 2, 2012.
Courtemanche, C., and D. Zapata. 2012. Does
Universal Coverage Improve Health? The
Massachusetts Experience. National Bureau
of Economic Research (NBER) working paper
17893. http://www.nber.org/papers/w17893. Ac-
cessed September 2, 2012.
Cuckler, G., A. Martin, L. Whittle, S. Heffler, A. Sisko,
D. Lassman, and J. Benson. 2011. Health Spending
by State of Residence, 1991–2009. Medicare &
Medicaid Research Review 1(4):E1–E30.
Curtin, R., S. Presser, and E. Singer. 2005.
Changes in Telephone Survey Nonresponse
over the Past Quarter Century. Public Opinion
Quarterly 69(1):87–98.
Dorn, S., I. Hill, and S. Hogan. 2009. The Secrets of
Massachusetts’ Success: Why 97 Percent of State
Residents Have Health Coverage. Washington,
D.C.: The Urban Institute. www.urban.org/
publications/411987.html. Accessed September 2, 2012.
Eccleston, S. 2011. Challenges in Coordination of
Health Care Services. Boston: Massachusetts
Division of Health Care Finance and Policy.
http://www.mass.gov/eohhs/docs/dhcfp/cost-trend-
docs/cost-trends-docs-2011/eccleston-stacey-june-
30.pdf. Accessed September 2, 2012.
Finkelstein, A., S. Taubman, B. Wright, M. Bern-
stein, J. Gruber, J. Newhouse, H. Allen, K.
Baiker, and the Oregon Health Study Group.
2012. The Oregon Health Insurance Experiment:
Evidence from the First Year. Quarterly Journal
of Economics 127(3):1057–1106.
Gabel, J. R., H. Whitmore, J. Pickreign, W. Sellheim,
K. C. Shova, and V. Bassett. 2008. After the
Mandates: Massachusetts Employers Continue to
Support Health Reform as More Firms Offer
Coverage. Health Affairs 27(6):w566–w575.
Gosline, A., and E. Rodman. 2012. Summary of
Chapter 224 of the Acts of 2012. Boston: Blue
Cross Blue Shield of Massachusetts Founda-
tion. http://bluecrossmafoundation.org/Policy-
and-Research/Reports-By-Topic/Health-Care-
Costs-and-Affordability/,/media/Files/Publications/
Policy%20Publications/Chapter%20224%20summary.
pdf. Accessed October 4, 2012.
Groves, R. M. 2006. Nonresponse Rates and
Nonresponse Bias in Household Surveys.
Public Opinion Quarterly 70(4):646–675.
Kaiser Family Foundation (KFF). 2010. Summary
of New Health Reform Law. Publication
#8061. Menlo Park, Calif.: Kaiser Family
Foundation. http://www.kff.org/healthreform/
8061.cfm. Accessed September 2, 2012.
———. 2012. Public Still Divided on ACA:
Favorable Views Tick Up This Month. Menlo
Park, Calif.: Kaiser Family Foundation. http://
facts.kff.org/chart.aspx?ch51456. Accessed
October 4, 2012.
Long, S. K. 2009. The Massachusetts Health
Reform Survey. Washington, D.C.: The Urban
Institute. http://www.urban.org/publications/
411649.html. Accessed September 4, 2012.
Long, S. K., and K. Stockley. 2011. The Impacts
of State Health Reform Initiatives on Adults in
New York and Massachusetts. Health Services
Research 46(1):365–387.
Long, S. K., K. Stockley, and H. Dahlen. 2012a.
Massachusetts Health Reforms: Uninsurance
Remains Low, Self-Reported Health Status
Improves as State Prepares to Tackle Costs.
Health Affairs 31(2):444–451.
———. 2012b. Massachusetts Health Reform
Report January 2012. Boston: Blue Cross Blue
Shield of Massachusetts Foundation. http://
bluecrossmafoundation.org/Policy-and-Research/
Reports-By-Topic/Massachusetts-Health-Reform/
,/media/Files/Publications/Policy%20Publications/
MHRS%20Report%20Jan2012.pdf. Accessed
September 2, 2012.
Long, S. K., K. Stockley, and A. Yemane. 2009.
Another Look at the Impacts of Health
Reform in Massachusetts: Evidence Using
New Data and a Stronger Model. American
Economic Review 99(2):508–511.
Massachusetts Attorney General’s Office. 2011.
Report for Annual Public Hearing: Examination
of Health Care Cost Trends and Cost Drivers
Pursuant to G.L. c. 118G, 1 6K(b). Boston:
Office of Attorney General Martha Coakley.
http://www.mass.gov/ago/docs/healthcare/2011-hcctd-
full.pdf. Accessed September 2, 2012.
Massachusetts General Court. 2012. Chapter 224:
An Act Improving the Quality of Health Care
and Reducing Costs Through Increased Trans-
parency, Efficiency and Innovation. Boston:
The 187th General Court of The Commonwealth
of Massachusetts. http://www.malegislature.gov/
Laws/SessionLaws/Acts/2012/Chapter224. Accessed
September 4, 2012.
Massachusetts Division of Health Care Finance
and Policy. 2012. Health Care Cost Trends.
http://www.mass.gov/eohhs/researcher/physical-
health/health-care-delivery/health-care-cost-trends.
Accessed September 4, 2012.
———. 2011. Health Care in Massachusetts: Key
Indicators, February 2011 Edition. Boston:
Massachusetts Division of Health Care Fi-
nance and Policy. http://www.mass.gov/eohhs/
docs/dhcfp/r/pubs/11/2011-key-indicators-february.
pdf. Accessed September 2, 2012.
Massachusetts Health Care Quality and Cost
Council. 2009. Roadmap to Cost Containment:
Massachusetts Health Care Quality and Cost
Council Final Report. Boston: Massachusetts
Coverage, Access, and Affordability
315
Health Care Quality and Cost Council. http://
www.mass.gov/hqcc/docs/roadmap-to-cost-containment-
nov-2009.pdf. Accessed September 2, 2012.
McDonough, J. E., B. Rosman, F. Phelps, and M.
Shannon. 2006. The Third Wave of Massa-
chusetts Health Care Access Reform. Health
Affairs 25(6):w420–w431.
Miller, S. 2012. The Effect of Insurance on
Emergency Room Visits: An Analysis of the
2006 Massachusetts Health Reform. Journal of
Public Economics 96(11–12):893–908.
Pande, A., D. Ross-Degnan, A. Zaslavsky, and J.
Salomon. 2011. Effects of Healthcare Reforms on
Coverage, Access, and Disparities: Quasi-Experi-
mental Analysis of Evidence from Massachusetts.
American Journal of Preventive Medicine 41(1):1–8.
Raymond, A. G. 2011. Massachusetts Health
Reform: A Five-Year Progress Report. Bos-
ton: Blue Cross Blue Shield of Massachusetts
Foundation. https://www.mahealthconnector.
org/portal/binary/com.epicentric.contentmanagement.
servlet.ContentDeliveryServlet/Health%2520Care
%2520Reform/Overview/BlueCrossFoundation
5YearRpt.pdf. Accessed September 2, 2012.
———. 2012. Business Community Participation in
Health Reform: The Massachusetts Experience.
Boston: Community Catalyst. http://www.
communitycatalyst.org/doc_store/publications/
biz-community-health-reform_ma-experience.pdf.
Accessed October 4, 2012.
Seifert, R. W., and A. P. Cohen. 2011. Re-forming
Reform: What the Patient Protection and
Affordable Care Act Means for Massachusetts.
Boston: Blue Cross Blue Shield of Massachu-
setts Foundation. masshealthpolicyforum.brandeis.
edu/forums/Documents/IssueBrief_ReportFINAL.
pdf. Accessed September 2, 2012.
Sommers, B. D., K. Baicker, and A. M. Epstein.
2012. Mortality and Access to Care among
Adults after State Medicaid Expansions. New
England Journal of Medicine Special Article
July 25, 2012. 10.1056/NEJMsa1202099. http://
www.nejm.org/doi/full/10.1056/nejmsa1202099.
Accessed Sept. 4, 2012.
StataCorp. 2009. Stata Statistical Software: Re-
lease 11. College Station, Texas: StataCorp LP.
SteelFisher, G., R. Blendon, J. Mailhot, and S. E.
Abiola. 2011. Public Perceptions of Health
Care Costs in Massachusetts. Boston: Blue
Cross Blue Shield of Massachusetts Foundation.
http://bluecrossmafoundation.org/Policy-and-Research/
Reports-By-Topic/Health-Care-Costs-and-Affordability/
,/media/Files/Health%20Reform/Health%20
Reform%2020%20Cost%20and%20Quality%
20Blendon%20Health%20Care%20Cost%20
Poll%20FINAL.pdf. Accessed September 2,
2012.
Stoll, B. 2012. Effective Education, Outreach, and
Enrollment Approaches for Populations New-
ly Eligible for Health Coverage. Boston: Blue
Cross Blue Shield of Massachusetts Founda-
tion. Health Reform Toolkit Series. http://
www.rwjf.org/files/research/74070mass.pdf. Ac-
cessed September 2, 2012.
Supreme Court of the United States (SCOTUS).
2012. National Federation of Independent
Business et al. v. Sebelius, Secretary of Health
and Human Services, et al. 567 U.S., 2012 WL
2427810. Washington, D.C.: Supreme Court of
the United States. www.supremecourt.gov/
opinions/11pdf/11-393c3a2.pdf. Accessed Sep-
tember 2, 2012.
Tinsley, L., B. Andrews, H. Hawk, and B. Cohen.
2010. Short-Term Effects of Health-Care
Coverage Legislation—Massachusetts, 2008.
Morbidity and Mortality Weekly Report
58(09):262–267.
U.S. Bureau of Labor Statistics. 2012. Labor
Force Statistics from the Current Population
Survey. Washington, D.C.: U.S. Bureau of
Labor Statistics. http://data.bls.gov/timeseries/
LNS14000000. Accessed September 4, 2012.
———. 2007. Unemployment Rates for States
Annual Average Rankings Year: 2006. Wash-
ington, D.C.: U.S. Bureau of Labor Statistics.
http://www.bls.gov/lau/lastrk06.htm. Accessed
September 4, 2012.
U.S. Census Bureau. 2011. Table HI06: Health
Insurance Coverage Status by State for All
People: 2010. Current Population Survey, 2011
Annual Social and Economic Supplement.
Washington, D.C.: U.S. Census Bureau. http://
www.census.gov/hhes/www/cpstables/032011/
health/toc.htm. Accessed September 4, 2012.
———. 2010. Table HIA-4: Health Insurance
Coverage Status and Type of Coverage by State—
All People: 1999 to 2009. Current Population
Survey, 2011 Annual Social and Economic Supple-
ment. Washington, D.C.: U.S. Census Bureau.
http://www.census.gov/hhes/www/hlthins/data/
historical. Accessed September 4, 2012.
Zhu, J., P. Brawarsky, S. Lipsitz, H. Huskamp,
and J. S. Haas. 2010. Massachusetts Health
Reform and Disparities in Coverage, Access
and Health Status. Journal of General Internal
Medicine 25(12):1356–1362.
Inquiry/Volume 49, Winter 2012/2013
316
Copyright of Inquiry (00469580) is the property of Excellus
Health Plan, Inc. and its content may not be copied
or emailed to multiple sites or posted to a listserv without the
copyright holder's express written permission.
However, users may print, download, or email articles for
individual use.
T h e n e w e ngl a nd j o u r na l o f m e dic i n e
n engl j med 368;18 nejm.org may 2, 2013 1713
special article
The Oregon Experiment — Effects
of Medicaid on Clinical Outcomes
Katherine Baicker, Ph.D., Sarah L. Taubman, Sc.D., Heidi L.
Allen, Ph.D.,
Mira Bernstein, Ph.D., Jonathan H. Gruber, Ph.D., Joseph P.
Newhouse, Ph.D.,
Eric C. Schneider, M.D., Bill J. Wright, Ph.D., Alan M.
Zaslavsky, Ph.D.,
and Amy N. Finkelstein, Ph.D., for the Oregon Health Study
Group*
From the Department of Health Policy
and Management, Harvard School of
Public Health (K.B., J.P.N., E.C.S.), the
Department of Health Care Policy, Harvard
Medical School ( J.P.N., E.C.S., A.M.Z.),
and RAND Corporation (E.C.S.) — all in
Boston; the National Bureau of Econom-
ic Research (K.B., S.L.T., M.B., J.H.G.,
J.P.N., A.N.F.), the Harvard Kennedy
School ( J.P.N.), and the Department of
Economics, Massachusetts Institute of
Technology (J.H.G., A.N.F.) — all in
Cambridge, MA; Columbia University
School of Social Work, New York (H.L.A.);
and the Center for Outcomes Research
and Education, Providence Portland
Medical Center, Portland, OR (B.J.W.).
Address reprint requests to Dr. Baicker at
the Department of Health Policy and
Management, Harvard School of Public
Health, 677 Huntington Ave., Boston, MA
02115, or at [email protected]
* Members of the Oregon Health Study
Group are listed in the Supplementary
Appendix, available at NEJM.org.
N Engl J Med 2013;368:1713-22.
DOI: 10.1056/NEJMsa1212321
Copyright © 2013 Massachusetts Medical Society.
A bs tr ac t
Background
Despite the imminent expansion of Medicaid coverage for low-
income adults, the
effects of expanding coverage are unclear. The 2008 Medicaid
expansion in Oregon
based on lottery drawings from a waiting list provided an
opportunity to evaluate
these effects.
Methods
Approximately 2 years after the lottery, we obtained data from
6387 adults who
were randomly selected to be able to apply for Medicaid
coverage and 5842 adults who
were not selected. Measures included blood-pressure,
cholesterol, and glycated hemo-
globin levels; screening for depression; medication inventories;
and self-reported
diagnoses, health status, health care utilization, and out-of-
pocket spending for
such services. We used the random assignment in the lottery to
calculate the effect
of Medicaid coverage.
Results
We found no significant effect of Medicaid coverage on the
prevalence or diagnosis
of hypertension or high cholesterol levels or on the use of
medication for these
conditions. Medicaid coverage significantly increased the
probability of a diagnosis
of diabetes and the use of diabetes medication, but we observed
no significant ef-
fect on average glycated hemoglobin levels or on the percentage
of participants with
levels of 6.5% or higher. Medicaid coverage decreased the
probability of a positive
screening for depression (−9.15 percentage points; 95%
confidence interval, −16.70
to −1.60; P = 0.02), increased the use of many preventive
services, and nearly elimi-
nated catastrophic out-of-pocket medical expenditures.
Conclusions
This randomized, controlled study showed that Medicaid
coverage generated no sig-
nificant improvements in measured physical health outcomes in
the first 2 years,
but it did increase use of health care services, raise rates of
diabetes detection and
management, lower rates of depression, and reduce financial
strain.
T h e n e w e ngl a nd j o u r na l o f m e dic i n e
n engl j med 368;18 nejm.org may 2, 20131714
In 2008, Oregon initiated a limited ex-pansion of its Medicaid
program for low- income adults through a lottery drawing of
approximately 30,000 names from a waiting list
of almost 90,000 persons. Selected adults won
the opportunity to apply for Medicaid and to en-
roll if they met eligibility requirements. This lot-
tery presented an opportunity to study the effects
of Medicaid with the use of random assignment.
Earlier, nonrandomized studies sought to inves-
tigate the effect of Medicaid on health outcomes
in adults with the use of quasi-experimental ap-
proaches.1-3 Although these approaches can be an
improvement over observational designs and often
involve larger samples than are feasible with a
randomized design, they cannot eliminate con-
founding factors as effectively as random assign-
ment. We used the random assignment embedded
in the Oregon Medicaid lottery to examine the
effects of insurance coverage on health care use
and health outcomes after approximately 2 years.
Me thods
Randomization and Intervention
Oregon Health Plan Standard is a Medicaid pro-
gram for low-income, uninsured, able-bodied
adults who are not eligible for other public insur-
ance in Oregon (e.g., Medicare for persons 65 years
of age or older and for disabled persons; the Chil-
dren’s Health Insurance Program for poor chil-
dren; or Medicaid for poor children, pregnant
women, or other specific, categorically eligible pop-
ulations). Oregon Health Plan Standard closed to
new enrollment in 2004, but the state opened a new
waiting list in early 2008 and then conducted
eight random lottery drawings from the list be-
tween March and September of that year to allo-
cate a limited number of spots.
Persons who were selected won the opportu-
nity — for themselves and any household mem-
ber — to apply for Oregon Health Plan Standard.
To be eligible, persons had to be 19 to 64 years
of age and Oregon residents who were U.S. citi-
zens or legal immigrants; they had to be ineli-
gible for other public insurance and uninsured for
the previous 6 months, with an income that was
below 100% of the federal poverty level and assets
of less than $2,000. Persons who were randomly
selected in the lottery were sent an application.
Those who completed it and met the eligibility
criteria were enrolled in the plan. Oregon Health
Plan Standard provides comprehensive medical
benefits, including prescription drugs, with no
patient cost-sharing and low monthly premiums
($0 to $20, based on income), mostly through
managed-care organizations. The lottery process
and Oregon Health Plan Standard are described
in more detail elsewhere.4
Data Collection
We used an in-person data-collection protocol to
assess a wide variety of outcomes. We limited
data collection to the Portland, Oregon, metro-
politan area because of logistical constraints. Our
study population included 20,745 people: 10,405
selected in the lottery (the lottery winners) and
10,340 not selected (the control group). We con-
ducted interviews between September 2009 and
December 2010. The interviews took place an av-
erage of 25 months after the lottery began.
Our data-collection protocol included detailed
questionnaires on health care, health status, and
insurance coverage; an inventory of medications;
and performance of anthropometric and blood-
pressure measurements. Dried blood spots were
also obtained.5 Depression was assessed with the
use of the eight-question version of the Patient
Health Questionnaire (PHQ-8),6 and self-reported
health-related quality of life was assessed with
the use of the Medical Outcomes Study 8-Item
Short-Form Survey.7 More information on recruit-
ment and field-collection protocols are included
in the study protocol (available with the full text
of this article at NEJM.org); more information
on specific outcome measures is provided in the
Supplementary Appendix (available at NEJM.org).
Multiple institutional review boards approved the
study, and written informed consent was obtained
from all participants.
Statistical Analysis
Virtually all the analyses reported here were pre-
specified and publicly archived (see the proto-
col).8 Prespecification was designed to minimize
issues of data and specification mining and to
provide a record of the full set of planned analy-
ses. The results of a few additional post hoc anal-
yses are also presented and are noted as such in
Tables 1 through 5. Analyses were performed with
the use of Stata software, version 12.9
Adults randomly selected in the lottery were
given the option to apply for Medicaid, but not
all persons selected by the lottery enrolled in
Effects of Medicaid on Clinical Outcomes
n engl j med 368;18 nejm.org may 2, 2013 1715
Medicaid (either because they did not apply or
because they were deemed ineligible). Lottery se-
lection increased the probability of Medicaid cover-
age during our study period by 24.1 percentage
points (95% confidence interval [CI], 22.3 to 25.9;
P<0.001). The subgroup of lottery winners who
ultimately enrolled in Medicaid was not compa-
rable to the overall group of persons who did not
win the lottery. We therefore used a standard
instrumental-variable approach (in which lottery
selection was the instrument for Medicaid cover-
age) to estimate the causal effect of enrollment in
Medicaid. Intuitively, since the lottery increased
the chance of being enrolled in Medicaid by about
25 percentage points, and we assumed that the
lottery affected outcomes only by changing Med-
icaid enrollment, the effect of being enrolled in
Medicaid was simply about 4 times (i.e., 1 divided
by 0.25) as high as the effect of being able to
apply for Medicaid. This yielded a causal estimate
of the effect of insurance coverage.10 (See the
Supplementary Appendix for additional details.)
All analyses were adjusted for the number of
household members on the lottery list because
selection was random, conditional on household
size. Standard errors were clustered according to
household to account for intrahousehold correla-
tion. We fitted linear probability models for bi-
nary outcomes. As sensitivity checks, we showed
that our results were robust when the average mar-
ginal effects from logistic regressions for binary
outcomes were estimated and when demographic
characteristics were included as covariates (see
the Supplementary Appendix). All analyses were
weighted for the sampling and field-collection
design; construction of the weights is detailed in
the Supplementary Appendix.
R esult s
Study Population
Characteristics of the respondents are shown in
Table 1. A total of 12,229 persons in the study
sample responded to the survey, for an effective
response rate of 73%. There were no significant
differences between those selected in the lottery
and those not selected with respect to the response
rates to either the full survey (0.28 percentage
points higher in the group selected in the lottery,
P = 0.86) or specific survey measures, each of which
had a response rate of at least 97% among people
who completed any part of the survey. Just over
half the participants were women, about a quar-
ter were 50 to 64 years of age (the oldest eligible
age group), and about 70% were non-Hispanic
white. There were no significant differences be-
tween those selected in the lottery and those not
selected with respect to these characteristics (F
statistic, 0.20; P = 0.99) or to the wide variety of
prerandomization and interview characteristics
examined (see the Supplementary Appendix).
Clinical Measures and Health Outcomes
Table 2 shows estimated effects of Medicaid cov-
erage on blood-pressure, total and high-density
lipoprotein (HDL) cholesterol, and glycated he-
moglobin levels and depression. In the control
group, 30% of the survey respondents had positive
screening results for depression, and we detected
elevated blood pressure in 16%, a high total cho-
lesterol level in 14%, and a glycated hemoglobin
level of 6.5% or more (a diagnostic criterion for
Table 1. Characteristics of the 12,229 Survey Respondents.*
Characteristic
Controls
(N = 5842)
Lottery
Winners
(N = 6387)† P Value
percent
Female sex 56.9 56.4 0.60
Age group‡
19–34 yr 36.0 35.1 0.38
35–49 yr 36.4 36.6 0.87
50–64 yr 27.6 28.3 0.43
Race or ethnic group§
Non-Hispanic
White 68.8 69.2 0.68
Black 10.5 10.6 0.82
Other 14.8 14.8 0.97
Hispanic 17.2 17.0 0.82
Interview conducted in English 88.2 88.5 0.74
* Values for the control group (persons not selected in the
lottery) are weighted
means, and values for the lottery-winner group are regression-
adjusted
weighted means. P values are for two-tailed t-tests of the
equality of the two
means.
† Lottery winners were adults who were randomly selected in
the lottery to be
able to apply for Medicaid coverage.
‡ The data on age are for the age of the respondent at the time
of the in-person
interview. The study sample was restricted to persons who were
between 19 and
64 years of age during the study period.
§ Race and ethnic group were self-reported. The categories of
non-Hispanic race
(white, black, and other) were not mutually exclusive;
respondents could report
as many races or ethnic groups as they wished.
T h e n e w e ngl a nd j o u r na l o f m e dic i n e
n engl j med 368;18 nejm.org may 2, 20131716
diabetes) in 5%. Medicaid coverage did not have
a significant effect on measures of blood pres-
sure, cholesterol, or glycated hemoglobin. Fur-
ther analyses involving two prespecified sub-
groups — persons 50 to 64 years of age and
those who reported receiving a diagnosis of dia-
betes, hypertension, a high cholesterol level, a
heart attack, or congestive heart failure before
the lottery (all of which were balanced across the
two study groups) — showed similar results (see
the Supplementary Appendix).
The predicted 10-year risk of cardiovascular
events was measured with the use of the Fram-
ingham risk score, which estimates risk among
persons older than 30 years of age according to
sex, age, levels of total cholesterol and HDL cho-
lesterol, blood pressure and use or nonuse of
blood-pressure medication, status with respect
to diabetes, and smoking status, with the pre-
dicted risk of a cardiovascular event within 10
years ranging from less than 1% to 30%.11 The
10-year predicted risk did not change significantly
with Medicaid coverage (−0.21 percentage points;
95% CI, −1.56 to 1.15; P = 0.76).
We investigated whether Medicaid coverage af-
fected the diagnosis of and use of medication for
hypertension, hypercholesterolemia, or diabetes.
Table 2 shows diagnoses after the lottery and
current medication use. We found no effect of
Medicaid coverage on diagnoses after the lottery
or on the use of medication for blood-pressure and
high cholesterol levels. We did, however, find a
greater probability of receiving a diagnosis of
diabetes (3.83 percentage points; 95% CI, 1.93 to
5.73; P<0.001) and using medications for diabe-
tes (5.43 percentage points; 95% CI, 1.39 to 9.48;
P = 0.008). These are substantial increases from the
mean rates of diagnosis and medication use in the
control group (1.1% and 6.4%, respectively).
A positive result on screening for depression
was defined as a score of 10 or more on the
PHQ-8 (which ranges from 0 to 24, with higher
Table 2. Mean Values and Absolute Change in Clinical
Measures and Health Outcomes with Medicaid Coverage.*
Variable
Mean Value in
Control Group
Change with Medicaid
Coverage (95% CI)† P Value
Blood pressure
Systolic (mm Hg) 119.3±16.9 −0.52 (−2.97 to 1.93) 0.68
Diastolic (mm Hg) 76.0±12.1 −0.81 (−2.65 to 1.04) 0.39
Elevated (%)‡ 16.3 −1.33 (−7.16 to 4.49) 0.65
Hypertension
Diagnosis after lottery (%)§¶ 5.6 1.76 (−1.89 to 5.40) 0.34
Current use of medication for hypertension (%)§‖ 13.9 0.66
(−4.48 to 5.80) 0.80
Cholesterol**
Total level (mg/dl) 204.1±34.0 2.20 (−3.44 to 7.84) 0.45
High total level (%) 14.1 −2.43 (−7.75 to 2.89) 0.37
HDL level (mg/dl) 47.6±13.1 0.83 (−1.31 to 2.98) 0.45
Low HDL level (%) 28.0 −2.82 (−10.28 to 4.64) 0.46
Hypercholesterolemia
Diagnosis after lottery (%)§¶ 6.1 2.39 (−1.52 to 6.29) 0.23
Current use of medication for high cholesterol level (%)§‖ 8.5
3.80 (−0.75 to 8.35) 0.10
Glycated hemoglobin
Level (%) 5.3±0.6 0.01 (−0.09 to 0.11) 0.82
Level ≥6.5% (%)†† 5.1 −0.93 (−4.44 to 2.59) 0.61
Diabetes
Diagnosis after lottery (%)§¶ 1.1 3.83 (1.93 to 5.73) <0.001
Current use of medication for diabetes (%)§‖ 6.4 5.43 (1.39 to
9.48) 0.008
Effects of Medicaid on Clinical Outcomes
n engl j med 368;18 nejm.org may 2, 2013 1717
scores indicating more symptoms of depression).
Medicaid coverage resulted in an absolute de-
crease in the rate of depression of 9.15 percentage
points (95% CI, −16.7 to −1.60; P = 0.02), repre-
senting a relative reduction of 30%. Although
there was no significant increase in the use of
medication for depression, Medicaid coverage
led to an absolute increase in the probability of
receiving a diagnosis of depression after the lot-
tery of 3.81 percentage points (95% CI, 0.15 to
7.46; P = 0.04), representing a relative increase of
about 80%.
Health-Related Quality of Life and Happiness
Table 3 shows the effects of Medicaid coverage
on health-related quality of life and level of hap-
piness. Medicaid coverage led to an increase in
the proportion of people who reported that their
health was the same or better as compared with
their health 1 year previously (7.84 percentage
points; 95% CI, 1.45 to 14.23; P = 0.02). The phys-
ical-component and mental-component scores of
the health-related quality of life measure are
based on different weighted combinations of the
eight-question battery; each ranges from 0 to 100,
Table 2. (Continued.)
Variable
Mean Value in
Control Group
Change with Medicaid
Coverage (95% CI)† P Value
Depression
Positive screening result (%)‡‡ 30.0 −9.15 (−16.70 to −1.60)
0.02
Diagnosis after lottery (%)§¶ 4.8 3.81 (0.15 to 7.46) 0.04
Current use of medication for depression (%)§‖ 16.8 5.49 (−0.46
to 11.45) 0.07
Framingham risk score (%)§§
Overall 8.2±7.5 −0.21 (−1.56 to 1.15) 0.76
High-risk diagnosis 11.6±8.3 1.63 (−1.11 to 4.37) 0.24
Age of 50–64 yr 13.9±8.2 −0.37 (−2.64 to 1.90) 0.75
* Plus–minus values are weighted means ±SD. Where means are
shown without standard deviations, they are weighted
means. The effect of Medicaid coverage was estimated with the
use of two-stage least-squares instrumental-variable
regression. All regressions include indicators for the number of
household members on the lottery list, and all standard
errors were “clustered,” or adjusted to allow for arbitrary
correction of error terms within households. For the blood-
pressure measures, all regressions also included controls for age
(with dummies for age decile) and sex. All analyses
were weighted with the use of survey weights. The sample size
was all 12,229 survey respondents for all measures ex-
cept for the Framingham risk score. HDL denotes high-density
lipoprotein.
† For variables measured as percentages, the change is
expressed as percentage points.
‡ Elevated blood pressure was defined as a systolic pressure of
140 mm Hg or more and a diastolic pressure of 90 mm Hg
or more.
§ This analysis was not prespecified.
¶ A participant was considered to have received a diagnosis of a
certain condition after the lottery if he or she reported
a first diagnosis after March 2008 (the start of the lottery). A
participant who received a diagnosis before March 2008
was not considered to have a diagnosis after the lottery.
‖ A participant was considered to have received medication for
the condition if one or more of the medications recorded
during the interview was classified as relevant for that
condition.
** A high total cholesterol level was defined as 240 mg per
deciliter (6.2 mmol per liter) or higher. A low HDL cholester-
ol level was defined as less than 40 mg per deciliter (1.03 mmol
per liter). There was no separate measurement of low-
density lipoprotein cholesterol.
†† A glycated hemoglobin level of 6.5% or higher is a
diagnostic criterion for diabetes.
‡‡ A positive result on screening for depression was defined as
a score of 10 or higher on the Patient Health Questionnaire 8
(PHQ-8). Scores on the PHQ-8 range from 0 to 24, with higher
scores indicating more symptoms of depression.
§§ The Framingham risk score was used to predict the 10-year
cardiovascular risk. Risk scores were calculated separately
for men and women on the basis of the following variables: age,
total cholesterol and HDL cholesterol levels, mea-
sured blood pressure and use or nonuse of medication for high
blood pressure, current smoking status, and status
with respect to a glycated hemoglobin level ≥6.5%. Framingham
risk scores, which are calculated for persons 30
years of age or older, range from 0.99 to 30%. Samples sizes for
risk scores were 9525 participants overall, 3099 par-
ticipants with high-risk diagnoses, and 3372 participants with
an age of 50 to 64 years. A high-risk diagnosis was de-
fined as a diagnosis of diabetes, hypertension,
hypercholesterolemia, myocardial infarction, or congestive
heart failure
before the lottery (i.e., before March 2008).
T h e n e w e ngl a nd j o u r na l o f m e dic i n e
n engl j med 368;18 nejm.org may 2, 20131718
with higher scores corresponding to better health-
related quality of life. Medicaid coverage led to
an increase of 1.95 points (95% CI, 0.03 to 3.88;
P = 0.05) in the average score on the mental com-
ponent; the magnitude of improvement was ap-
proximately one fifth of the standard deviation
of the mental-component score. We did not de-
tect a significant difference in the quality of life
related to physical health or in self-reported lev-
els of pain or happiness.
Financial Hardship
Table 4 shows that Medicaid coverage led to a
reduction in financial strain from medical costs,
according to a number of self-reported measures.
In particular, catastrophic expenditures, defined
as out-of-pocket medical expenses exceeding 30%
of income, were nearly eliminated. These ex-
penditures decreased by 4.48 percentage points
(95% CI, −8.26 to −0.69; P = 0.02), a relative re-
duction of more than 80%.
Additional Outcomes
Table 5 shows the effects of Medicaid coverage
on health care utilization, spending on health
care, preventive care, access to and quality of care,
smoking status, and obesity. Medicaid coverage
resulted in an increase in the number of prescrip-
tion drugs received and office visits made in the
previous year; we did not find significant chang-
es in visits to the emergency department or hos-
pital admissions. We estimated that Medicaid cov-
erage increased annual medical spending (based
on measured use of prescription drugs, office
visits, visits to the emergency department, and
hospital admissions) by $1,172, or about 35% rela-
tive to the spending in the control group. Medic-
aid coverage also led to increases in some pre-
ventive care and screening services, including
cholesterol screening (an increase of 14.57 per-
centage points; 95% CI, 7.09 to 22.04; P<0.001)
and improved perceived access to care, including
a usual place of care (an increase of 23.75 per-
centage points; 95% CI, 15.44 to 32.06; P<0.001).
We found no significant effect of Medicaid cover-
age on the probability that a person was a smok-
er or obese.
Discussion
This study was based on more than 12,000 in-
person interviews conducted approximately 2 years
after a lottery that randomly assigned access to
Medicaid for low-income, able-bodied, uninsured
adults — a group that comprises the majority of
persons who are newly eligible for Medicaid un-
der the 2014 expansion.12 The results confirm that
Medicaid coverage increased overall health care
utilization, improved self-reported health, and re-
duced financial strain; these findings are consis-
tent with previously published results based on
mail surveys conducted approximately 1 year af-
Table 3. Mean Values and Absolute Change in Health-Related
Quality of Life and Happiness with Medicaid Coverage.*
Variable
Mean Value in
Control Group
Change with Medicaid
Coverage (95% CI)† P Value
Health-related quality of life
Health same or better vs. 1 yr earlier (%) 80.4 7.84 (1.45 to
PERSPECTIVEn engl j med 368;6 nejm.org february 7, 2013496.docx

More Related Content

Similar to PERSPECTIVEn engl j med 368;6 nejm.org february 7, 2013496.docx

Research Proposal 7-10-2013
Research Proposal 7-10-2013Research Proposal 7-10-2013
Research Proposal 7-10-2013Sarah DeCloux
 
You should respond to at least two of your peers by extending- refutin.docx
You should respond to at least two of your peers by extending- refutin.docxYou should respond to at least two of your peers by extending- refutin.docx
You should respond to at least two of your peers by extending- refutin.docxjosee57
 
The ACA and LGBT Individuals - New Options for Coverage and Care
The ACA and LGBT Individuals - New Options for Coverage and CareThe ACA and LGBT Individuals - New Options for Coverage and Care
The ACA and LGBT Individuals - New Options for Coverage and CareKFF
 
Rider - NASMHPD Assmt 2 - Medicaid BH Flexibility for Youth (09-14)
Rider - NASMHPD Assmt 2 - Medicaid BH Flexibility for Youth (09-14)Rider - NASMHPD Assmt 2 - Medicaid BH Flexibility for Youth (09-14)
Rider - NASMHPD Assmt 2 - Medicaid BH Flexibility for Youth (09-14)Frank Rider
 
· Summery for each article (separate).· The summery should answe.docx
· Summery for each article (separate).· The summery should answe.docx· Summery for each article (separate).· The summery should answe.docx
· Summery for each article (separate).· The summery should answe.docxoswald1horne84988
 
2013 community health workers nej mp1305636
2013 community health workers nej mp13056362013 community health workers nej mp1305636
2013 community health workers nej mp1305636Roger Zapata
 
Final ProjectThe major written assignment, a Health Policy Ana.docx
Final ProjectThe major written assignment, a Health Policy Ana.docxFinal ProjectThe major written assignment, a Health Policy Ana.docx
Final ProjectThe major written assignment, a Health Policy Ana.docxvoversbyobersby
 
1 3Defining the ProblemRigina CochranMPA593August 1.docx
1     3Defining the ProblemRigina CochranMPA593August 1.docx1     3Defining the ProblemRigina CochranMPA593August 1.docx
1 3Defining the ProblemRigina CochranMPA593August 1.docxsmithhedwards48727
 
Take a look at the below link and then answer the below questions .docx
Take a look at the below link and then answer the below questions .docxTake a look at the below link and then answer the below questions .docx
Take a look at the below link and then answer the below questions .docxssuserf9c51d
 
11 minutes agoJessica Dunne RE Discussion - Week 3COLLAPS.docx
11 minutes agoJessica Dunne RE Discussion - Week 3COLLAPS.docx11 minutes agoJessica Dunne RE Discussion - Week 3COLLAPS.docx
11 minutes agoJessica Dunne RE Discussion - Week 3COLLAPS.docxdrennanmicah
 
12MGT 301Individual paper.docx
12MGT 301Individual paper.docx12MGT 301Individual paper.docx
12MGT 301Individual paper.docxmoggdede
 
Medicaid's Role for People with Disabilities
Medicaid's Role for People with DisabilitiesMedicaid's Role for People with Disabilities
Medicaid's Role for People with DisabilitiesVikki Wachino
 
Community Wellness Health Medical Essay.docx
Community Wellness Health Medical Essay.docxCommunity Wellness Health Medical Essay.docx
Community Wellness Health Medical Essay.docxwrite12
 
Community Wellness Health Medical Essay.docx
Community Wellness Health Medical Essay.docxCommunity Wellness Health Medical Essay.docx
Community Wellness Health Medical Essay.docxwrite31
 
Medicaid Update - SCHA
Medicaid Update - SCHAMedicaid Update - SCHA
Medicaid Update - SCHABobby Rettew
 
Competitive Analysis Strategic Project Shyree Shepeard
Competitive Analysis Strategic Project Shyree ShepeardCompetitive Analysis Strategic Project Shyree Shepeard
Competitive Analysis Strategic Project Shyree ShepeardShyree Shepeard, MHA
 
Standards of Evaluation.docx
Standards of Evaluation.docxStandards of Evaluation.docx
Standards of Evaluation.docxwrite5
 
Pres Wss13 Nov2008 Davern
Pres Wss13 Nov2008 DavernPres Wss13 Nov2008 Davern
Pres Wss13 Nov2008 Davernsoder145
 
According to this idea that gender is socially constructed, answer.docx
According to this idea that gender is socially constructed, answer.docxAccording to this idea that gender is socially constructed, answer.docx
According to this idea that gender is socially constructed, answer.docxronak56
 

Similar to PERSPECTIVEn engl j med 368;6 nejm.org february 7, 2013496.docx (20)

Research Proposal 7-10-2013
Research Proposal 7-10-2013Research Proposal 7-10-2013
Research Proposal 7-10-2013
 
You should respond to at least two of your peers by extending- refutin.docx
You should respond to at least two of your peers by extending- refutin.docxYou should respond to at least two of your peers by extending- refutin.docx
You should respond to at least two of your peers by extending- refutin.docx
 
2015 HCM PACA Reform
2015 HCM PACA Reform2015 HCM PACA Reform
2015 HCM PACA Reform
 
The ACA and LGBT Individuals - New Options for Coverage and Care
The ACA and LGBT Individuals - New Options for Coverage and CareThe ACA and LGBT Individuals - New Options for Coverage and Care
The ACA and LGBT Individuals - New Options for Coverage and Care
 
Rider - NASMHPD Assmt 2 - Medicaid BH Flexibility for Youth (09-14)
Rider - NASMHPD Assmt 2 - Medicaid BH Flexibility for Youth (09-14)Rider - NASMHPD Assmt 2 - Medicaid BH Flexibility for Youth (09-14)
Rider - NASMHPD Assmt 2 - Medicaid BH Flexibility for Youth (09-14)
 
· Summery for each article (separate).· The summery should answe.docx
· Summery for each article (separate).· The summery should answe.docx· Summery for each article (separate).· The summery should answe.docx
· Summery for each article (separate).· The summery should answe.docx
 
2013 community health workers nej mp1305636
2013 community health workers nej mp13056362013 community health workers nej mp1305636
2013 community health workers nej mp1305636
 
Final ProjectThe major written assignment, a Health Policy Ana.docx
Final ProjectThe major written assignment, a Health Policy Ana.docxFinal ProjectThe major written assignment, a Health Policy Ana.docx
Final ProjectThe major written assignment, a Health Policy Ana.docx
 
1 3Defining the ProblemRigina CochranMPA593August 1.docx
1     3Defining the ProblemRigina CochranMPA593August 1.docx1     3Defining the ProblemRigina CochranMPA593August 1.docx
1 3Defining the ProblemRigina CochranMPA593August 1.docx
 
Take a look at the below link and then answer the below questions .docx
Take a look at the below link and then answer the below questions .docxTake a look at the below link and then answer the below questions .docx
Take a look at the below link and then answer the below questions .docx
 
11 minutes agoJessica Dunne RE Discussion - Week 3COLLAPS.docx
11 minutes agoJessica Dunne RE Discussion - Week 3COLLAPS.docx11 minutes agoJessica Dunne RE Discussion - Week 3COLLAPS.docx
11 minutes agoJessica Dunne RE Discussion - Week 3COLLAPS.docx
 
12MGT 301Individual paper.docx
12MGT 301Individual paper.docx12MGT 301Individual paper.docx
12MGT 301Individual paper.docx
 
Medicaid's Role for People with Disabilities
Medicaid's Role for People with DisabilitiesMedicaid's Role for People with Disabilities
Medicaid's Role for People with Disabilities
 
Community Wellness Health Medical Essay.docx
Community Wellness Health Medical Essay.docxCommunity Wellness Health Medical Essay.docx
Community Wellness Health Medical Essay.docx
 
Community Wellness Health Medical Essay.docx
Community Wellness Health Medical Essay.docxCommunity Wellness Health Medical Essay.docx
Community Wellness Health Medical Essay.docx
 
Medicaid Update - SCHA
Medicaid Update - SCHAMedicaid Update - SCHA
Medicaid Update - SCHA
 
Competitive Analysis Strategic Project Shyree Shepeard
Competitive Analysis Strategic Project Shyree ShepeardCompetitive Analysis Strategic Project Shyree Shepeard
Competitive Analysis Strategic Project Shyree Shepeard
 
Standards of Evaluation.docx
Standards of Evaluation.docxStandards of Evaluation.docx
Standards of Evaluation.docx
 
Pres Wss13 Nov2008 Davern
Pres Wss13 Nov2008 DavernPres Wss13 Nov2008 Davern
Pres Wss13 Nov2008 Davern
 
According to this idea that gender is socially constructed, answer.docx
According to this idea that gender is socially constructed, answer.docxAccording to this idea that gender is socially constructed, answer.docx
According to this idea that gender is socially constructed, answer.docx
 

More from mattjtoni51554

you will evaluate the history of cryptography from its origins.  Ana.docx
you will evaluate the history of cryptography from its origins.  Ana.docxyou will evaluate the history of cryptography from its origins.  Ana.docx
you will evaluate the history of cryptography from its origins.  Ana.docxmattjtoni51554
 
You will do this project in a group of 5 or less. Each group or in.docx
You will do this project in a group of 5 or less. Each group or in.docxYou will do this project in a group of 5 or less. Each group or in.docx
You will do this project in a group of 5 or less. Each group or in.docxmattjtoni51554
 
you will discuss the use of a tool for manual examination of a .docx
you will discuss the use of a tool for manual examination of a .docxyou will discuss the use of a tool for manual examination of a .docx
you will discuss the use of a tool for manual examination of a .docxmattjtoni51554
 
you will discuss sexuality, popular culture and the media.  What is .docx
you will discuss sexuality, popular culture and the media.  What is .docxyou will discuss sexuality, popular culture and the media.  What is .docx
you will discuss sexuality, popular culture and the media.  What is .docxmattjtoni51554
 
You will discuss assigned questions for the ModuleWeek. · Answe.docx
You will discuss assigned questions for the ModuleWeek. · Answe.docxYou will discuss assigned questions for the ModuleWeek. · Answe.docx
You will discuss assigned questions for the ModuleWeek. · Answe.docxmattjtoni51554
 
You will develop a proposed public health nursing intervention to me.docx
You will develop a proposed public health nursing intervention to me.docxYou will develop a proposed public health nursing intervention to me.docx
You will develop a proposed public health nursing intervention to me.docxmattjtoni51554
 
You will develop a comprehensive literature search strategy. After r.docx
You will develop a comprehensive literature search strategy. After r.docxYou will develop a comprehensive literature search strategy. After r.docx
You will develop a comprehensive literature search strategy. After r.docxmattjtoni51554
 
You will develop a formal information paper that addresses the l.docx
You will develop a formal information paper that addresses the l.docxYou will develop a formal information paper that addresses the l.docx
You will develop a formal information paper that addresses the l.docxmattjtoni51554
 
You will design a patient education tool that can be used by nurses .docx
You will design a patient education tool that can be used by nurses .docxYou will design a patient education tool that can be used by nurses .docx
You will design a patient education tool that can be used by nurses .docxmattjtoni51554
 
You will design a patient education tool that can be used by nur.docx
You will design a patient education tool that can be used by nur.docxYou will design a patient education tool that can be used by nur.docx
You will design a patient education tool that can be used by nur.docxmattjtoni51554
 
You will create an entire Transformational Change Management Plan fo.docx
You will create an entire Transformational Change Management Plan fo.docxYou will create an entire Transformational Change Management Plan fo.docx
You will create an entire Transformational Change Management Plan fo.docxmattjtoni51554
 
You will create an Access School Management System Database that can.docx
You will create an Access School Management System Database that can.docxYou will create an Access School Management System Database that can.docx
You will create an Access School Management System Database that can.docxmattjtoni51554
 
You will create a 13 slide powerpoint presentation (including your r.docx
You will create a 13 slide powerpoint presentation (including your r.docxYou will create a 13 slide powerpoint presentation (including your r.docx
You will create a 13 slide powerpoint presentation (including your r.docxmattjtoni51554
 
You will create a 10 minute virtual tour of a cultural museum” that.docx
You will create a 10 minute virtual tour of a cultural museum” that.docxYou will create a 10 minute virtual tour of a cultural museum” that.docx
You will create a 10 minute virtual tour of a cultural museum” that.docxmattjtoni51554
 
You will continue the previous discussion by considering the sacred.docx
You will continue the previous discussion by considering the sacred.docxYou will continue the previous discussion by considering the sacred.docx
You will continue the previous discussion by considering the sacred.docxmattjtoni51554
 
You will craft individual essays in response to the provided prompts.docx
You will craft individual essays in response to the provided prompts.docxYou will craft individual essays in response to the provided prompts.docx
You will craft individual essays in response to the provided prompts.docxmattjtoni51554
 
You will complete the Aquifer case,Internal Medicine 14 18-year.docx
You will complete the Aquifer case,Internal Medicine 14 18-year.docxYou will complete the Aquifer case,Internal Medicine 14 18-year.docx
You will complete the Aquifer case,Internal Medicine 14 18-year.docxmattjtoni51554
 
You will complete the Aquifer case,Internal Medicine 14 18-.docx
You will complete the Aquifer case,Internal Medicine 14 18-.docxYou will complete the Aquifer case,Internal Medicine 14 18-.docx
You will complete the Aquifer case,Internal Medicine 14 18-.docxmattjtoni51554
 
You will complete several steps for this assignment.Step 1 Yo.docx
You will complete several steps for this assignment.Step 1 Yo.docxYou will complete several steps for this assignment.Step 1 Yo.docx
You will complete several steps for this assignment.Step 1 Yo.docxmattjtoni51554
 
You will compile a series of critical analyses of how does divorce .docx
You will compile a series of critical analyses of how does divorce .docxYou will compile a series of critical analyses of how does divorce .docx
You will compile a series of critical analyses of how does divorce .docxmattjtoni51554
 

More from mattjtoni51554 (20)

you will evaluate the history of cryptography from its origins.  Ana.docx
you will evaluate the history of cryptography from its origins.  Ana.docxyou will evaluate the history of cryptography from its origins.  Ana.docx
you will evaluate the history of cryptography from its origins.  Ana.docx
 
You will do this project in a group of 5 or less. Each group or in.docx
You will do this project in a group of 5 or less. Each group or in.docxYou will do this project in a group of 5 or less. Each group or in.docx
You will do this project in a group of 5 or less. Each group or in.docx
 
you will discuss the use of a tool for manual examination of a .docx
you will discuss the use of a tool for manual examination of a .docxyou will discuss the use of a tool for manual examination of a .docx
you will discuss the use of a tool for manual examination of a .docx
 
you will discuss sexuality, popular culture and the media.  What is .docx
you will discuss sexuality, popular culture and the media.  What is .docxyou will discuss sexuality, popular culture and the media.  What is .docx
you will discuss sexuality, popular culture and the media.  What is .docx
 
You will discuss assigned questions for the ModuleWeek. · Answe.docx
You will discuss assigned questions for the ModuleWeek. · Answe.docxYou will discuss assigned questions for the ModuleWeek. · Answe.docx
You will discuss assigned questions for the ModuleWeek. · Answe.docx
 
You will develop a proposed public health nursing intervention to me.docx
You will develop a proposed public health nursing intervention to me.docxYou will develop a proposed public health nursing intervention to me.docx
You will develop a proposed public health nursing intervention to me.docx
 
You will develop a comprehensive literature search strategy. After r.docx
You will develop a comprehensive literature search strategy. After r.docxYou will develop a comprehensive literature search strategy. After r.docx
You will develop a comprehensive literature search strategy. After r.docx
 
You will develop a formal information paper that addresses the l.docx
You will develop a formal information paper that addresses the l.docxYou will develop a formal information paper that addresses the l.docx
You will develop a formal information paper that addresses the l.docx
 
You will design a patient education tool that can be used by nurses .docx
You will design a patient education tool that can be used by nurses .docxYou will design a patient education tool that can be used by nurses .docx
You will design a patient education tool that can be used by nurses .docx
 
You will design a patient education tool that can be used by nur.docx
You will design a patient education tool that can be used by nur.docxYou will design a patient education tool that can be used by nur.docx
You will design a patient education tool that can be used by nur.docx
 
You will create an entire Transformational Change Management Plan fo.docx
You will create an entire Transformational Change Management Plan fo.docxYou will create an entire Transformational Change Management Plan fo.docx
You will create an entire Transformational Change Management Plan fo.docx
 
You will create an Access School Management System Database that can.docx
You will create an Access School Management System Database that can.docxYou will create an Access School Management System Database that can.docx
You will create an Access School Management System Database that can.docx
 
You will create a 13 slide powerpoint presentation (including your r.docx
You will create a 13 slide powerpoint presentation (including your r.docxYou will create a 13 slide powerpoint presentation (including your r.docx
You will create a 13 slide powerpoint presentation (including your r.docx
 
You will create a 10 minute virtual tour of a cultural museum” that.docx
You will create a 10 minute virtual tour of a cultural museum” that.docxYou will create a 10 minute virtual tour of a cultural museum” that.docx
You will create a 10 minute virtual tour of a cultural museum” that.docx
 
You will continue the previous discussion by considering the sacred.docx
You will continue the previous discussion by considering the sacred.docxYou will continue the previous discussion by considering the sacred.docx
You will continue the previous discussion by considering the sacred.docx
 
You will craft individual essays in response to the provided prompts.docx
You will craft individual essays in response to the provided prompts.docxYou will craft individual essays in response to the provided prompts.docx
You will craft individual essays in response to the provided prompts.docx
 
You will complete the Aquifer case,Internal Medicine 14 18-year.docx
You will complete the Aquifer case,Internal Medicine 14 18-year.docxYou will complete the Aquifer case,Internal Medicine 14 18-year.docx
You will complete the Aquifer case,Internal Medicine 14 18-year.docx
 
You will complete the Aquifer case,Internal Medicine 14 18-.docx
You will complete the Aquifer case,Internal Medicine 14 18-.docxYou will complete the Aquifer case,Internal Medicine 14 18-.docx
You will complete the Aquifer case,Internal Medicine 14 18-.docx
 
You will complete several steps for this assignment.Step 1 Yo.docx
You will complete several steps for this assignment.Step 1 Yo.docxYou will complete several steps for this assignment.Step 1 Yo.docx
You will complete several steps for this assignment.Step 1 Yo.docx
 
You will compile a series of critical analyses of how does divorce .docx
You will compile a series of critical analyses of how does divorce .docxYou will compile a series of critical analyses of how does divorce .docx
You will compile a series of critical analyses of how does divorce .docx
 

Recently uploaded

Hybridoma Technology ( Production , Purification , and Application )
Hybridoma Technology  ( Production , Purification , and Application  ) Hybridoma Technology  ( Production , Purification , and Application  )
Hybridoma Technology ( Production , Purification , and Application ) Sakshi Ghasle
 
“Oh GOSH! Reflecting on Hackteria's Collaborative Practices in a Global Do-It...
“Oh GOSH! Reflecting on Hackteria's Collaborative Practices in a Global Do-It...“Oh GOSH! Reflecting on Hackteria's Collaborative Practices in a Global Do-It...
“Oh GOSH! Reflecting on Hackteria's Collaborative Practices in a Global Do-It...Marc Dusseiller Dusjagr
 
microwave assisted reaction. General introduction
microwave assisted reaction. General introductionmicrowave assisted reaction. General introduction
microwave assisted reaction. General introductionMaksud Ahmed
 
Paris 2024 Olympic Geographies - an activity
Paris 2024 Olympic Geographies - an activityParis 2024 Olympic Geographies - an activity
Paris 2024 Olympic Geographies - an activityGeoBlogs
 
SOCIAL AND HISTORICAL CONTEXT - LFTVD.pptx
SOCIAL AND HISTORICAL CONTEXT - LFTVD.pptxSOCIAL AND HISTORICAL CONTEXT - LFTVD.pptx
SOCIAL AND HISTORICAL CONTEXT - LFTVD.pptxiammrhaywood
 
Separation of Lanthanides/ Lanthanides and Actinides
Separation of Lanthanides/ Lanthanides and ActinidesSeparation of Lanthanides/ Lanthanides and Actinides
Separation of Lanthanides/ Lanthanides and ActinidesFatimaKhan178732
 
ECONOMIC CONTEXT - LONG FORM TV DRAMA - PPT
ECONOMIC CONTEXT - LONG FORM TV DRAMA - PPTECONOMIC CONTEXT - LONG FORM TV DRAMA - PPT
ECONOMIC CONTEXT - LONG FORM TV DRAMA - PPTiammrhaywood
 
Presiding Officer Training module 2024 lok sabha elections
Presiding Officer Training module 2024 lok sabha electionsPresiding Officer Training module 2024 lok sabha elections
Presiding Officer Training module 2024 lok sabha electionsanshu789521
 
Crayon Activity Handout For the Crayon A
Crayon Activity Handout For the Crayon ACrayon Activity Handout For the Crayon A
Crayon Activity Handout For the Crayon AUnboundStockton
 
Class 11 Legal Studies Ch-1 Concept of State .pdf
Class 11 Legal Studies Ch-1 Concept of State .pdfClass 11 Legal Studies Ch-1 Concept of State .pdf
Class 11 Legal Studies Ch-1 Concept of State .pdfakmcokerachita
 
Interactive Powerpoint_How to Master effective communication
Interactive Powerpoint_How to Master effective communicationInteractive Powerpoint_How to Master effective communication
Interactive Powerpoint_How to Master effective communicationnomboosow
 
Concept of Vouching. B.Com(Hons) /B.Compdf
Concept of Vouching. B.Com(Hons) /B.CompdfConcept of Vouching. B.Com(Hons) /B.Compdf
Concept of Vouching. B.Com(Hons) /B.CompdfUmakantAnnand
 
Alper Gobel In Media Res Media Component
Alper Gobel In Media Res Media ComponentAlper Gobel In Media Res Media Component
Alper Gobel In Media Res Media ComponentInMediaRes1
 
BASLIQ CURRENT LOOKBOOK LOOKBOOK(1) (1).pdf
BASLIQ CURRENT LOOKBOOK  LOOKBOOK(1) (1).pdfBASLIQ CURRENT LOOKBOOK  LOOKBOOK(1) (1).pdf
BASLIQ CURRENT LOOKBOOK LOOKBOOK(1) (1).pdfSoniaTolstoy
 
Presentation by Andreas Schleicher Tackling the School Absenteeism Crisis 30 ...
Presentation by Andreas Schleicher Tackling the School Absenteeism Crisis 30 ...Presentation by Andreas Schleicher Tackling the School Absenteeism Crisis 30 ...
Presentation by Andreas Schleicher Tackling the School Absenteeism Crisis 30 ...EduSkills OECD
 
Introduction to ArtificiaI Intelligence in Higher Education
Introduction to ArtificiaI Intelligence in Higher EducationIntroduction to ArtificiaI Intelligence in Higher Education
Introduction to ArtificiaI Intelligence in Higher Educationpboyjonauth
 
How to Make a Pirate ship Primary Education.pptx
How to Make a Pirate ship Primary Education.pptxHow to Make a Pirate ship Primary Education.pptx
How to Make a Pirate ship Primary Education.pptxmanuelaromero2013
 
Accessible design: Minimum effort, maximum impact
Accessible design: Minimum effort, maximum impactAccessible design: Minimum effort, maximum impact
Accessible design: Minimum effort, maximum impactdawncurless
 
Kisan Call Centre - To harness potential of ICT in Agriculture by answer farm...
Kisan Call Centre - To harness potential of ICT in Agriculture by answer farm...Kisan Call Centre - To harness potential of ICT in Agriculture by answer farm...
Kisan Call Centre - To harness potential of ICT in Agriculture by answer farm...Krashi Coaching
 

Recently uploaded (20)

Hybridoma Technology ( Production , Purification , and Application )
Hybridoma Technology  ( Production , Purification , and Application  ) Hybridoma Technology  ( Production , Purification , and Application  )
Hybridoma Technology ( Production , Purification , and Application )
 
“Oh GOSH! Reflecting on Hackteria's Collaborative Practices in a Global Do-It...
“Oh GOSH! Reflecting on Hackteria's Collaborative Practices in a Global Do-It...“Oh GOSH! Reflecting on Hackteria's Collaborative Practices in a Global Do-It...
“Oh GOSH! Reflecting on Hackteria's Collaborative Practices in a Global Do-It...
 
microwave assisted reaction. General introduction
microwave assisted reaction. General introductionmicrowave assisted reaction. General introduction
microwave assisted reaction. General introduction
 
Paris 2024 Olympic Geographies - an activity
Paris 2024 Olympic Geographies - an activityParis 2024 Olympic Geographies - an activity
Paris 2024 Olympic Geographies - an activity
 
SOCIAL AND HISTORICAL CONTEXT - LFTVD.pptx
SOCIAL AND HISTORICAL CONTEXT - LFTVD.pptxSOCIAL AND HISTORICAL CONTEXT - LFTVD.pptx
SOCIAL AND HISTORICAL CONTEXT - LFTVD.pptx
 
Separation of Lanthanides/ Lanthanides and Actinides
Separation of Lanthanides/ Lanthanides and ActinidesSeparation of Lanthanides/ Lanthanides and Actinides
Separation of Lanthanides/ Lanthanides and Actinides
 
ECONOMIC CONTEXT - LONG FORM TV DRAMA - PPT
ECONOMIC CONTEXT - LONG FORM TV DRAMA - PPTECONOMIC CONTEXT - LONG FORM TV DRAMA - PPT
ECONOMIC CONTEXT - LONG FORM TV DRAMA - PPT
 
Presiding Officer Training module 2024 lok sabha elections
Presiding Officer Training module 2024 lok sabha electionsPresiding Officer Training module 2024 lok sabha elections
Presiding Officer Training module 2024 lok sabha elections
 
Crayon Activity Handout For the Crayon A
Crayon Activity Handout For the Crayon ACrayon Activity Handout For the Crayon A
Crayon Activity Handout For the Crayon A
 
Class 11 Legal Studies Ch-1 Concept of State .pdf
Class 11 Legal Studies Ch-1 Concept of State .pdfClass 11 Legal Studies Ch-1 Concept of State .pdf
Class 11 Legal Studies Ch-1 Concept of State .pdf
 
Interactive Powerpoint_How to Master effective communication
Interactive Powerpoint_How to Master effective communicationInteractive Powerpoint_How to Master effective communication
Interactive Powerpoint_How to Master effective communication
 
Concept of Vouching. B.Com(Hons) /B.Compdf
Concept of Vouching. B.Com(Hons) /B.CompdfConcept of Vouching. B.Com(Hons) /B.Compdf
Concept of Vouching. B.Com(Hons) /B.Compdf
 
Alper Gobel In Media Res Media Component
Alper Gobel In Media Res Media ComponentAlper Gobel In Media Res Media Component
Alper Gobel In Media Res Media Component
 
BASLIQ CURRENT LOOKBOOK LOOKBOOK(1) (1).pdf
BASLIQ CURRENT LOOKBOOK  LOOKBOOK(1) (1).pdfBASLIQ CURRENT LOOKBOOK  LOOKBOOK(1) (1).pdf
BASLIQ CURRENT LOOKBOOK LOOKBOOK(1) (1).pdf
 
Presentation by Andreas Schleicher Tackling the School Absenteeism Crisis 30 ...
Presentation by Andreas Schleicher Tackling the School Absenteeism Crisis 30 ...Presentation by Andreas Schleicher Tackling the School Absenteeism Crisis 30 ...
Presentation by Andreas Schleicher Tackling the School Absenteeism Crisis 30 ...
 
Introduction to ArtificiaI Intelligence in Higher Education
Introduction to ArtificiaI Intelligence in Higher EducationIntroduction to ArtificiaI Intelligence in Higher Education
Introduction to ArtificiaI Intelligence in Higher Education
 
How to Make a Pirate ship Primary Education.pptx
How to Make a Pirate ship Primary Education.pptxHow to Make a Pirate ship Primary Education.pptx
How to Make a Pirate ship Primary Education.pptx
 
Accessible design: Minimum effort, maximum impact
Accessible design: Minimum effort, maximum impactAccessible design: Minimum effort, maximum impact
Accessible design: Minimum effort, maximum impact
 
Staff of Color (SOC) Retention Efforts DDSD
Staff of Color (SOC) Retention Efforts DDSDStaff of Color (SOC) Retention Efforts DDSD
Staff of Color (SOC) Retention Efforts DDSD
 
Kisan Call Centre - To harness potential of ICT in Agriculture by answer farm...
Kisan Call Centre - To harness potential of ICT in Agriculture by answer farm...Kisan Call Centre - To harness potential of ICT in Agriculture by answer farm...
Kisan Call Centre - To harness potential of ICT in Agriculture by answer farm...
 

PERSPECTIVEn engl j med 368;6 nejm.org february 7, 2013496.docx

  • 1. PERSPECTIVE n engl j med 368;6 nejm.org february 7, 2013496 for aging. Highlighting the field’s orphan status, a decade-long ini- tiative by the Substance Abuse and Mental Health Services Adminis- tration implementing evidence- based geriatric mental health and substance-abuse programs throughout the country was re- cently eliminated, just as the wave of Baby Boomers turning 65 began to crest.1 On the re- search front, National Institutes of Health policy has inexplicably allowed the systematic exclusion of study participants over 65 years of age in federally funded research involving adults (but re- quires detailed justification for research that excludes women, minority groups, and children). This policy forces clinicians to extrapolate from findings on the safety and effectiveness of treat- ments that have been tested only in younger adults, and it perpetu- ates what has been called the “ev- idence-free” practice of geriatrics.
  • 2. We believe that steps should be taken to mandate the inclusion of older adults in federally funded research unless there is scientific justification for excluding them, and we agree with the IOM that immediate steps are needed to re- store the national program sup- porting the implementation of geriatric community mental health and substance-use programs. Emerging Medicare accountable care organizations should inte- grate geriatric mental health and substance-use expertise as com- ponents of health coaching and chronic disease management for patients with complex, high-cost health conditions. The potential for prevention must also be tapped, in part through the adop- tion of evidence-based psycholog- ical interventions that reduce the incidence of depression among patients with health conditions associated with greater risk, such as stroke and macular degenera- tion. Finally, the fragmentation and neglect of services and research may be addressed by creating a dedicated federal office responsi- ble for overseeing funding and coordination across the different agencies responsible for aging, mental health, and substance-use
  • 3. disorders. Although these reforms are necessary first steps, they will be insufficient without dramatic changes in what we do and how we do it. If we recognize that mental health care is a core com- ponent of general health care for aging Americans and transform the health care workforce ac- cordingly, there may be hope that we can weather the approaching “silver tsunami.” Disclosure forms provided by the authors are available with the full text of this article at NEJM.org. From the Departments of Psychiatry and of Community and Family Medicine, Geisel School of Medicine at Dartmouth, Ha- nover, NH (S.J.B.); and the Dartmouth In- stitute for Health Policy and Clinical Prac- tice, Lebanon, NH (S.J.B., J.A.N.). This article was published on January 23, 2013, and updated on February 7, 2013, at NEJM.org. 1. Institute of Medicine. The mental health and substance use workforce for older adults: in whose hands? Washington, DC: National Academies Press, 2012. 2. Bartels SJ, Clark RE, Peacock WJ, Dums
  • 4. AR, Pratt SI. Medicare and Medicaid costs for schizophrenia patients by age cohort compared with costs for depression, demen- tia, and medically ill patients. Am J Geriatr Psychiatry 2003;11:648-57. 3. Diachun LL, Charise A, Lingard L. Old news: why the 90-year crisis in medical elder care? J Am Geriatr Soc 2012;60:1357-60. 4. Reynolds CF III, Albert SM. Management of mental disorders: lessons from India. Lan- cet 2010;376:2045-6. 5. Patel V, Araya R, Chatterjee S, et al. Treat- ment and prevention of mental disorders in low-income and middle-income countries. Lancet 2007;370:991-1005. DOI: 10.1056/NEJMp1211456 Copyright © 2013 Massachusetts Medical Society. Underside of the Silver Tsunami U.S. Governors and the Medicaid Expansion — No Quick Resolution in Sight Benjamin D. Sommers, M.D., Ph.D., and Arnold M. Epstein, M.D. With President Barack Obama’s reelection in No- vember, the Affordable Care Act (ACA) will remain the law of the land for the foreseeable future. But since the Supreme Court rul- ing on the ACA, states have been grappling with the option the Court presented — whether to participate in the expansion of
  • 5. Medicaid eligibility to all adults with family incomes at or below 138% of the federal poverty level. In the aftermath of the 2012 election, it is uncertain how this process will play out, but what the states decide will play a criti- cal role in the future of the U.S. health care system. We undertook an in-depth ex- ploration of the views expressed by governors about the ACA Med- icaid expansion from the time of the Supreme Court ruling in June through 1 month after the November election. Although gov- ernors are, of course, only part of the state-level policymaking process, they directly oversee each state’s Medicaid program n engl j med 368;6 nejm.org february 7, 2013 PERSPECTIVE 497 U.S. GovernorS and The Medicaid expanSion in the executive branch and of- ten set the terms of debate with the legislature. We collected pub-
  • 6. lic statements (for full methods and references, see the Supple- mentary Appendix, available with the full text of this article at NEJM.org)1,2 from documents published in the summer and fall of 2012. In five states with newly elected governors, we in- cluded campaign statements from the winning candidate. We iden- tified major themes voiced by governors and cross-tabulated them according to whether each governor supports the expan- sion, opposes it, or remains un- decided (see Table 1). We then identified any changes since the election. Table 1. Likelihood of U.S. Governors’ Support for Expanding Medicaid under the ACA.* State (Governor’s Party) View on Medicaid Expansion State (Governor’s Party) View on Medicaid Expansion
  • 7. Before Election After Election† Before Election After Election† Florida (R) Oppose Undecided Alabama (R) Undecided Oppose Georgia (R) Oppose Oppose Alaska (R) Undecided Undecided Iowa (R) Oppose Undecided Arizona (R) Undecided Undecided Louisiana (R) Oppose Oppose Colorado (D) Undecided Support Maine (R) Oppose Oppose Idaho (R) Undecided Undecided Mississippi (R) Oppose Oppose Indiana (R)§ Undecided Oppose Nebraska (R) Oppose Oppose Kansas (R) Undecided Undecided South Carolina (R) Oppose Oppose Kentucky (D) Undecided Undecided Texas (R) Oppose Oppose Michigan (R) Undecided Undecided Virginia (R) Oppose Oppose Missouri (D) Undecided Support Arkansas (D) Support Support Montana (D)§ Undecided Support California (D) Support Support Nevada (R) Undecided Support
  • 8. Connecticut (D) Support Support New Hampshire (D)§ Undecided Support Delaware (D) Support Support New Jersey (R) Undecided Undecided District of Columbia (D)‡ Support Support New Mexico (R) Undecided Support Hawaii (D) Support Support North Carolina (R)§ Undecided Undecided Illinois (D) Support Support North Dakota (R) Undecided Undecided Maryland (D) Support Support Ohio (R) Undecided Undecided Massachusetts (D) Support Support Oklahoma (R) Undecided Oppose Minnesota (D) Support Support Pennsylvania (R) Undecided Undecided New York (D) Support Support South Dakota (R) Undecided Oppose Oregon (D) Support Support Tennessee (R) Undecided Undecided Rhode Island (I) Support Support Utah (R) Undecided Undecided Vermont (D) Support Support West Virginia (D) Undecided Undecided
  • 9. Washington (D)§ Support Support Wisconsin (R) Undecided Undecided Wyoming (R) Undecided Oppose * ACA denotes Affordable Care Act, D Democrat, I Independent, and R Republican. † “After election” refers to views as of January 13, 2013. In states with newly elected governors, “before election” refers to the views of the outgoing governor, and “after election” refers to the views of the governor-elect. ‡ The mayor is the head of the government of the District of Columbia. In our analysis, we therefore treated the mayor of the District of Columbia as the figure comparable to the governors in the 50 states. § In these states, a new governor was elected in November 2012. PERSPECTIVE n engl j med 368;6 nejm.org february 7, 2013498 Table 2 shows the most com- mon themes, according to gov- ernors’ support for or opposi- tion to the Medicaid expansion. Among governors opposed to expanding Medicaid, statements about affordability and impact on state budgets were nearly universal (92%). Cost concerns
  • 10. fell into several categories. Some pointed to the so-called wood- work effect, in which the ACA could draw previously eligible but unenrolled persons into Medicaid, at greater cost to the state. More than half the gover- nors opposing expansion pre- dicted that the federal govern- ment would renege on the generous terms of the ACA and scale back its share of Medicaid spending. Newly elected Gover- nor Mike Pence (R-IN) compared the expansion to “the classic gift of a baby elephant. . . . The federal government says, ‘We’ll pay for all the hay — for the first few years.’” Beyond cost, governors ex- pressed concern about the lack of state f lexibility or their belief that Medicaid may foster depen- dence among beneficiaries. For instance, Dennis Daugaard (R-SD) declared that “able-bodied adults should be self-reliant” — in con- trast to children or people with disabilities, the traditional Med- icaid beneficiaries. Others argued that Medicaid itself is the prob- lem, calling it a “broken pro- gram” that provides poor care.
  • 11. Most vividly, Rick Perry (R-TX) said that adding uninsured Tex- ans to Medicaid is “not unlike adding a thousand people to the Titanic.” Governors supporting the ex- pansion focused on the desire to expand coverage to uninsured persons, arguing that insurance would lead to greater access to care and improved health. Jay Nixon (D-MO) explained, “This will improve the health and the quality of life for hundreds of thousands of Missourians.” Many governors who support the Med- icaid expansion argued that it builds on previous coverage ex- pansions in their states and that it would actually save their states money by replacing local dollars with federal funds. Peter Shumlin (D-VT) explained that opponents “are acting like we are not already paying for this. What we’re proposing . . . is to pay less for something that we are already paying for right now.” Among uncommitted gover- nors, there were three dominant themes. First, three quarters of these governors said they need- ed more information on federal requirements, cost and enroll-
  • 12. ment projections, and policy al- ternatives. Second, affordability was a key concern, including the possibility of decreased federal funding in the future; as Jan U.S. GovernorS and The Medicaid expanSion Table 2. Common Themes in Governors’ Statements on Expanding Medicaid, Stratified by Support for or Opposition to the Expansion.* Group and Theme No. of Governors (%) 13 Governors opposing Medicaid expansion Concerns about impact on state budget 12 (92) States need more flexibility, freedom from federal oversight 9 (69) Federal government will renege on funding 7 (54) States would have to raise taxes to pay for it 7 (54) Uncertainty, need more information 7 (54) Medicaid is a “broken program,” harms its beneficiaries 5 (38) Entitlement programs create dependency 4 (31) 18 Governors supporting Medicaid expansion
  • 13. Medicaid will help cover the uninsured 14 (78) Expansion bolsters state’s preexisting efforts in health care 11 (61) Will save state or taxpayers money 7 (39) Medicaid will improve people’s health 4 (22) 20 Undecided governors Uncertainty, need more information 15 (75) Concerns about impact on state budget 11 (55) States need more flexibility, freedom from federal oversight 9 (45) Worried about having to cut funding for education and other programs 6 (30) Waiting until after election to make decision 6 (30) * Data are based on an analysis of 253 articles published between June 28 and December 7, 2012. Support for or opposition to the Medicaid expansion was deter- mined on the basis of the most recent comments made by governors, their admin- istrations, or both. Since the time of this analysis, 3 additional governors announced their support for the expansion in early January, bringing the revised total to 21 gov-
  • 14. ernors in support and 17 undecided. See the Supplementary Appendix for details on methods and a full reference list. n engl j med 368;6 nejm.org february 7, 2013 PERSPECTIVE 499 U.S. GovernorS and The Medicaid expanSion Brewer (R-AZ) explained, “At any whim they could just pull the money. So yeah, I’m a little gun- shy.” Finally, early on, nearly one third of undecided governors said they were waiting until the elec- tion to evaluate their options. Although some may have ex- pected the uncertainty to resolve swiftly after the election, that has not happened: as of January 2013, a total of 15 of the 26 governors who were undecided before the election remained un- decided (see Table 1). Some of this uncertainty reflects ongo- ing efforts to gather information about what will be permissible under the law. Several governors petitioned Medicaid to permit partial expansions, such as in-
  • 15. cluding only people with in- comes of up to 100% of the fed- eral poverty level. They reasoned that the federal government would pay the full cost of tax credits for people with incomes between 100 and 138% of the poverty level who sought health insurance through an exchange, whereas under the Medicaid ex- pansion, states will have to pay 10% of the costs in the long run. However, the Department of Health and Human Services re- cently clarified that partial expan- sions would not be permitted.3 Some ACA supporters con- tended that governors’ opposition after the Supreme Court ruling was simply preelection political posturing and that most states would find the ACA’s generous federal funding impossible to refuse.4 Some of the movement since the election bolsters this perspective: six governors have newly announced their support, including the first two Republi- can governors to publicly en- dorse the expansion. Two other governors who previously op- posed the expansion have now indicated that their minds are not completely made up. Rick
  • 16. Scott (R-FL), previously one of the most vocal opponents of the law, explained, “The election is over, and President Obama won. I’m responsible for the families of Florida. . . . If I can get to yes, I want to get to yes.” However, not everyone chang- ing position has endorsed ex- panding Medicaid. Five previously undecided Republican governors are now opposed, and some governors say they won’t decide until 2015 or 2016. Some oppo- sition may remain a negotiating ploy by governors with respect to opposing lawmakers or the federal government, but predic- tions of a rapid, pro-expansion resolution were apparently mis- taken. Moreover, governors are only part of the story; several statehouses (including the Re- publican-led Missouri legisla- ture and the newly Democratic Maine legislature) plan to op- pose their governors’ positions on the expansion. Overall, these results demon- strate governors’ conflicting views about the value of expand- ing insurance coverage versus the costs and federal oversight involved in doing so through
  • 17. Medicaid. As the dust has set- tled after the elections, no clear consensus has emerged, with 17 states still undecided and well under half supporting Medicaid expansion. It now appears that the ACA’s 2014 coverage expan- sion will have large unintended gaps, as low-income adults in at least a dozen states remain in- eligible for any kind of public subsidy for health insurance. Al- though those with incomes above 100% of the federal pov- erty level will be eligible for tax credits for exchange coverage in states that decline to expand Medicaid, that will still leave millions of adults living below the poverty level without health insurance and without the means of acquiring it. Though Medicaid was initially enacted in 1965, nine states did not participate until 1970 or lat- er, and it took nearly 20 years before the last holdout joined.5 One can only speculate about whether that history is about to be repeated, with insurance cov- erage for millions and the fate of the ACA hanging in the balance. Disclosure forms provided by the au-
  • 18. thors are available with the full text of this article at NEJM.org. From the Department of Health Policy and Management, Harvard School of Public Health, Boston. This article was published on January 16, 2013, at NEJM.org. 1. Where each state stands on ACA’s Medic- aid expansion. Washington, DC: Advisory Board Company, 2012 (http://www.advisory .com/Daily-Briefing/2012/11/09/ MedicaidMap). 2. Across the USA. McLean, VA: USA Today, 2012 (http://usatoday30.usatoday.com/news/ usaedition/2012-07-13-states13box_ st_u.htm). 3. Frequently asked questions on exchanges, market reforms, and Medicaid. Baltimore: Centers for Medicare & Medicaid Services, December 10, 2012 (http://cciio.cms.gov/ resources/files/exchanges-faqs-12-10-2012 .pdf). 4. Medicaid expansion may turn out to be an offer states can’t refuse. Mother Jones. July 18, 2012 (http://www.motherjones.com/ kevin-drum/2012/07/medicaid-expansion- may-turn-out-be-offer-states-cant-refuse). 5. A historical review of how states have re- sponded to the availability of federal funds for health coverage. Washington, DC: Kaiser Commission on Medicaid and the Uninsured, August 2012 (http://www.kff.org/medicaid/ upload/8349.pdf).
  • 19. DOI: 10.1056/NEJMp1215785 Copyright © 2013 Massachusetts Medical Society. Reproduced with permission of the copyright owner. Further reproduction prohibited without permission. Findings from Massachusetts Health Reform: Lessons for Other States Sharon K. Long Karen Stockley Kate Willrich Nordahl Coverage, Access, and Affordability under Health Reform: Learning from the Massachusetts Model While the impacts of the Affordable Care Act will vary across the states given their different circumstances, Massachusetts’ 2006 reform initiative, the template for national reform, provides a preview of the potential gains in insurance coverage, access to and use of care, and health care affordability for the rest of the nation. Under reform,
  • 20. uninsurance in Massachusetts dropped by more than 50%, due, in part, to an increase in employer-sponsored coverage. Gains in health care access and affordability were widespread, including a 28% decline in unmet need for doctor care and a 38% decline in high out-of-pocket costs. In April 2006, Massachusetts passed a compre- hensive health reform bill, An Act Providing Access To Affordable, Quality, Accountable Health Care (Chapter 58 of the Acts of 2006), that sought to move the state to near universal coverage. That legislation provided the tem- plate for the 2010 federal Affordable Care Act (ACA). Massachusetts’ reform initiative, like the ACA, includes, among other changes: an expansion of publicly subsidized coverage for low- and moderate-income people; the creation of health insurance exchanges for individuals and small businesses; insurance market re- forms; a mandate that individuals obtain in- surance coverage if affordable coverage is available; and a requirement that employers contribute toward health insurance premiums for their workers or face a penalty.1 Given the parallels with the Massachusetts legislation, the experience under reform in Massachusetts provides a preview of the potential implications of the ACA for the rest of the nation. While the impacts of the ACA will vary across the states given the complexity of their health care systems and policies in place prior to reform and the differences in their choices under the
  • 21. new law, the findings for Massachusetts are a confirmation that major gains in coverage and health care access are possible. To provide an assessment of the potential trajectory of the nation under the ACA based on the Massachusetts example, this paper summarizes the evidence of the impacts of Massachusetts’ health reform effort on insur- ance coverage, access to and use of care, and health care affordability for individuals since 2006. Our primary focus is on the findings based on the Massachusetts Health Reform Survey (MHRS), a comprehensive survey of nonelderly adults in Massachusetts that has provided the core assessment of the state’s reform effort to date (see, most recently, Long, Sharon K. Long, Ph.D., is a senior fellow at the Urban Institute. Karen Stockley, B.A., is a doctoral student in the Department of Economics, Harvard University. Kate Willrich Nordahl, M.S., is director of the Massachusetts Medicaid Policy Institute, Blue Cross Blue Shield of Massachusetts Foundation. Stockley acknowledges support from the National Science Foundation Graduate Research Fellowship under grant no. DGE-1144152. Address correspondence to Dr. Long at the Urban Institute, 2100 M St. N.W.,Washington DC 20037. Email: [email protected] Inquiry 49: 303–316 (Winter 2012/2013). ’ 2012 Excellus Health Plan, Inc. ISSN 0046-9580 10.5034/inquiryjrnl_49.04.03 www.inquiryjournal.org 303
  • 22. Stockley, and Dahlen 2012a,b). We supple- ment that overview with findings from studies that have used other data sources and methods as a check on the MHRS results, with a focus on studies that rely on stronger evaluation designs than the pre/post model that is possible with the MHRS. We end with a summary of some of the key challenges that Massachusetts has faced under health reform, the state’s strategies in addressing those challenges, and the prognosis for the ACA based on the Massachusetts case study. Comparison of Massachusetts Reform and the ACA As noted previously, there are many similar- ities between Massachusetts’ health reform and the ACA. Both include a requirement for individuals to obtain health insurance if affordable insurance is available to them, although the ACA requires this of all people while the Massachusetts law only requires it of adults. Both require employers above a certain size to offer coverage to their employees or face penalties, although the specifics of the requirements and penalties vary. Both expand Medicaid coverage and subsidize coverage for low-income populations to help make insur- ance more affordable, although the specifics here vary as well. Insurance market reforms, including guaranteed issue and modified com- munity rating, which had been implemented previously in Massachusetts in the mid-1990s, are also critical to the ACA.
  • 23. While there are broad similarities in the structure of health reform in Massachusetts and the ACA, few—if any—states, including Massachusetts, are implementing the ACA under political and economic conditions as favorable as those facing Massachusetts in 2006. First, Massachusetts’ reform effort built on many years of incremental reform that laid the foundation for the 2006 push for near universal coverage (McDonough et al. 2006). Of particular importance, the state had previously implemented insurance market reforms and had expanded Medicaid cover- age under an earlier Section 1115 Medicaid waiver. That waiver provided $385 million in federal funds that could be used to support the 2006 expansion of coverage to the previously uninsured. Second, support for health reform was strong in the state, with the 2006 legislation the product of bipartisan compromise under a Republican governor (Mitt Romney) and Democratic majority legislature. Commitment to reform was also strong in the state across public and private stakeholders who supported the concept of ‘‘shared responsibility’’ by consumers, gov- ernment, and business for insurance coverage. In 2006, 69% of nonelderly adults in Massa- chusetts supported the state’s reform effort (Long, Stockley, and Dahlen 2012a), and in 2008, only 33% of employers disagreed with the statement that health reform had been ‘‘good for Massachusetts’’ (Gabel et al. 2008). Further, business leaders from across the state, including the Associated Industries of
  • 24. Massachusetts, the Greater Boston Chamber of Commerce, the Massachusetts Business Roundtable, and the Massachusetts Taxpayer Foundation, report that health reform has been good for business in Massachusetts (Raymond 2012). As a result, Massachusetts was able to move quickly to implement reform, expand coverage, and create the new health insurance exchange over a very short period of time (Dorn, Hill, and Hogan 2009). Thus, the gains from reform could be seen quickly in the state, which served to reinforce stakeholder support. By contrast, the rhetoric around the ACA has been intensely partisan, with strong opposition continuing after passage of the legislation. The share of the nation’s adults reporting a favorable opinion of the ACA has ranged from 34% to 50% since the law’s passage (Kaiser Family Foundation 2012), and within months of enactment, numerous lawsuits were filed challenging the constitu- tionality of key provisions. Eventually, the Supreme Court’s June 28, 2012, decision upheld the key provision of the law—its individual mandate—but effectively modified the law’s Medicaid expansion to give states the option to expand Medicaid coverage (SCO- TUS 2012). These political issues, combined with the lengthier timeline for implementation of many of the ACA’s key elements, mean that the process of implementing national reform is moving much more slowly and with more acrimony than did reform in Massachusetts.
  • 25. Inquiry/Volume 49, Winter 2012/2013 304 In addition to political differences, there are also strong economic differences between Massachusetts in 2006 and the nation today. Most notably, the country entered a severe economic recession in 2007 that, combined with the collapse of the housing market, has created long-lasting economic challenges. Al- though the recession officially ended in June 2009, the national unemployment rate stood at nearly 10% in March 2010 when the ACA was passed,2 with uninsurance at 16.3% in that year.3 By contrast, as health reform in Massachusetts began in 2006, the unemploy- ment rate in Massachusetts was at 4.8%,4 and uninsurance was at 10.4%.5 Thus, while we would expect the experiences under health reform in Massachusetts to be broadly appli- cable to the rest of the country, we would also expect variation across the states, reflecting their different starting points and their differ- ent political and economic environments. Data and Methods The Massachusetts Health Reform Survey The MHRS collects information on insurance coverage, access to and use of health care, and health care costs and affordability from working-age adults ages 19 to 64 in Massa-
  • 26. chusetts.6 The survey was first conducted in fall 2006, just before the implementation of many of the key elements of reform in the state,7 with additional rounds of the survey conducted each fall from 2007 to 2010. In survey years 2006 to 2009, the MHRS was based on stratified random samples of house- holds with a land-line telephone. In 2010, a random sample of cell phones was added to the survey to supplement the land-line tele- phone sample given the rapid increase in the share of adults in cell phone-only households (Blumberg and Luke 2011). The MHRS obtains information from a new cross-sectional sample of approximately 3,000 adults each year, with oversamples of unin- sured adults and lower-income adults. The overall response rate for the survey in 2010 was 39%, which combines the response rates for the land-line telephone sample (42%) and the cell phone sample (31%). While response rates for cell phone samples are generally lower than those for land-line samples, adding the cell phone sample captures a part of the popula- tion (the more than 25% of adults in cell phone-only households) that is missed com- pletely in surveys that focus only on the population with a land-line telephone. As a result, the combined land-line and cell phone samples provide survey data that are more representative of the population than a land- line sample alone. The response rate for earlier years of the survey, which relied on land-line samples only, ranged from 43% to 49%.8 All
  • 27. tabulations based on the survey data were prepared using weights that adjust for the complex design of the survey and for under- coverage and survey nonresponse. Like all survey-based research, the MHRS relies on self-reported information. The quality of the data depends on the survey respondent’s ability to understand the questions and the response categories, to remember the relevant information, and to report the information accurately. We would not expect there to have been changes in recall and reporting accuracy over the time period of the survey. Changes over Time under Health Reform We compare the outcomes for cross-sectional samples of adults in periods following the implementation of health reform to the out- comes for a similar cross-sectional sample of adults just prior to the implementation of health reform (2006) using a pre/post frame- work. Any differences between the baseline time period (2006) and the follow-up time periods will reflect the impacts of Chapter 58 as well as other factors, beyond health reform, that changed during the time period. Thus, we cannot attribute trends over time since 2006 solely to the effects of health reform. Given this limitation, we draw on the findings from studies using evaluation meth- ods that offer the potential for controlling for such confounding factors as a check on the findings from the MHRS.
  • 28. In this analysis, we estimate the following regression model: Yi~azb1jXijzb2kREGIONik zb3 Y2007izb4 Y2008i zb5 Y2009izb6 Y2010izei, ð1Þ Coverage, Access, and Affordability 305 where Yi is the outcome of interest for individual i (e.g., insurance status, health care use); Xij is a series of variables to capture the characteristics of the individual and his or her family (including age, sex, race/ethnicity, citizenship, marital status, educational attain- ment, employment, firm size, self-reported health status, disability status, whether the indi- vidual had a chronic condition or was preg- nant, and family income);9 and REGIONik is a series of dummy variables to capture the region of the state in which the individual lived.10 We also include a series of dummy variables for each year 2007 to 2010, with 2006, the pre-reform year, omitted from the model. We test for differences in the out- comes for each year relative to 2006, reporting here on any differences in 2008 relative to 2006 (b4) as the measure of the early impacts of
  • 29. health reform, and any differences in 2010 relative to 2006 (b6) as the more long-term impacts that also capture the impacts of the recession and other changes beyond health reform. For ease of comparison across mod- els, we estimate linear probability models. All of the analyses were weighted and control for the complex design of the sample using the survey estimation procedures (svy) in Stata 11 (StataCorp 2009). In presenting the findings, we report out- comes for adults in the state as of 2010 and estimates of how those adults would have fared in Massachusetts in earlier years. To calculate the latter, we use the parameter estimates from the regression models to predict the outcomes that the adults in the 2010 sample would have had if they had been observed in each of the preceding study years. Estimates of differences across years for the 2010 sample were obtained using the margins command in Stata. We provide estimates for the overall population of nonelderly adults in the state and for lower-income adults with family incomes less than 300% of the federal poverty level (FPL)—the target population for many of the reforms under Chapter 58. In Massa- chusetts, most adults below 150% of FPL were eligible for MassHealth (the Medicaid program in Massachusetts) or, if they did not have access to coverage through an em- ployer, fully subsidized coverage under the
  • 30. new Commonwealth Care program. Partial subsidies under Commonwealth Care contin- ued for adults with incomes up to 300% of FPL. This compares to the ACA expansion of Medicaid to nearly all adults with incomes up to 138% of FPL and subsidies for private coverage up to 400% of FPL.11 In summarizing the findings, we report on a core set of outcome measures; a more comprehensive set of outcomes is available in the full evaluation report (Long, Stockley, and Dahlen 2012b) and in an earlier paper (Long, Stockley, and Dahlen 2012a). Summary of Impacts of Health Reform in Massachusetts Insurance Coverage Health insurance coverage expanded signif- icantly in Massachusetts under health re- form, increasing from 86.6% of nonelderly adults in 2006 to 94.2% in 2010 based on the MHRS (Table 1). The gains in coverage were particularly strong for lower-income adults, with the share that was insured increasing from 75.9% to 90.1% between 2006 and 2010. The increase in insurance coverage in Massachusetts over this period is in sharp contrast to the trend in the nation as a whole, where the share of nonelderly adults who were insured fell from 80.2% to 78.7% between 2006 and 2010 (Cohen, Ward, and Schiller 2011).12
  • 31. The gains in insurance coverage under reform in the state reflect growth in both employer-sponsored insurance (ESI) coverage and public or other coverage. ESI coverage in Massachusetts was nearly four percentage points higher in 2010 than it was prior to health reform for all nonelderly adults (68.0% versus 64.4%) and more than six percentage points higher for lower-income adults (41.9% versus 35.8%). There is no evidence that public coverage has ‘‘crowded out’’ ESI coverage under health reform in the state. Under reform, employers are more likely to offer health insurance coverage to their workers, with the share of employers offering coverage up from 70% in 2005 to 77% in 2010 (Massachusetts Division of Health Care Finance and Policy 2011). Nationally, 69% of employers offered coverage in 2010. Gabel Inquiry/Volume 49, Winter 2012/2013 306 and colleagues (2008) have speculated that one factor in increasing employer offer rates in the state may be the individual mandate, which increased the demand for insurance coverage by workers. Under reform, employ- ers may need to offer insurance coverage to their workers to remain competitive. These pre/post findings on insurance cover- age from the MHRS are supported by other
  • 32. studies using national survey data and stronger quasi-experimental designs.13 For example, using data for 2004 to 2007 from the Current Population Survey (CPS), Long, Stockley, and Yemane (2009) estimated difference-in-differ- ences models, comparing trends in insurance coverage in Massachusetts to trends in other similar states. They found that insurance coverage increased by 6.6 percentage points among nonelderly adults in the first year of reform, with ESI coverage increasing by 3.1 percentage points, and public and other coverage increasing by 3.5 percentage points. Consistent with the MHRS findings, the largest gains were for lower-income adults. In a similar study, Long and Stockley (2011) estimated difference-in-differences models for 2003 to 2008 from the National Health Interview Survey (NHIS) and also found an increase in insurance coverage due to the reforms, although the estimates from the NHIS are somewhat smaller–an increase of three percentage points for adults overall and four to six percentage points for lower-income adults. However, unlike the findings from the MHRS and CPS, the results from the NHIS did not show any evidence of a change in the levels of ESI coverage under reform. Finally, two studies have used the Behavior- al Risk Factor Surveillance System (BRFSS) to examine the impacts of health reform in Massachusetts using difference-in-differences models for 2006 to 2008 (Zhu et al. 2010) and interrupted time-series models for 2002 to 2009
  • 33. (Pande et al. 2011). While the insurance coverage measure in the BRFSS is more limited than those in the other surveys, both studies also found gains in coverage under reform in Massachusetts. Access, Use and Affordability of Health Care Massachusetts’ Chapter 58 was expected to increase access to and use of health care in the state by expanding health insurance coverage and by creating new standards that health plans needed to meet to count as coverage under the individual mandate. These ‘‘mini- mum creditable coverage’’ standards include requirements that call for a comprehensive set of benefits and limits on out-of-pocket spend- ing and on benefit caps, all of which would tend to lower the out-of-pocket costs of health care services for individuals. Consistent with the expanded insurance coverage and new minimum creditable cov- erage standards, health care access and use improved between 2006 and 2010 (Table 2). For example, in 2010, nonelderly adults in Massachusetts were more likely to have a place they usually went to when they were sick or needed advice about their health (up Table 1. Changes in health insurance coverage for all adults and lower-income adults 19 to 64 in Massachusetts, 2006 to 2010 All adults (%) Lower-income adults (%)
  • 34. 2006 2008 2010 2006 2008 2010 Had insurance coverage at the time of the survey 86.6 95.1** 94.2** 75.9 91.9** 90.1** Employer-sponsored coverage 64.4 69.3** 68.0** 35.8 43.5** 41.9** Public or other coverage 22.2 25.8** 26.2** 40.1 48.4** 48.2** Had insurance coverage for all of the past year 80.5 88.4** 87.9** 64.3 81.0** 79.8** Source: 2006–2010 Massachusetts Health Reform Surveys (all adults N515,544; lower-income adults N57,769). Notes: Lower-income is defined as less than 300% of the federal poverty level (FPL). The table’s regression-adjusted estimates are derived from models that control for age, gender, race/ethnicity, citizenship, marital status, parent status, education, employment, firm size, health status, disability status, whether the individual has chronic conditions or is pregnant, family income, and region-level fixed effects. Regression-adjusted estimates are predicted values calculated using the parameter estimates from the regression models to predict the outcomes that the individuals in the 2010 sample would have had if they had been observed in each of the preceding study years. * (**) Significantly different from the value in 2006 at the .05 (.01) level, two-tailed test. Coverage, Access, and Affordability 307
  • 35. from 85.7% to 90.4%), suggesting a stronger connection to the health care system. They were also more likely to have had a preventive care visit (up from 69.9% to 75.8%) and more likely to have had multiple doctor visits (up from 64.7% to 69.7%) over the past year. The patterns of gains in access under reform were similar for all adults and for lower-income adults. Additional evidence of improvements in access to care in Massachusetts can be seen by the decline in emergency department (ED) use between 2006 and 2010. Relative to 2006, the shares of nonelderly adults reporting any ED visit and ED visits for non-emergency conditions14 were lower in 2010, although the drop was not statistically significant for lower-income adults. The reduction in ED visits for non-emergency conditions, in par- ticular, is consistent with improvements in access to care and improved care delivery in the community. This could reflect the effects of health reform or other changes in the state targeted at ED use.15 Another element of access to care is the ability to obtain needed care in a timely manner. Nonelderly adults in Massachusetts were much less likely to report that they did not get needed care in 2010 relative to 2006. As shown in Table 2, reductions in unmet need were reported for doctor care; medical tests, treatment, or follow-up care; and pre- ventive care screenings. Reductions in unmet
  • 36. need were reported for all adults and for lower-income adults. With the increased insurance coverage and improved access to health care, we also find evidence of gains in the affordability of health care for nonelderly adults in Massachusetts under health reform (Table 3). These include a reduction in the burden of out-of-pocket health care spending and less unmet need for care because of costs. Unmet need for care because of costs was also lower in 2010 for doctor care; medical tests, treatment, or follow-up care; and preventive care screen- ings. These patterns held true for adults overall and for lower-income adults. Lower- income adults were also more likely to report a significant drop in problems paying medical bills under health reform. In 2010, 26.1% of lower-income nonelderly adults reported Table 2. Changes in health care access for all adults and lower- income adults 19 to 64 in Massachusetts, fall 2006 to fall 2010 All adults (%) Lower-income adults (%) 2006 2008 2010 2006 2008 2010 Has a usual source of care (excluding the emergency department [ED]) 85.7 91.2** 90.4** 78.5 86.5** 84.2* Health care use in past year Any general doctor visit 79.5 84.1** 81.7 74.7 79.2 77.9
  • 37. Visit for preventive care 69.9 76.2** 75.8** 64.5 71.8** 72.1** Multiple doctor visits 64.7 68.6* 69.7** 61.0 65.7 68.5** Any ED visits 34.2 33.2 30.4* 45.3 44.6 42.4 Most recent ED visit was for non-emergency conditiona 16.0 14.6 12.2** 22.9 20.8 18.8 Did not get needed care in past year Doctor care 8.1 6.9 5.8* 13.4 12.0 9.3* Medical tests, treatment, or follow-up care 9.2 7.8 7.0** 14.0 13.0 9.6** Preventive care screening 6.9 5.6 4.4** 8.3 9.3 5.2** Source: 2006–2010 Massachusetts Health Reform Surveys (all adults N515,544; lower-income adults N57,769). Notes: Lower-income is defined as less than 300% of the federal poverty level (FPL). The table’s regression-adjusted estimates are derived from models that control for age, gender, race/ethnicity, citizenship, marital status, parent status, education, employment, firm size, health status, disability status, whether the individual has chronic conditions or is pregnant, family income, and region-level fixed effects. Regression-adjusted estimates are predicted values calculated using the parameter estimates from the regression models to predict the outcomes that the individuals in the 2010 sample would have had if they had been observed in each of the preceding study years. * (**) Significantly different from the value in 2006 at the .05 (.01) level, two-tailed test. a A condition that the respondent thought could have been treated by a regular doctor if one had been available. Inquiry/Volume 49, Winter 2012/2013
  • 38. 308 problems paying medical bills, as compared to 30.7% in 2006. Other studies of the impacts on health care access and affordability using national survey data also support the gains found in the MHRS, although the work generally has been constrained by short follow-up periods for tracking changes in access to care and a limited set of measures. Long and Stockley’s (2011) study using the 2003 to 2008 NHIS found some evidence of reductions in unmet need for care, delays in obtaining needed care overall, and delays in obtaining needed care due to costs by 2008. However, they also found some evidence of increases in delayed care because of difficulty getting an appoint- ment for adults overall, and increases in delayed care because of difficulty getting to the provider during office hours for lower- income adults. Similarly, the study by Zhu et al. (2010), which used the 2006 to 2008 BRFSS, found a reduction in unmet need for care due to cost (a decline of two percentage points by 2008), but no change in the probability of having a usual source of care. Using a longer time period in the BRFSS (2002 to 2009) and a different model specifi- cation than Zhu and colleagues, Pande et al. (2011) found evidence of a stronger reduction
  • 39. in unmet need for care due to cost (down 4.8 percentage points) and an increase in the share of nonelderly adults with a usual source of care (up 6.6 percentage points).16 Finally, in work using 2002 to 2008 hospital discharge data for multiple states and difference-in-differences methods, Miller (2012) found evidence of a reduction in aggregate ED use by Massachusetts residents of between 5% and 8%, mostly due to a reduction in nonurgent visits. Those patterns are consistent with the ED reductions for non-emergency care reported for Massachu- setts in the MHRS. Given the important role of public coverage expansions in the Massachusetts reform, well designed studies of the impacts of public coverage expansions in other states can also inform our understanding of the effects of reform in Massachusetts. The recent Oregon Health Insurance Experiment, which expand- ed Medicaid coverage to randomly selected applicants in the state, provides the best available evidence on the impacts of public coverage expansions to low-income popula- tions (Finkelstein et al. 2012). Evidence from the first year of the Oregon study shows Table 3. Changes in affordability of health care for all adults and lower-income adults 19 to 64 in Massachusetts, fall 2006 to fall 2010 All adults (%) Lower-income adults (%)
  • 40. 2006 2008 2010 2006 2008 2010 Out-of-pocket health care spending over the past year was 10% or more of family incomea 9.8 7.9 6.1** 13.3 10.8 7.5** Had problems paying bills in the past year Medical bills 19.4 17.2 17.5 30.7 26.1* 26.1* Other bills 23.4 23.4 25.2 34.1 36.8 38.1 Unmet need for care because of costs in the past year Doctor care 5.7 2.8** 3.2** 11.1 5.0** 4.7** Medical tests, treatment, or follow-up care 6.0 3.6** 3.7** 10.8 6.5** 5.1** Preventive care screening 3.5 2.3* 2.3* 5.8 4.3 3.1** Prescription drugs 5.3 3.7** 4.4 9.6 5.1** 6.2** Source: 2006–2010 Massachusetts Health Reform Surveys (all adults N515,544; lower-income adults N57,769). Notes: Lower-income is defined as less than 300% of the federal poverty level (FPL). The table’s regression-adjusted estimates are derived from models that control for age, gender, race/ethnicity, citizenship, marital status, parent status, education, employment, firm size, health status, disability status, whether the individual has chronic conditions or is pregnant, family income, and region-level fixed effects. Regression-adjusted estimates are predicted values calculated using the parameter estimates from the regression models to predict the outcomes that the individuals in the 2010 sample would have had if they had been observed in each of the preceding study years. a Because of the way the income information is collected in the survey, the measures of spending relative to family income
  • 41. cannot be constructed for adults with family income above 500% of FPL. * (**) Significantly different from the value in 2006 at the .05 (.01) level, two-tailed test. Coverage, Access, and Affordability 309 improvements in access to care and reductions in medical debt as a result of the expansion in coverage, findings similar to those in Massa- chusetts for the lower-income adults targeted by the expansion of public coverage. Key Challenges under Health Reform in Massachusetts While Massachusetts has experienced signifi- cant gains in coverage, access to care, and affordability of care under health reform, achieving those gains has been challenging. Chapter 58 introduced a complex set of changes in the state’s health insurance and health care sectors, made more complicated by the changing economic and political landscape. Continuing Increase in Health Care Costs Health care costs in Massachusetts are high and continue to grow, reflecting, in part, the state’s decision to defer addressing costs in the 2006 legislation so as not to hold up the expansion in coverage. Between 2004 and
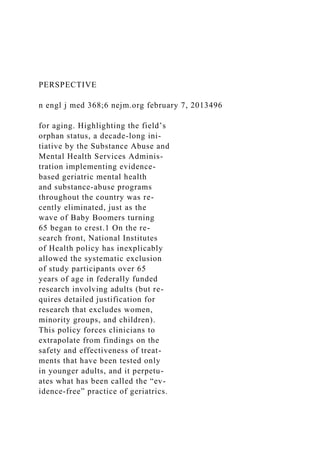
  • 42. 2009, personal health care spending per capita in Massachusetts increased by an average of 5.8% per year, to $9,278 in 2009, as compared to an average increase of 4.7%, to $6,815, for the nation as a whole (Cuckler et al. 2011). Consequently, the affordability of health care and financial problems related to high health care costs continue to burden many families in the state (Table 3). In 2010, more than one- quarter of nonelderly adults in Massachusetts reported that health care spending had caused financial problems for their family over the year, and a quarter reported that they were ‘‘not too confident’’ or ‘‘not confident at all’’ in their ability to afford the health care their family will need in the coming year (Figure 1). These findings are even starker for lower- income adults, where more than one-third reported that health care spending has caused financial problems for their family and more than one-third reported concern about their family’s ability to afford needed health care in the coming year. In the absence of any intervention, the burden of high health care costs will likely worsen, as health care spending per capita in Massachusetts, already the highest in the country, is projected to nearly double between 2010 and 2020 (Massachusetts Health Care Quality and Cost Council 2009). Beginning with the Massachusetts Health Care Quality and Cost Council that was created as part of the 2006 legislation, Massachusetts has invest- ed considerable public and private resources
  • 43. Figure 1. Massachusetts adults 19 to 64 reporting financial problems related to health care spending and with concerns about ability to afford health care in the future, 2010 (Source: 2010 Massachusetts Health Reform Survey, N53,032) (Lower- income adults are defined as adults with family income at or below 300% of the federal poverty level; higher-income adults are above that cutoff) Inquiry/Volume 49, Winter 2012/2013 310 into understanding the drivers of health care costs in the state. That has included wide- ranging discussions across stakeholders of potential strategies to ‘‘bend the curve,’’ as well as extensive annual public hearings on health care costs sponsored by the Division of Health Care Finance and Policy beginning in 2010, and reports issued by the Office of the Attorney General analyzing variation in health care prices (see, for example, Massa- chusetts Attorney General’s Office 2011). There is strong consensus in the state on the need to address rising health care costs as evidenced by a 2011 opinion poll showing 78% of respondents believing the high cost of health care to be either a ‘‘major problem’’ or ‘‘crisis’’ in the state (SteelFisher et al. 2011). After much debate in the state legislature,
  • 44. the state enacted a new law to address health care costs in August 2012: An Act Improving the Quality of Health Care and Reducing Costs Through Increased Transparency, Ef- ficiency and Innovation (Chapter 224 of the Acts of 2012). This law establishes a statewide goal of bringing the rate of growth in per- capita health care spending down to the rate of growth of the gross state product. That reduction is to be accomplished by, among other things, encouraging wide adoption of alternative payment methodologies by both public and private payers (including specific targets for Medicaid); supporting the expan- sion of electronic health records and health information technology; placing new scrutiny on health care market power and price variation (with the potential of penalties for health care entities that exceed cost growth benchmarks); and increasing price transpar- ency for consumers (Gosline and Rodman 2012). In addition to those changes, for a number of years now, there have been private efforts experimenting with alternative pay- ment methods by providers and insurers in the state to improve health care quality and reduce costs (see, for example, Blue Cross Blue Shield of Massachusetts’ Alternative Quality Contract in Chernew et al. 2011). Concerns about Provider Capacity with Expanded Coverage With the significant increase in insurance coverage under health reform in Massachu-
  • 45. setts, there were concerns about the ability of the health care system to meet the care needs of those who gained coverage while maintain- ing provider access for those who were already insured. While hard data on provider capacity in Massachusetts are difficult to come by, Figure 2. Massachusetts adults 19 to 64 reporting problems getting care over the past year due to provider access issues, 2010 (Source: 2010 Massachusetts Health Reform Survey, N53,032) (Lower-income adults are defined as adults with family income at or below 300% of the federal poverty level; higher-income adults are above that cutoff) Coverage, Access, and Affordability 311 some residents have reported problems finding providers. In 2010, for example, 17.9% of nonelderly adults in the state reported prob- lems getting care because of difficulties finding a provider who would see them (Figure 2). As shown, a quarter (24.5%) of lower-income adults and 12.8% of higher-income adults reported problems getting care because they were told that a provider was not taking new patients or not taking patients with their type of insurance. While these questions were not included in the MHRS prior to health reform, the NHIS shows some increases in the delays in obtaining needed care because of difficulty
  • 46. getting an appointment under health reform in Massachusetts (Long and Stockley 2011). The state is taking several approaches to broaden provider capacity under its new pay- ment reform law. These initiatives include: expanding the role of physician assistants to act as primary care providers; expanding the role of limited service clinics to act as a point of access to health care services provided by nurse practitioners; expanding an existing workforce loan forgiveness program to include providers of behavioral, substance use disorder and mental health services; and, establishing a new primary care residency program supported by the state. Churning in Coverage While Massachusetts has had a significant gain in insurance coverage under health reform, including an increase in the share of adults with full-year coverage, just under one in 10 non- elderly adults were uninsured at some point over the prior year and one in five experienced a change in insurance coverage in 2010 (Figure 3). Further, almost a quarter (22%) of lower- income adults and almost one in 10 (9.4%) higher-income adults reported that they were ‘‘not too confident’’ or ‘‘not confident at all’’ in their ability to keep their current insurance coverage in the coming year. Transitions in coverage raise concerns about continuity of care because individuals may have to change health plans and providers as they change coverage or because they may experience periods with no insurance coverage at all.
  • 47. The state has implemented, or is in the process of implementing, a number of opera- tional improvements to reduce unnecessary churn in its Medicaid program, some of which were directives in the new payment reform law recently passed by the legislature. These efforts include: providing families with Medicaid renewal forms that are already filled in with information obtained from administrative Figure 3. Massachusetts adults 19 to 64 reporting lack of coverage or unstable insurance coverage over the past year and concerns about keeping insurance coverage in the future, 2010 (Source: 2010 Massachusetts Health Reform Survey, N53,032) (Lower-income adults are defined as adults with family income at or below 300% of the federal poverty level; higher-income adults are above that cutoff) Inquiry/Volume 49, Winter 2012/2013 312 records to facilitate recertification; imple- menting ‘‘express lane’’ policies for Medicaid renewal for subgroups of enrollees who are unlikely to have had changes in eligibility; increasing administrative data matching with other state agencies to obtain the informa- tion needed to determine Medicaid eligibili- ty; relying on the eligibility redetermination processes of other programs, such as the
  • 48. Supplemental Nutrition Assistance Program (SNAP, formerly food stamps), to satisfy Medicaid eligibility requirements; and creat- ing a centralized electronic document man- agement system to facilitate the sharing of information across programs and agencies. Strategies to Reach the Remaining Uninsured While Massachusetts enjoys the lowest uninsur- ance rate in the country, there is an ongoing effort in the state to bring the remaining uninsured into coverage. Those who remain without coverage in Massachusetts are often young, male, single, and without children, with many reporting low family incomes that would likely make them eligible for public coverage (Long, Stockley, and Dahlen 2012b). These are often population groups that are hard to reach and can be difficult to persuade to obtain coverage. Massachusetts has invested considerable resources into reaching hard-to-cover popula- tions, including a statewide outreach and enrollment effort, with the Medicaid program as the lead for coordinating public and private initiatives (Raymond 2011; Stoll 2012). During the first four years of reform, the state provided grants totaling $11.5 million to support outreach and enrollment assistance by nonprofit organizations. In addition, since 2006, the Blue Cross Blue Shield of Massa- chusetts Foundation has awarded $3 million in community grants for outreach and enroll- ment. Also, the Commonwealth Health Insur- ance Connector Authority, Massachusetts’
  • 49. exchange, implemented an extensive ($7 million) marketing campaign, which included paid advertising and in-kind contributions from a range of business and nonprofit par- tners, and extensive outreach at community events. Prognosis for the Nation Massachusetts has achieved its goal of near universal health insurance coverage and im- proved access to care under its 2006 health reform initiative. The evidence from a range of studies shows strong gains in insurance cover- age, improvements in access to and use of health care, and reductions in the burden of health care costs for Massachusetts residents. There is also some evidence that those gains have translated into improvements in health status among the state’s residents (Long, Stockley, and Dahlen 2012b; Courtemanche and Zapata 2012), which is consistent with the evidence of improved self- reported health status under the Oregon Health Insurance Experiment (Finkelstein et al. 2012) and reductions in mortality under earlier Med- icaid expansions (Sommers, Baicker, and Ep- stein 2012). Overall, the findings for Massachusetts suggest considerable optimism for the poten- tial impacts of national reform for states that move forward with the Medicaid expansion under the ACA. While states have very different starting points and very different political and economic environments, the
  • 50. potential for gains in health care access and health, along with improvements in financial protections from expanded insurance cover- age for states’ residents, is substantial. How- ever, achieving those gains will involve difficult trade-offs and challenges for the states—including many that Massachusetts has faced, as well as new challenges reflecting the more contentious atmosphere around national reform and the more constrained economic environment facing the country. Notes 1 For a summary of the ACA, see www.kff.org/ healthreform/8061.cfm. For a crosswalk be- tween the ACA and the 2006 Massachusetts legislation, see Seifert and Cohen (2011). 2 Data from the U.S. Department of Labor, Bureau of Labor Statistics, Current Popula- tion Survey. Available at: http://data.bls.gov/ timeseries/LNS14000000. Coverage, Access, and Affordability 313 3 Data from the U.S. Census Bureau, Current Population Survey, Annual Social and Eco- nomic Supplements. Table HI06. Health Insur- ance Coverage Status by State for All People: 2010 Available at: http://www.census.gov/hhes/ www/cpstables/032011/health/toc.htm.
  • 51. 4 Data from U.S. Department of Labor, Bureau of Labor Statistics, Local Area Unemploy- ment Statistics. Available at: http://www.bls. gov/lau/lastrk06.htm. 5 Data from the U.S. Census Bureau, Current Population Survey, Annual Social and Economic Supplements. Table HIA-4: Health Insurance Coverage Status and Type of Coverage by State—All People: 1999 to 2009. Available at: http://www.census.gov/hhes/www/hlthins/data/ historical/. 6 Additional information on the survey is available at: http://www.urban.org/publications/411649.html. 7 The fall 2006 survey was fielded as the Commonwealth Care program was beginning for adults with family income under 100% of the FPL. Enrollment in the program began in October 2006, with about 18,000 enrolled by the end of the year (Massachusetts Division of Health Care Finance and Policy 2011). 8 Response rates for telephone surveys are declining nationally (Curtin, Presser, and Sing- er 2005). However, the response rate is just one element to consider in assessing the reliability of survey estimates as lower response rates are not in and of themselves an indicator of survey quality (Groves 2006). Of relevance to this study, estimates of the uninsurance rate for nonelderly adults in 2010 were quite similar for the MHRS (5.8%) and national surveys with higher response rates: the American Commu-
  • 52. nity Survey (6.2%), and the National Health Interview Survey (5.4%). 9 The analysis sample is limited to observations with complete data for the regression models. In general, there was little item nonresponse in the survey; however, between 4% and 6% of the sample did not provide any information on family income and another 3% to 5% would only provide information on whether income was above or below 300% of the FPL in each year. We used hotdeck procedures to impute values for the missing income data and to address an error in the income question in 2010 (Long, Stockley, and Dahlen 2012b). 10 We use the Massachusetts Executive Office of Health and Human Services (EOHSS) regions: Boston, Metro West, Northeast, Central, West, and Southeast. 11 The ACA establishes an eligibility standard of family income up to 133% of FPL for Medicaid for nonelderly adults, with a 5% income disregard. 12 These estimates are for adults 18 to 64 years old, whereas the MHRS provides estimates for adults 19 to 64 years old. 13 By quasi-experimental design, we mean meth- ods that are designed to approximate a ran- domized experiment, where outcomes of the treatment group are compared to a suitable control group. Common examples of these designs include difference-in-differences and
  • 53. instrumental variables models. Because all MHRS respondents were affected by the reform, there is no available comparison group in the MHRS. This lack of a comparison group limits the analysis using these data to a pre/post design, which is vulnerable to the influence of confounding changes over the same time period. However, as noted earlier, the MHRS has the advantages of a large sample size for Massachusetts and a larger set of outcome measures than is available in national surveys. 14 These are emergency department visits that the respondent thought could have been treated by a regular doctor if one had been available. 15 For example, Massachusetts received a $4.5 million grant from the Centers for Medicare and Medicaid Services to support an emer- gency department diversion program over this period (Eccleston 2011). In addition, emergen- cy department copayment levels for many private insurance plans increased during this time period, which may also have impacted emergency department use. 16 Several other studies have used BRFSS data in pre/post models of the impacts of health reform on access to care, including work by Clark et al. (2011) that found mixed evidence on changes in preventive care use and reductions in unmet need due to costs, and Tinsley et al. (2010) that found gains in the shares of the population with a personal health care provider and with a routine checkup in the past year.
  • 54. References Blumberg, S. J., and J. V. Luke. 2011. Wireless Substitution: Early Release of Estimates from the National Health Interview Survey, July– December 2010. Hyattsville, Md.: National Center for Health Statistics. http://www.cdc. gov/nchs/data/nhis/earlyrelease/wireless201112. pdf. Accessed September 2, 2012. Chernew, M. E., R. E. Mechanic, B. E. Landon, and D. G. Safran. 2011. Private-Payer Inno- vation in Massachusetts: The ‘‘Alternative Quality Contract.’’ Health Affairs 30(1):51–61. Clark, C. R., J. Soukup, U. Govindarajulu, H. E. Rinden, D. A. Tovar, and P. A. Johnson. 2011. Lack of Access Due to Costs Remains a Inquiry/Volume 49, Winter 2012/2013 314 Problem for Some in Massachusetts Despite the State’s Health Reform. Health Affairs 30(2):247–255. Cohen, R. A., B. W. Ward, and J. S. Schiller. 2011. Health Insurance Coverage: Early Re- lease of Estimates from the National Health Interview Survey, 2010. Hyattsville, Md.: National Center for Health Statistics. http:// www.cdc.gov/nchs/data/nhis/earlyrelease/insur 201106.pdf. Accessed September 2, 2012.
  • 55. Courtemanche, C., and D. Zapata. 2012. Does Universal Coverage Improve Health? The Massachusetts Experience. National Bureau of Economic Research (NBER) working paper 17893. http://www.nber.org/papers/w17893. Ac- cessed September 2, 2012. Cuckler, G., A. Martin, L. Whittle, S. Heffler, A. Sisko, D. Lassman, and J. Benson. 2011. Health Spending by State of Residence, 1991–2009. Medicare & Medicaid Research Review 1(4):E1–E30. Curtin, R., S. Presser, and E. Singer. 2005. Changes in Telephone Survey Nonresponse over the Past Quarter Century. Public Opinion Quarterly 69(1):87–98. Dorn, S., I. Hill, and S. Hogan. 2009. The Secrets of Massachusetts’ Success: Why 97 Percent of State Residents Have Health Coverage. Washington, D.C.: The Urban Institute. www.urban.org/ publications/411987.html. Accessed September 2, 2012. Eccleston, S. 2011. Challenges in Coordination of Health Care Services. Boston: Massachusetts Division of Health Care Finance and Policy. http://www.mass.gov/eohhs/docs/dhcfp/cost-trend- docs/cost-trends-docs-2011/eccleston-stacey-june- 30.pdf. Accessed September 2, 2012. Finkelstein, A., S. Taubman, B. Wright, M. Bern- stein, J. Gruber, J. Newhouse, H. Allen, K. Baiker, and the Oregon Health Study Group. 2012. The Oregon Health Insurance Experiment: Evidence from the First Year. Quarterly Journal
  • 56. of Economics 127(3):1057–1106. Gabel, J. R., H. Whitmore, J. Pickreign, W. Sellheim, K. C. Shova, and V. Bassett. 2008. After the Mandates: Massachusetts Employers Continue to Support Health Reform as More Firms Offer Coverage. Health Affairs 27(6):w566–w575. Gosline, A., and E. Rodman. 2012. Summary of Chapter 224 of the Acts of 2012. Boston: Blue Cross Blue Shield of Massachusetts Founda- tion. http://bluecrossmafoundation.org/Policy- and-Research/Reports-By-Topic/Health-Care- Costs-and-Affordability/,/media/Files/Publications/ Policy%20Publications/Chapter%20224%20summary. pdf. Accessed October 4, 2012. Groves, R. M. 2006. Nonresponse Rates and Nonresponse Bias in Household Surveys. Public Opinion Quarterly 70(4):646–675. Kaiser Family Foundation (KFF). 2010. Summary of New Health Reform Law. Publication #8061. Menlo Park, Calif.: Kaiser Family Foundation. http://www.kff.org/healthreform/ 8061.cfm. Accessed September 2, 2012. ———. 2012. Public Still Divided on ACA: Favorable Views Tick Up This Month. Menlo Park, Calif.: Kaiser Family Foundation. http:// facts.kff.org/chart.aspx?ch51456. Accessed October 4, 2012. Long, S. K. 2009. The Massachusetts Health Reform Survey. Washington, D.C.: The Urban Institute. http://www.urban.org/publications/
  • 57. 411649.html. Accessed September 4, 2012. Long, S. K., and K. Stockley. 2011. The Impacts of State Health Reform Initiatives on Adults in New York and Massachusetts. Health Services Research 46(1):365–387. Long, S. K., K. Stockley, and H. Dahlen. 2012a. Massachusetts Health Reforms: Uninsurance Remains Low, Self-Reported Health Status Improves as State Prepares to Tackle Costs. Health Affairs 31(2):444–451. ———. 2012b. Massachusetts Health Reform Report January 2012. Boston: Blue Cross Blue Shield of Massachusetts Foundation. http:// bluecrossmafoundation.org/Policy-and-Research/ Reports-By-Topic/Massachusetts-Health-Reform/ ,/media/Files/Publications/Policy%20Publications/ MHRS%20Report%20Jan2012.pdf. Accessed September 2, 2012. Long, S. K., K. Stockley, and A. Yemane. 2009. Another Look at the Impacts of Health Reform in Massachusetts: Evidence Using New Data and a Stronger Model. American Economic Review 99(2):508–511. Massachusetts Attorney General’s Office. 2011. Report for Annual Public Hearing: Examination of Health Care Cost Trends and Cost Drivers Pursuant to G.L. c. 118G, 1 6K(b). Boston: Office of Attorney General Martha Coakley. http://www.mass.gov/ago/docs/healthcare/2011-hcctd- full.pdf. Accessed September 2, 2012.
  • 58. Massachusetts General Court. 2012. Chapter 224: An Act Improving the Quality of Health Care and Reducing Costs Through Increased Trans- parency, Efficiency and Innovation. Boston: The 187th General Court of The Commonwealth of Massachusetts. http://www.malegislature.gov/ Laws/SessionLaws/Acts/2012/Chapter224. Accessed September 4, 2012. Massachusetts Division of Health Care Finance and Policy. 2012. Health Care Cost Trends. http://www.mass.gov/eohhs/researcher/physical- health/health-care-delivery/health-care-cost-trends. Accessed September 4, 2012. ———. 2011. Health Care in Massachusetts: Key Indicators, February 2011 Edition. Boston: Massachusetts Division of Health Care Fi- nance and Policy. http://www.mass.gov/eohhs/ docs/dhcfp/r/pubs/11/2011-key-indicators-february. pdf. Accessed September 2, 2012. Massachusetts Health Care Quality and Cost Council. 2009. Roadmap to Cost Containment: Massachusetts Health Care Quality and Cost Council Final Report. Boston: Massachusetts Coverage, Access, and Affordability 315 Health Care Quality and Cost Council. http:// www.mass.gov/hqcc/docs/roadmap-to-cost-containment- nov-2009.pdf. Accessed September 2, 2012.
  • 59. McDonough, J. E., B. Rosman, F. Phelps, and M. Shannon. 2006. The Third Wave of Massa- chusetts Health Care Access Reform. Health Affairs 25(6):w420–w431. Miller, S. 2012. The Effect of Insurance on Emergency Room Visits: An Analysis of the 2006 Massachusetts Health Reform. Journal of Public Economics 96(11–12):893–908. Pande, A., D. Ross-Degnan, A. Zaslavsky, and J. Salomon. 2011. Effects of Healthcare Reforms on Coverage, Access, and Disparities: Quasi-Experi- mental Analysis of Evidence from Massachusetts. American Journal of Preventive Medicine 41(1):1–8. Raymond, A. G. 2011. Massachusetts Health Reform: A Five-Year Progress Report. Bos- ton: Blue Cross Blue Shield of Massachusetts Foundation. https://www.mahealthconnector. org/portal/binary/com.epicentric.contentmanagement. servlet.ContentDeliveryServlet/Health%2520Care %2520Reform/Overview/BlueCrossFoundation 5YearRpt.pdf. Accessed September 2, 2012. ———. 2012. Business Community Participation in Health Reform: The Massachusetts Experience. Boston: Community Catalyst. http://www. communitycatalyst.org/doc_store/publications/ biz-community-health-reform_ma-experience.pdf. Accessed October 4, 2012. Seifert, R. W., and A. P. Cohen. 2011. Re-forming Reform: What the Patient Protection and Affordable Care Act Means for Massachusetts.
  • 60. Boston: Blue Cross Blue Shield of Massachu- setts Foundation. masshealthpolicyforum.brandeis. edu/forums/Documents/IssueBrief_ReportFINAL. pdf. Accessed September 2, 2012. Sommers, B. D., K. Baicker, and A. M. Epstein. 2012. Mortality and Access to Care among Adults after State Medicaid Expansions. New England Journal of Medicine Special Article July 25, 2012. 10.1056/NEJMsa1202099. http:// www.nejm.org/doi/full/10.1056/nejmsa1202099. Accessed Sept. 4, 2012. StataCorp. 2009. Stata Statistical Software: Re- lease 11. College Station, Texas: StataCorp LP. SteelFisher, G., R. Blendon, J. Mailhot, and S. E. Abiola. 2011. Public Perceptions of Health Care Costs in Massachusetts. Boston: Blue Cross Blue Shield of Massachusetts Foundation. http://bluecrossmafoundation.org/Policy-and-Research/ Reports-By-Topic/Health-Care-Costs-and-Affordability/ ,/media/Files/Health%20Reform/Health%20 Reform%2020%20Cost%20and%20Quality% 20Blendon%20Health%20Care%20Cost%20 Poll%20FINAL.pdf. Accessed September 2, 2012. Stoll, B. 2012. Effective Education, Outreach, and Enrollment Approaches for Populations New- ly Eligible for Health Coverage. Boston: Blue Cross Blue Shield of Massachusetts Founda- tion. Health Reform Toolkit Series. http:// www.rwjf.org/files/research/74070mass.pdf. Ac- cessed September 2, 2012.
  • 61. Supreme Court of the United States (SCOTUS). 2012. National Federation of Independent Business et al. v. Sebelius, Secretary of Health and Human Services, et al. 567 U.S., 2012 WL 2427810. Washington, D.C.: Supreme Court of the United States. www.supremecourt.gov/ opinions/11pdf/11-393c3a2.pdf. Accessed Sep- tember 2, 2012. Tinsley, L., B. Andrews, H. Hawk, and B. Cohen. 2010. Short-Term Effects of Health-Care Coverage Legislation—Massachusetts, 2008. Morbidity and Mortality Weekly Report 58(09):262–267. U.S. Bureau of Labor Statistics. 2012. Labor Force Statistics from the Current Population Survey. Washington, D.C.: U.S. Bureau of Labor Statistics. http://data.bls.gov/timeseries/ LNS14000000. Accessed September 4, 2012. ———. 2007. Unemployment Rates for States Annual Average Rankings Year: 2006. Wash- ington, D.C.: U.S. Bureau of Labor Statistics. http://www.bls.gov/lau/lastrk06.htm. Accessed September 4, 2012. U.S. Census Bureau. 2011. Table HI06: Health Insurance Coverage Status by State for All People: 2010. Current Population Survey, 2011 Annual Social and Economic Supplement. Washington, D.C.: U.S. Census Bureau. http:// www.census.gov/hhes/www/cpstables/032011/ health/toc.htm. Accessed September 4, 2012.
  • 62. ———. 2010. Table HIA-4: Health Insurance Coverage Status and Type of Coverage by State— All People: 1999 to 2009. Current Population Survey, 2011 Annual Social and Economic Supple- ment. Washington, D.C.: U.S. Census Bureau. http://www.census.gov/hhes/www/hlthins/data/ historical. Accessed September 4, 2012. Zhu, J., P. Brawarsky, S. Lipsitz, H. Huskamp, and J. S. Haas. 2010. Massachusetts Health Reform and Disparities in Coverage, Access and Health Status. Journal of General Internal Medicine 25(12):1356–1362. Inquiry/Volume 49, Winter 2012/2013 316 Copyright of Inquiry (00469580) is the property of Excellus Health Plan, Inc. and its content may not be copied or emailed to multiple sites or posted to a listserv without the copyright holder's express written permission. However, users may print, download, or email articles for individual use. T h e n e w e ngl a nd j o u r na l o f m e dic i n e n engl j med 368;18 nejm.org may 2, 2013 1713
  • 63. special article The Oregon Experiment — Effects of Medicaid on Clinical Outcomes Katherine Baicker, Ph.D., Sarah L. Taubman, Sc.D., Heidi L. Allen, Ph.D., Mira Bernstein, Ph.D., Jonathan H. Gruber, Ph.D., Joseph P. Newhouse, Ph.D., Eric C. Schneider, M.D., Bill J. Wright, Ph.D., Alan M. Zaslavsky, Ph.D., and Amy N. Finkelstein, Ph.D., for the Oregon Health Study Group* From the Department of Health Policy and Management, Harvard School of Public Health (K.B., J.P.N., E.C.S.), the Department of Health Care Policy, Harvard Medical School ( J.P.N., E.C.S., A.M.Z.), and RAND Corporation (E.C.S.) — all in Boston; the National Bureau of Econom- ic Research (K.B., S.L.T., M.B., J.H.G., J.P.N., A.N.F.), the Harvard Kennedy School ( J.P.N.), and the Department of Economics, Massachusetts Institute of Technology (J.H.G., A.N.F.) — all in Cambridge, MA; Columbia University School of Social Work, New York (H.L.A.); and the Center for Outcomes Research and Education, Providence Portland Medical Center, Portland, OR (B.J.W.). Address reprint requests to Dr. Baicker at the Department of Health Policy and Management, Harvard School of Public Health, 677 Huntington Ave., Boston, MA
  • 64. 02115, or at [email protected] * Members of the Oregon Health Study Group are listed in the Supplementary Appendix, available at NEJM.org. N Engl J Med 2013;368:1713-22. DOI: 10.1056/NEJMsa1212321 Copyright © 2013 Massachusetts Medical Society. A bs tr ac t Background Despite the imminent expansion of Medicaid coverage for low- income adults, the effects of expanding coverage are unclear. The 2008 Medicaid expansion in Oregon based on lottery drawings from a waiting list provided an opportunity to evaluate these effects. Methods Approximately 2 years after the lottery, we obtained data from 6387 adults who were randomly selected to be able to apply for Medicaid coverage and 5842 adults who were not selected. Measures included blood-pressure, cholesterol, and glycated hemo- globin levels; screening for depression; medication inventories; and self-reported diagnoses, health status, health care utilization, and out-of- pocket spending for such services. We used the random assignment in the lottery to calculate the effect of Medicaid coverage.
  • 65. Results We found no significant effect of Medicaid coverage on the prevalence or diagnosis of hypertension or high cholesterol levels or on the use of medication for these conditions. Medicaid coverage significantly increased the probability of a diagnosis of diabetes and the use of diabetes medication, but we observed no significant ef- fect on average glycated hemoglobin levels or on the percentage of participants with levels of 6.5% or higher. Medicaid coverage decreased the probability of a positive screening for depression (−9.15 percentage points; 95% confidence interval, −16.70 to −1.60; P = 0.02), increased the use of many preventive services, and nearly elimi- nated catastrophic out-of-pocket medical expenditures. Conclusions This randomized, controlled study showed that Medicaid coverage generated no sig- nificant improvements in measured physical health outcomes in the first 2 years, but it did increase use of health care services, raise rates of diabetes detection and management, lower rates of depression, and reduce financial strain. T h e n e w e ngl a nd j o u r na l o f m e dic i n e
  • 66. n engl j med 368;18 nejm.org may 2, 20131714 In 2008, Oregon initiated a limited ex-pansion of its Medicaid program for low- income adults through a lottery drawing of approximately 30,000 names from a waiting list of almost 90,000 persons. Selected adults won the opportunity to apply for Medicaid and to en- roll if they met eligibility requirements. This lot- tery presented an opportunity to study the effects of Medicaid with the use of random assignment. Earlier, nonrandomized studies sought to inves- tigate the effect of Medicaid on health outcomes in adults with the use of quasi-experimental ap- proaches.1-3 Although these approaches can be an improvement over observational designs and often involve larger samples than are feasible with a randomized design, they cannot eliminate con- founding factors as effectively as random assign- ment. We used the random assignment embedded in the Oregon Medicaid lottery to examine the effects of insurance coverage on health care use and health outcomes after approximately 2 years. Me thods Randomization and Intervention Oregon Health Plan Standard is a Medicaid pro- gram for low-income, uninsured, able-bodied adults who are not eligible for other public insur- ance in Oregon (e.g., Medicare for persons 65 years of age or older and for disabled persons; the Chil- dren’s Health Insurance Program for poor chil- dren; or Medicaid for poor children, pregnant women, or other specific, categorically eligible pop- ulations). Oregon Health Plan Standard closed to
  • 67. new enrollment in 2004, but the state opened a new waiting list in early 2008 and then conducted eight random lottery drawings from the list be- tween March and September of that year to allo- cate a limited number of spots. Persons who were selected won the opportu- nity — for themselves and any household mem- ber — to apply for Oregon Health Plan Standard. To be eligible, persons had to be 19 to 64 years of age and Oregon residents who were U.S. citi- zens or legal immigrants; they had to be ineli- gible for other public insurance and uninsured for the previous 6 months, with an income that was below 100% of the federal poverty level and assets of less than $2,000. Persons who were randomly selected in the lottery were sent an application. Those who completed it and met the eligibility criteria were enrolled in the plan. Oregon Health Plan Standard provides comprehensive medical benefits, including prescription drugs, with no patient cost-sharing and low monthly premiums ($0 to $20, based on income), mostly through managed-care organizations. The lottery process and Oregon Health Plan Standard are described in more detail elsewhere.4 Data Collection We used an in-person data-collection protocol to assess a wide variety of outcomes. We limited data collection to the Portland, Oregon, metro- politan area because of logistical constraints. Our study population included 20,745 people: 10,405 selected in the lottery (the lottery winners) and
  • 68. 10,340 not selected (the control group). We con- ducted interviews between September 2009 and December 2010. The interviews took place an av- erage of 25 months after the lottery began. Our data-collection protocol included detailed questionnaires on health care, health status, and insurance coverage; an inventory of medications; and performance of anthropometric and blood- pressure measurements. Dried blood spots were also obtained.5 Depression was assessed with the use of the eight-question version of the Patient Health Questionnaire (PHQ-8),6 and self-reported health-related quality of life was assessed with the use of the Medical Outcomes Study 8-Item Short-Form Survey.7 More information on recruit- ment and field-collection protocols are included in the study protocol (available with the full text of this article at NEJM.org); more information on specific outcome measures is provided in the Supplementary Appendix (available at NEJM.org). Multiple institutional review boards approved the study, and written informed consent was obtained from all participants. Statistical Analysis Virtually all the analyses reported here were pre- specified and publicly archived (see the proto- col).8 Prespecification was designed to minimize issues of data and specification mining and to provide a record of the full set of planned analy- ses. The results of a few additional post hoc anal- yses are also presented and are noted as such in Tables 1 through 5. Analyses were performed with the use of Stata software, version 12.9
  • 69. Adults randomly selected in the lottery were given the option to apply for Medicaid, but not all persons selected by the lottery enrolled in Effects of Medicaid on Clinical Outcomes n engl j med 368;18 nejm.org may 2, 2013 1715 Medicaid (either because they did not apply or because they were deemed ineligible). Lottery se- lection increased the probability of Medicaid cover- age during our study period by 24.1 percentage points (95% confidence interval [CI], 22.3 to 25.9; P<0.001). The subgroup of lottery winners who ultimately enrolled in Medicaid was not compa- rable to the overall group of persons who did not win the lottery. We therefore used a standard instrumental-variable approach (in which lottery selection was the instrument for Medicaid cover- age) to estimate the causal effect of enrollment in Medicaid. Intuitively, since the lottery increased the chance of being enrolled in Medicaid by about 25 percentage points, and we assumed that the lottery affected outcomes only by changing Med- icaid enrollment, the effect of being enrolled in Medicaid was simply about 4 times (i.e., 1 divided by 0.25) as high as the effect of being able to apply for Medicaid. This yielded a causal estimate of the effect of insurance coverage.10 (See the Supplementary Appendix for additional details.) All analyses were adjusted for the number of household members on the lottery list because
  • 70. selection was random, conditional on household size. Standard errors were clustered according to household to account for intrahousehold correla- tion. We fitted linear probability models for bi- nary outcomes. As sensitivity checks, we showed that our results were robust when the average mar- ginal effects from logistic regressions for binary outcomes were estimated and when demographic characteristics were included as covariates (see the Supplementary Appendix). All analyses were weighted for the sampling and field-collection design; construction of the weights is detailed in the Supplementary Appendix. R esult s Study Population Characteristics of the respondents are shown in Table 1. A total of 12,229 persons in the study sample responded to the survey, for an effective response rate of 73%. There were no significant differences between those selected in the lottery and those not selected with respect to the response rates to either the full survey (0.28 percentage points higher in the group selected in the lottery, P = 0.86) or specific survey measures, each of which had a response rate of at least 97% among people who completed any part of the survey. Just over half the participants were women, about a quar- ter were 50 to 64 years of age (the oldest eligible age group), and about 70% were non-Hispanic white. There were no significant differences be- tween those selected in the lottery and those not selected with respect to these characteristics (F
  • 71. statistic, 0.20; P = 0.99) or to the wide variety of prerandomization and interview characteristics examined (see the Supplementary Appendix). Clinical Measures and Health Outcomes Table 2 shows estimated effects of Medicaid cov- erage on blood-pressure, total and high-density lipoprotein (HDL) cholesterol, and glycated he- moglobin levels and depression. In the control group, 30% of the survey respondents had positive screening results for depression, and we detected elevated blood pressure in 16%, a high total cho- lesterol level in 14%, and a glycated hemoglobin level of 6.5% or more (a diagnostic criterion for Table 1. Characteristics of the 12,229 Survey Respondents.* Characteristic Controls (N = 5842) Lottery Winners (N = 6387)† P Value percent Female sex 56.9 56.4 0.60 Age group‡ 19–34 yr 36.0 35.1 0.38
  • 72. 35–49 yr 36.4 36.6 0.87 50–64 yr 27.6 28.3 0.43 Race or ethnic group§ Non-Hispanic White 68.8 69.2 0.68 Black 10.5 10.6 0.82 Other 14.8 14.8 0.97 Hispanic 17.2 17.0 0.82 Interview conducted in English 88.2 88.5 0.74 * Values for the control group (persons not selected in the lottery) are weighted means, and values for the lottery-winner group are regression- adjusted weighted means. P values are for two-tailed t-tests of the equality of the two means. † Lottery winners were adults who were randomly selected in the lottery to be able to apply for Medicaid coverage. ‡ The data on age are for the age of the respondent at the time of the in-person interview. The study sample was restricted to persons who were between 19 and 64 years of age during the study period.
  • 73. § Race and ethnic group were self-reported. The categories of non-Hispanic race (white, black, and other) were not mutually exclusive; respondents could report as many races or ethnic groups as they wished. T h e n e w e ngl a nd j o u r na l o f m e dic i n e n engl j med 368;18 nejm.org may 2, 20131716 diabetes) in 5%. Medicaid coverage did not have a significant effect on measures of blood pres- sure, cholesterol, or glycated hemoglobin. Fur- ther analyses involving two prespecified sub- groups — persons 50 to 64 years of age and those who reported receiving a diagnosis of dia- betes, hypertension, a high cholesterol level, a heart attack, or congestive heart failure before the lottery (all of which were balanced across the two study groups) — showed similar results (see the Supplementary Appendix). The predicted 10-year risk of cardiovascular events was measured with the use of the Fram- ingham risk score, which estimates risk among persons older than 30 years of age according to sex, age, levels of total cholesterol and HDL cho- lesterol, blood pressure and use or nonuse of blood-pressure medication, status with respect to diabetes, and smoking status, with the pre- dicted risk of a cardiovascular event within 10 years ranging from less than 1% to 30%.11 The 10-year predicted risk did not change significantly
  • 74. with Medicaid coverage (−0.21 percentage points; 95% CI, −1.56 to 1.15; P = 0.76). We investigated whether Medicaid coverage af- fected the diagnosis of and use of medication for hypertension, hypercholesterolemia, or diabetes. Table 2 shows diagnoses after the lottery and current medication use. We found no effect of Medicaid coverage on diagnoses after the lottery or on the use of medication for blood-pressure and high cholesterol levels. We did, however, find a greater probability of receiving a diagnosis of diabetes (3.83 percentage points; 95% CI, 1.93 to 5.73; P<0.001) and using medications for diabe- tes (5.43 percentage points; 95% CI, 1.39 to 9.48; P = 0.008). These are substantial increases from the mean rates of diagnosis and medication use in the control group (1.1% and 6.4%, respectively). A positive result on screening for depression was defined as a score of 10 or more on the PHQ-8 (which ranges from 0 to 24, with higher Table 2. Mean Values and Absolute Change in Clinical Measures and Health Outcomes with Medicaid Coverage.* Variable Mean Value in Control Group Change with Medicaid Coverage (95% CI)† P Value Blood pressure Systolic (mm Hg) 119.3±16.9 −0.52 (−2.97 to 1.93) 0.68
  • 75. Diastolic (mm Hg) 76.0±12.1 −0.81 (−2.65 to 1.04) 0.39 Elevated (%)‡ 16.3 −1.33 (−7.16 to 4.49) 0.65 Hypertension Diagnosis after lottery (%)§¶ 5.6 1.76 (−1.89 to 5.40) 0.34 Current use of medication for hypertension (%)§‖ 13.9 0.66 (−4.48 to 5.80) 0.80 Cholesterol** Total level (mg/dl) 204.1±34.0 2.20 (−3.44 to 7.84) 0.45 High total level (%) 14.1 −2.43 (−7.75 to 2.89) 0.37 HDL level (mg/dl) 47.6±13.1 0.83 (−1.31 to 2.98) 0.45 Low HDL level (%) 28.0 −2.82 (−10.28 to 4.64) 0.46 Hypercholesterolemia Diagnosis after lottery (%)§¶ 6.1 2.39 (−1.52 to 6.29) 0.23 Current use of medication for high cholesterol level (%)§‖ 8.5 3.80 (−0.75 to 8.35) 0.10 Glycated hemoglobin Level (%) 5.3±0.6 0.01 (−0.09 to 0.11) 0.82 Level ≥6.5% (%)†† 5.1 −0.93 (−4.44 to 2.59) 0.61 Diabetes
  • 76. Diagnosis after lottery (%)§¶ 1.1 3.83 (1.93 to 5.73) <0.001 Current use of medication for diabetes (%)§‖ 6.4 5.43 (1.39 to 9.48) 0.008 Effects of Medicaid on Clinical Outcomes n engl j med 368;18 nejm.org may 2, 2013 1717 scores indicating more symptoms of depression). Medicaid coverage resulted in an absolute de- crease in the rate of depression of 9.15 percentage points (95% CI, −16.7 to −1.60; P = 0.02), repre- senting a relative reduction of 30%. Although there was no significant increase in the use of medication for depression, Medicaid coverage led to an absolute increase in the probability of receiving a diagnosis of depression after the lot- tery of 3.81 percentage points (95% CI, 0.15 to 7.46; P = 0.04), representing a relative increase of about 80%. Health-Related Quality of Life and Happiness Table 3 shows the effects of Medicaid coverage on health-related quality of life and level of hap- piness. Medicaid coverage led to an increase in the proportion of people who reported that their health was the same or better as compared with their health 1 year previously (7.84 percentage points; 95% CI, 1.45 to 14.23; P = 0.02). The phys- ical-component and mental-component scores of the health-related quality of life measure are
  • 77. based on different weighted combinations of the eight-question battery; each ranges from 0 to 100, Table 2. (Continued.) Variable Mean Value in Control Group Change with Medicaid Coverage (95% CI)† P Value Depression Positive screening result (%)‡‡ 30.0 −9.15 (−16.70 to −1.60) 0.02 Diagnosis after lottery (%)§¶ 4.8 3.81 (0.15 to 7.46) 0.04 Current use of medication for depression (%)§‖ 16.8 5.49 (−0.46 to 11.45) 0.07 Framingham risk score (%)§§ Overall 8.2±7.5 −0.21 (−1.56 to 1.15) 0.76 High-risk diagnosis 11.6±8.3 1.63 (−1.11 to 4.37) 0.24 Age of 50–64 yr 13.9±8.2 −0.37 (−2.64 to 1.90) 0.75 * Plus–minus values are weighted means ±SD. Where means are shown without standard deviations, they are weighted means. The effect of Medicaid coverage was estimated with the use of two-stage least-squares instrumental-variable regression. All regressions include indicators for the number of household members on the lottery list, and all standard
  • 78. errors were “clustered,” or adjusted to allow for arbitrary correction of error terms within households. For the blood- pressure measures, all regressions also included controls for age (with dummies for age decile) and sex. All analyses were weighted with the use of survey weights. The sample size was all 12,229 survey respondents for all measures ex- cept for the Framingham risk score. HDL denotes high-density lipoprotein. † For variables measured as percentages, the change is expressed as percentage points. ‡ Elevated blood pressure was defined as a systolic pressure of 140 mm Hg or more and a diastolic pressure of 90 mm Hg or more. § This analysis was not prespecified. ¶ A participant was considered to have received a diagnosis of a certain condition after the lottery if he or she reported a first diagnosis after March 2008 (the start of the lottery). A participant who received a diagnosis before March 2008 was not considered to have a diagnosis after the lottery. ‖ A participant was considered to have received medication for the condition if one or more of the medications recorded during the interview was classified as relevant for that condition. ** A high total cholesterol level was defined as 240 mg per deciliter (6.2 mmol per liter) or higher. A low HDL cholester- ol level was defined as less than 40 mg per deciliter (1.03 mmol per liter). There was no separate measurement of low- density lipoprotein cholesterol. †† A glycated hemoglobin level of 6.5% or higher is a diagnostic criterion for diabetes.
  • 79. ‡‡ A positive result on screening for depression was defined as a score of 10 or higher on the Patient Health Questionnaire 8 (PHQ-8). Scores on the PHQ-8 range from 0 to 24, with higher scores indicating more symptoms of depression. §§ The Framingham risk score was used to predict the 10-year cardiovascular risk. Risk scores were calculated separately for men and women on the basis of the following variables: age, total cholesterol and HDL cholesterol levels, mea- sured blood pressure and use or nonuse of medication for high blood pressure, current smoking status, and status with respect to a glycated hemoglobin level ≥6.5%. Framingham risk scores, which are calculated for persons 30 years of age or older, range from 0.99 to 30%. Samples sizes for risk scores were 9525 participants overall, 3099 par- ticipants with high-risk diagnoses, and 3372 participants with an age of 50 to 64 years. A high-risk diagnosis was de- fined as a diagnosis of diabetes, hypertension, hypercholesterolemia, myocardial infarction, or congestive heart failure before the lottery (i.e., before March 2008). T h e n e w e ngl a nd j o u r na l o f m e dic i n e n engl j med 368;18 nejm.org may 2, 20131718 with higher scores corresponding to better health- related quality of life. Medicaid coverage led to an increase of 1.95 points (95% CI, 0.03 to 3.88; P = 0.05) in the average score on the mental com- ponent; the magnitude of improvement was ap- proximately one fifth of the standard deviation of the mental-component score. We did not de-
  • 80. tect a significant difference in the quality of life related to physical health or in self-reported lev- els of pain or happiness. Financial Hardship Table 4 shows that Medicaid coverage led to a reduction in financial strain from medical costs, according to a number of self-reported measures. In particular, catastrophic expenditures, defined as out-of-pocket medical expenses exceeding 30% of income, were nearly eliminated. These ex- penditures decreased by 4.48 percentage points (95% CI, −8.26 to −0.69; P = 0.02), a relative re- duction of more than 80%. Additional Outcomes Table 5 shows the effects of Medicaid coverage on health care utilization, spending on health care, preventive care, access to and quality of care, smoking status, and obesity. Medicaid coverage resulted in an increase in the number of prescrip- tion drugs received and office visits made in the previous year; we did not find significant chang- es in visits to the emergency department or hos- pital admissions. We estimated that Medicaid cov- erage increased annual medical spending (based on measured use of prescription drugs, office visits, visits to the emergency department, and hospital admissions) by $1,172, or about 35% rela- tive to the spending in the control group. Medic- aid coverage also led to increases in some pre- ventive care and screening services, including cholesterol screening (an increase of 14.57 per-
  • 81. centage points; 95% CI, 7.09 to 22.04; P<0.001) and improved perceived access to care, including a usual place of care (an increase of 23.75 per- centage points; 95% CI, 15.44 to 32.06; P<0.001). We found no significant effect of Medicaid cover- age on the probability that a person was a smok- er or obese. Discussion This study was based on more than 12,000 in- person interviews conducted approximately 2 years after a lottery that randomly assigned access to Medicaid for low-income, able-bodied, uninsured adults — a group that comprises the majority of persons who are newly eligible for Medicaid un- der the 2014 expansion.12 The results confirm that Medicaid coverage increased overall health care utilization, improved self-reported health, and re- duced financial strain; these findings are consis- tent with previously published results based on mail surveys conducted approximately 1 year af- Table 3. Mean Values and Absolute Change in Health-Related Quality of Life and Happiness with Medicaid Coverage.* Variable Mean Value in Control Group Change with Medicaid Coverage (95% CI)† P Value Health-related quality of life Health same or better vs. 1 yr earlier (%) 80.4 7.84 (1.45 to