
Recommended
More Related Content
Similar to Intermediate Algebra Question #1 30 pointsGiven the points .docx
Similar to Intermediate Algebra Question #1 30 pointsGiven the points .docx (20)
More from mariuse18nolet
More from mariuse18nolet (20)
Recently uploaded
Recently uploaded (20)
Intermediate Algebra Question #1 30 pointsGiven the points .docx
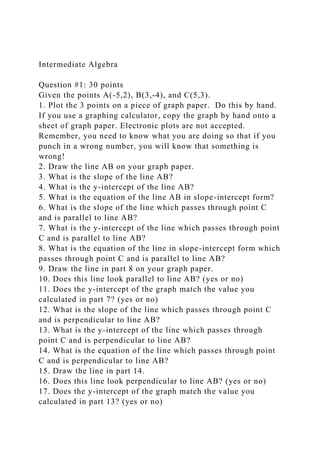
- 1. Intermediate Algebra Question #1: 30 points Given the points A(-5,2), B(3,-4), and C(5,3). 1. Plot the 3 points on a piece of graph paper. Do this by hand. If you use a graphing calculator, copy the graph by hand onto a sheet of graph paper. Electronic plots are not accepted. Remember, you need to know what you are doing so that if you punch in a wrong number, you will know that something is wrong! 2. Draw the line AB on your graph paper. 3. What is the slope of the line AB? 4. What is the y-intercept of the line AB? 5. What is the equation of the line AB in slope-intercept form? 6. What is the slope of the line which passes through point C and is parallel to line AB? 7. What is the y-intercept of the line which passes through point C and is parallel to line AB? 8. What is the equation of the line in slope-intercept form which passes through point C and is parallel to line AB? 9. Draw the line in part 8 on your graph paper. 10. Does this line look parallel to line AB? (yes or no) 11. Does the y-intercept of the graph match the value you calculated in part 7? (yes or no) 12. What is the slope of the line which passes through point C and is perpendicular to line AB? 13. What is the y-intercept of the line which passes through point C and is perpendicular to line AB? 14. What is the equation of the line which passes through point C and is perpendicular to line AB? 15. Draw the line in part 14. 16. Does this line look perpendicular to line AB? (yes or no) 17. Does the y-intercept of the graph match the value you calculated in part 13? (yes or no)
- 2. Question #2: 10 points Let the equation of a line in general form (Ax + By = C) be : 3x + 5y = 15. 1. Re-write the equation so that it is in slope-intercept form (p.102 of the book). 2. Re-write the equation so that it is in point-slope form (p.107 of the book). Clearly show how you got the ordered pair (x1,y1) to put in your equation. Question #3: 15 points Let 5x + 15 > 15. Let -2x +6 >= 12. 1. Solve the first inequality for x. 2. Write your answer in interval notation. 3. Plot your first answer on a graph. 4. Solve the second inequality for x. 5. Write your answer in interval notation. 6. Plot your second answer on a graph. 7. Write your combined answer in interval notation for the OR solution for x (p124 of book). 8. Write your combined answer in interval notation for the AND solution for x (p125 of book). Question #4: 20 points Altimeter data from NASA satellites have been measuring sea level relative to the center of the earth since 1992. In 1993, the average global sea level height was -12 mm on an arbitrary scale. In 2014, the average global sea level height was +55 mm on the same scale. Let x equal the number of years after 1993. 1. Write two ordered pairs to represent the information given above. 2. Find the slope of the line which passes through these two points. 3. Write the equation of the line in point-slope form. 4. Write the equation of the line in slope-intercept form.
- 3. 5. Draw the line on a graph, clearly showing the units of the x and y axes. Make sure that x is long enough to include the year 2093. 6. Based on this equation, what will be the average global sea level height in 2093 on NASA’s arbitrary scale? 7. Does this answer match what you would get from your graph in part 5? 8. Explain what the slope means in the context of this problem. 9. According to this equation, what will be the total rise in global sea level height from 1993 to 2093 in mm? 10. Change your answer from mm to inches. (10 mm = 1 cm, 2.54 cm = 1 in) 11. Is this amount of sea level rise anything to worry about? If you live on a mountain? If you live on an island where the average land height is only 3 ft above sea level? If you live near the coastline with a relatively flat beach? If you live in a place where people who will be likely to move to when they get flooded out? (Note: This is an example of extrapolation of the data as opposed to interpolation of the data. Use of extrapolation, especially long term extrapolation, has been known to give very erroneous predictions!) Question #5: 15 points Given the following graphs. Write the solution for x in interval notation. 1. =====================)-------------------------- -inf 10 2. <---------------[=====================)----------------- ------[====================== -5 0 7 +inf 3. -------------------------
- 4. [============================= 3 +inf 4. ------------------------------------ [============================= 4 +inf AND ---------------(==============================)---------- ------- -2 8 5. ------------------------------------ [======================================= 7 +inf OR ========================================)---- --------------------------------- -inf 11 Question #6: 10 points Given the graphs of the 2 lines shown below. 1. Write the equation of line A in slope-intercept form. 2. Write the equation of line B in point-slope form. Intermediate Algebra Question #1:
- 5. 30 points Given the points A( - 5,2), B( 3, - 4), and C(5,3). 1. Plot the 3 points o n a piece of graph paper. Do this by hand. If you use a graphing calculator, copy the graph by hand onto a sheet of graph paper. Electronic plots are not accepted. Remember, you need to know what you are doing so that if you punch in a wrong number, you w ill know that something is wrong! 2. Draw the line AB on your graph paper. 3. What is the slope of the line AB? 4. What is the y - intercept of the line AB?
- 6. 5. What is the equation of the line AB in slope - intercept form? 6. What is the slope of the line which passes throug h point C and is parallel to line AB? 7. What is the y - intercept of the line which passes through point C and is parallel to line AB? 8. What is the equation of the line in slope - intercept form which passes through point C and is parallel to line AB? 9. Draw the li ne in part 8 on your graph paper.
- 7. 10. Does this line look parallel to line AB? (yes or no) 11. Does the y - intercept of the graph match the value you calculated in part 7? (yes or no) 12. What is the slope of the line which passes through point C and is perpendicular t o line AB? 13. What is the y - intercept of the line which passes through point C and is perpendicular to line AB? 14. What is the equation of the line which passes through point C and is perpendicular to line AB? 15. Draw the line in part 1 4 .
- 8. 16. Does this line look perpen dicular to line AB? (yes or no) 17. Does the y - intercept of the graph match the value you calculated in part 13? (yes or no) Intermediate Algebra Question #1: 30 points Given the points A(-5,2), B(3,-4), and C(5,3). 1. Plot the 3 points on a piece of graph paper. Do this by hand. If you use a graphing calculator, copy the graph by hand onto a sheet of graph paper. Electronic plots are not accepted. Remember, you need to know what you are doing so that if you punch in a wrong number, you will know that something is wrong! 2. Draw the line AB on your graph paper. 3. What is the slope of the line AB? 4. What is the y-intercept of the line AB? 5. What is the equation of the line AB in slope-intercept form? 6. What is the slope of the line which passes through point C and is parallel to line AB? 7. What is the y-intercept of the line which passes through point C and is parallel to line AB? 8. What is the equation of the line in slope-intercept form which passes through point C and is parallel to line AB?
- 9. 9. Draw the line in part 8 on your graph paper. 10. Does this line look parallel to line AB? (yes or no) 11. Does the y-intercept of the graph match the value you calculated in part 7? (yes or no) 12. What is the slope of the line which passes through point C and is perpendicular to line AB? 13. What is the y-intercept of the line which passes through point C and is perpendicular to line AB? 14. What is the equation of the line which passes through point C and is perpendicular to line AB? 15. Draw the line in part 14. 16. Does this line look perpendicular to line AB? (yes or no) 17. Does the y-intercept of the graph match the value you calculated in part 13? (yes or no)