Optimize wastewater strategies with Operwas tool
•
0 likes•40 views

The Operwas tool allows users to optimize wastewater system configurations and costs through geographic analysis and modeling. It calculates costs of collection, treatment, reuse networks and benefits. Users input location data, costs and reuse options. The tool then delineates catchments, models pipeline networks and treatment plants, estimates flows, costs and reuse. It compares centralized and decentralized scenarios based on coverage, costs, energy use and environmental impacts to support strategic wastewater planning. The open source tool is freely available and was created through collaboration between researchers to benefit wastewater planning.

Recommended
Recommended
More Related Content
What's hot
What's hot (20)
Similar to Optimize wastewater strategies with Operwas tool
Similar to Optimize wastewater strategies with Operwas tool (20)
Recently uploaded
Recently uploaded (20)
Optimize wastewater strategies with Operwas tool
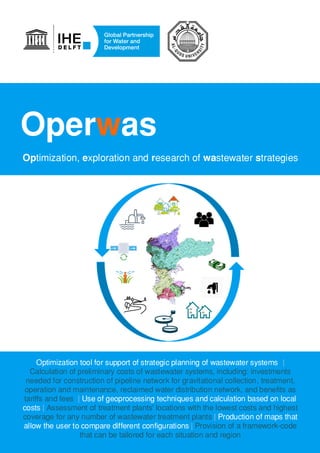
- 1. Operwas Optimization, exploration and research of wastewater strategies Optimization tool for support of strategic planning of wastewater systems | Calculation of preliminary costs of wastewater systems, including: investments needed for construction of pipeline network for gravitational collection, treatment, operation and maintenance, reclaimed water distribution network, and benefits as tariffs and fees | Use of geoprocessing techniques and calculation based on local costs | Assessment of treatment plants' locations with the lowest costs and highest coverage for any number of wastewater treatment plants | Production of maps that allow the user to compare different configurations | Provision of a framework-code that can be tailored for each situation and region
- 2. Strategic planning of wastewater treatment systems Possible uses DECENTRALISED + coverage of isolated places + resilience + flexibility + possibilities of reuse and resource recovery + ownership + complexity + higher investment costs CENTRALISED + economies of scale + known performance + localized operation + eutrophication + eutrophication in water bodies + high energy costs in networks + overflows (if combined sewers) Discussions regarding the optimal scale of a wastewater network are common in the scientific community and in decision making. Frequently, advantages and disadvantages of each approach are mentioned, but they can vary significantly according to local conditions, and an individual and local analysis is needed for better understanding of the available possibilities. The Operwas tool analyses includes: treatment plants (WWTP) investment, operation and maintenance costs, investment costs of pipeline for wastewater collection by gravity, reclaimed water distribution pipelines, reclaimed water reservoirs, land purchase costs, reclaimed water pumping costs, tariffs and fees of wastewater collection and selling of reclaimed water, energy savings, environmental savings and coverage of the study area. With this information, it supports finding answers to the following strategic questions: Cost/Benefits: How can one estimate different costs and combine them to analyze configurations of one or more WWTPs? Energy use: How much energy is consumed in the studied area for water supply, wastewater collection and treatment? Topography: How does the topography influence the energy prices and consumption in water supply and wastewater treatment? Appropriate technology: Which types of technologies would be recommended for each wastewater treatment plant (WWTP) considering its potential for effluent reuse? Reuse: Which areas in a catchment are more interesting for reuse of treated effluent, in terms of urban use (not potable) and agricultural (non edible plants)? Tool combines n WWTPs from list with n options List with n positions List with one combination’s costs, benefits and coverage List with n++ possible positions Tool checks many possible combinations, optimizing the search Chosen n WWTPs Data set Do I know where the WWTPs should be? InputdataProcessingthe data Outputs YES NO The tool can be applied in two ways: to evaluate costs of one combination of a number of WWTPs which positions are already known, or to analyze different combinations of a number of WWTPs build at locations selected from a long-list of possible positions. For the latter option the tool will generate an overview of costs and benefits for different levels of coverage. Both analyses can be done with the same input data set, changing on the dashboard only the list of available WWTPs positions and the number of evaluations. Maps with WWTP’s positions and catchments List with combinations’ costs, benefits and coverage (optimization curve)
- 3. How does Operwas work? User input information One WWTP is planned to serve each catchment A catchment delineation takes place through the analysis of the digital elevation model The length of the pipeline within each catchment is estimated as the sum of the natural water channels Georeferenced information of housing, land prices, population density, water prices and tariffs is constructed for each catchment Possibilities for reuse of the wastewater around the WWTP is analysed and based on those possibilities (urban reuse or agricultural reuse) , the most appropriate technology is decided , considering the effluent quality standards for each reuse Reclaimed wastewater flows are calculated according to the treated flows At each run of the tool, total costs and benefits (tariffs) are accounted for a time horizon given by the user Operwas can be adjusted to fit any situation. The adjustment of parameters to be used in the calculations requires the following input variables: Geographically distributed data Digital elevation model | Channel delineation | Population distribution| Possible positions of WWTP| Agricultural and urban water use for irrigation | Land prices Fixed local data Successful use of the tool depends on the input data, reflecting a certain case study. Therefore a preliminary analysis of local costs and possibilities or reuse of the wastewater should be developed together with stakeholders in order to have an integrated assessment of wastewater and reclaimed wastewater use. User information is crucial to make the estimation closer to the reality of the region. Losses of water and collection efficiency | Water consumption per capita | Investment and O&M costs of known treatment technologies | Prices for wastewater pipelines and reservoirs | Energy costs for water distribution | Water and wastewater tariffs |Discount rate for investment and planning horizon
- 4. Download and installation Operwas (version 0.2) is a free and open source tool and is still under development. Its code can be assessed on the QR code below, which also contains an example data set. It is open for further improvements to benefit the scientific community and its use is free if the appropriate reference and sources are mentioned by the user. The Operwas tool was developed through the Kidron/ Nar project with funds from DUPC/Ministry of Foreign Affairs from the Kingdom of Netherlands. Operwas is a result of collaborative work by Alessia Matanó, Maria W. de Alvarenga, Peter van der Steen, Leonardo Alfonso (IHE Delft) and Jawad Hasan (Al Quds University). For further information, please contact: p.vandersteen@un-ihe.org User input information The tool was applied to the region which contains Abu Dis, Al Ezaryia, As Sawahera and Al Ubeidyia, in the West Bank/Palestine. The region contains 7 natural catchments and, for each catchment, different numbers of WWTPs were considered to build one scenario with a total of 7 WWTPs and another with 27 WWTPs. Both scenarios had the same coverage and their benefits and costs were put together to be compared. The input data was obtained during field work (2 months) with stakeholders from the municipalities and project partners. The investment period of 20 years was assumed and assumptions for reclaimed water use were together decided. The highest costs in both scenarios were attributed to the wastewater pipelines and to the wastewater treatment costs (both investment and operational). The higher treatment costs in the decentralized scenario were compensated for the smaller energy costs for pumping of the reclaimed water. When all costs and benefits were summed, there was no significant difference between them. Besides those scenarios, many others can be developed, in order to assess the change of costs with more or less reuse or with different land prices, for example. 7 WWTPs 27 WWTPs 7 WWTPs 27 WWTPs