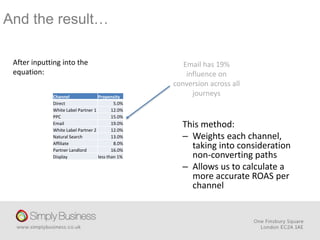
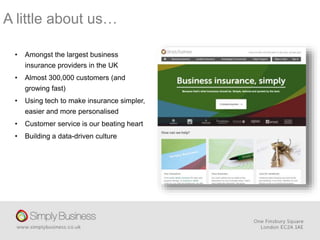
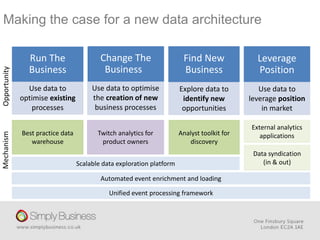
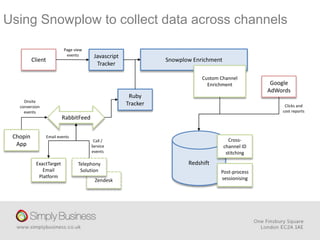
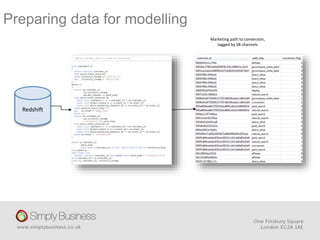
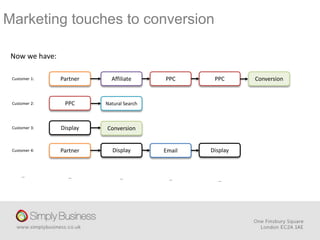
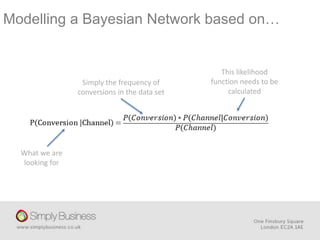
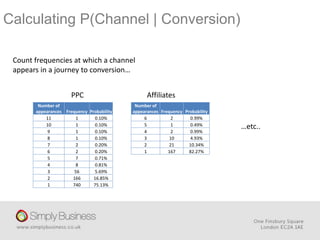
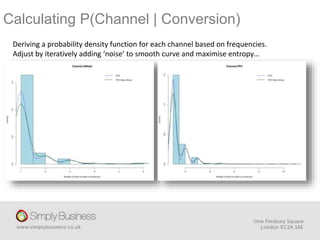
Using our event analytics platform for fun
and profit
Stewart Duncan –
Director of Data Science
A little about us…
• Amongst the largest business
insurance providers in the UK
• Almost 300,000 customers (and
growing fast)
• Using tech to make insurance simpler,
easier and more personalised
• Customer service is our beating heart
• Building a data-driven culture
Our analytics team a year ago…
Alberto
Daniele Anthony
Imtiaz
Natalie &
Emma
How had we got there?
Core OLTP platform migration
Single tool approach to our
data warehouse..Siloed web analytics
Resulted in…
Which meant we did a lot of this…
Making the case for a new data architecture
MechanismOpportunity
Use data to
optimise existing
processes
Run The
Business
Use data to optimise
the creation of new
business processes
Change The
Business
Explore data to
identify new
opportunities
Find New
Business
Best practice data
warehouse
Scalable data exploration platform
Unified event processing framework
Automated event enrichment and loading
Twitch analytics for
product owners
Analyst toolkit for
discovery
Data syndication
(in & out)
External analytics
applications
Leverage
Position
Use data to
leverage position
in market
Mining our granular event data
Business challenge:
– Shopping sessions can last up to a week
– Customers use many channels in that time
– Paid search becoming increasingly competitive
– First touch attribution hides the impact of
nurturing channels
What is the true value of each
marketing channel so that we can
allocate budget accordingly?
The exam question…
Zendesk
Chopin
App
RabbitFeed
Ruby
TrackerOnsite
conversion
events
Snowplow EnrichmentClient
Javascript
Tracker
Custom Channel
Enrichment
Page view
events
Redshift
Google
AdWords
Clicks and
cost reports
Post-process
sessionising
Cross-
channel ID
stitching
ExactTarget
Email
Platform
Telephony
Solution
Email events
Call /
Service
events
Using Snowplow to collect data across channels
Preparing data for modelling
Redshift
Marketing path to conversion,
tagged by SB channels
Marketing touches to conversion
Now we have:
Customer 1: Partner Affiliate PPC PPC
Customer 2: Natural Search
Customer 3: Display
Customer 4: Partner Email
PPC
Conversion
Conversion
Display Display
… … … … …
Modelling a Bayesian Network based on…
This likelihood
function needs to be
calculated
Simply the frequency of
conversions in the data set
What we are
looking for
Calculating P(Channel | Conversion)
Count frequencies at which a channel
appears in a journey to conversion…
Number of
appearances Frequency Probability
11 1 0.10%
10 1 0.10%
9 1 0.10%
8 1 0.10%
7 2 0.20%
6 2 0.20%
5 7 0.71%
4 8 0.81%
3 56 5.69%
2 166 16.85%
1 740 75.13%
PPC Affiliates
Number of
appearances Frequency Probability
6 2 0.99%
5 1 0.49%
4 2 0.99%
3 10 4.93%
2 21 10.34%
1 167 82.27%
…etc..
Calculating P(Channel | Conversion)
Deriving a probability density function for each channel based on frequencies.
Adjust by iteratively adding ‘noise’ to smooth curve and maximise entropy…
And the result…
Channel Propensity
Direct 5.0%
White Label Partner 1 12.0%
PPC 15.0%
Email 19.0%
White Label Partner 2 12.0%
Natural Search 13.0%
Affiliate 8.0%
Partner Landlord 16.0%
Display less than 1%
After inputting into the
equation:
Email has 19%
influence on
conversion across all
journeys
This method:
– Weights each channel,
taking into consideration
non-converting paths
– Allows us to calculate a
more accurate ROAS per
channel
Simply Business and Snowplow - Multichannel Attribution Analysis

Simply Business and Snowplow - Multichannel Attribution Analysis

  • 1.
    Using our eventanalytics platform for fun and profit Stewart Duncan – Director of Data Science
  • 2.
    A little aboutus… • Amongst the largest business insurance providers in the UK • Almost 300,000 customers (and growing fast) • Using tech to make insurance simpler, easier and more personalised • Customer service is our beating heart • Building a data-driven culture
  • 3.
    Our analytics teama year ago… Alberto Daniele Anthony Imtiaz Natalie & Emma
  • 4.
    How had wegot there? Core OLTP platform migration Single tool approach to our data warehouse..Siloed web analytics Resulted in… Which meant we did a lot of this…
  • 5.
    Making the casefor a new data architecture MechanismOpportunity Use data to optimise existing processes Run The Business Use data to optimise the creation of new business processes Change The Business Explore data to identify new opportunities Find New Business Best practice data warehouse Scalable data exploration platform Unified event processing framework Automated event enrichment and loading Twitch analytics for product owners Analyst toolkit for discovery Data syndication (in & out) External analytics applications Leverage Position Use data to leverage position in market
  • 6.
    Mining our granularevent data Business challenge: – Shopping sessions can last up to a week – Customers use many channels in that time – Paid search becoming increasingly competitive – First touch attribution hides the impact of nurturing channels
  • 7.
    What is thetrue value of each marketing channel so that we can allocate budget accordingly? The exam question…
  • 8.
    Zendesk Chopin App RabbitFeed Ruby TrackerOnsite conversion events Snowplow EnrichmentClient Javascript Tracker Custom Channel Enrichment Pageview events Redshift Google AdWords Clicks and cost reports Post-process sessionising Cross- channel ID stitching ExactTarget Email Platform Telephony Solution Email events Call / Service events Using Snowplow to collect data across channels
  • 9.
    Preparing data formodelling Redshift Marketing path to conversion, tagged by SB channels
  • 10.
    Marketing touches toconversion Now we have: Customer 1: Partner Affiliate PPC PPC Customer 2: Natural Search Customer 3: Display Customer 4: Partner Email PPC Conversion Conversion Display Display … … … … …
  • 11.
    Modelling a BayesianNetwork based on… This likelihood function needs to be calculated Simply the frequency of conversions in the data set What we are looking for
  • 12.
    Calculating P(Channel |Conversion) Count frequencies at which a channel appears in a journey to conversion… Number of appearances Frequency Probability 11 1 0.10% 10 1 0.10% 9 1 0.10% 8 1 0.10% 7 2 0.20% 6 2 0.20% 5 7 0.71% 4 8 0.81% 3 56 5.69% 2 166 16.85% 1 740 75.13% PPC Affiliates Number of appearances Frequency Probability 6 2 0.99% 5 1 0.49% 4 2 0.99% 3 10 4.93% 2 21 10.34% 1 167 82.27% …etc..
  • 13.
    Calculating P(Channel |Conversion) Deriving a probability density function for each channel based on frequencies. Adjust by iteratively adding ‘noise’ to smooth curve and maximise entropy…
  • 14.
    And the result… ChannelPropensity Direct 5.0% White Label Partner 1 12.0% PPC 15.0% Email 19.0% White Label Partner 2 12.0% Natural Search 13.0% Affiliate 8.0% Partner Landlord 16.0% Display less than 1% After inputting into the equation: Email has 19% influence on conversion across all journeys This method: – Weights each channel, taking into consideration non-converting paths – Allows us to calculate a more accurate ROAS per channel