Download to read offline

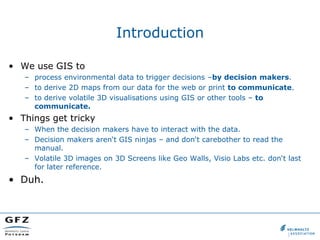
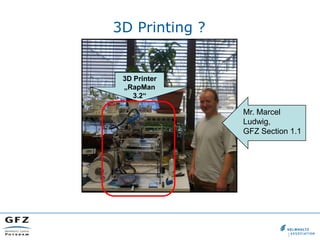
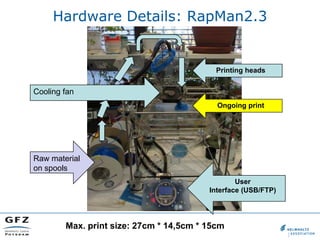
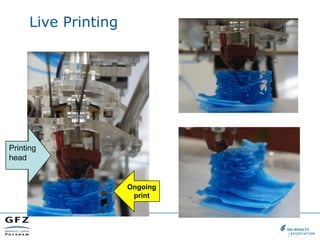
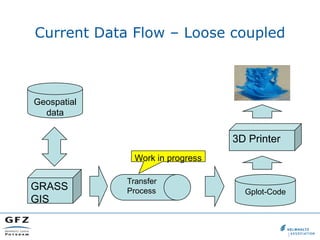
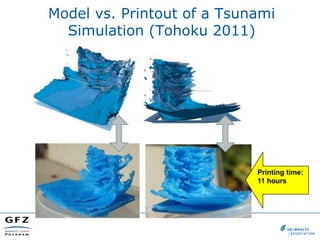
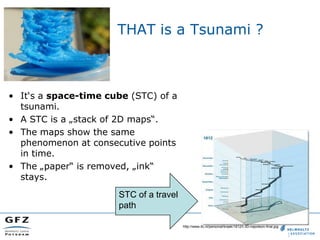
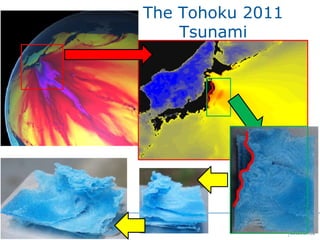
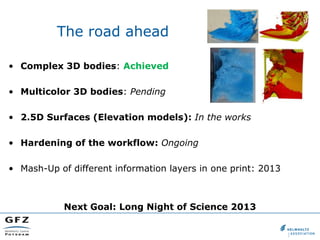

This document discusses 3D printing of geospatial data from GIS systems. It describes how GFZ Section 1.1 is successfully operating a 3D printer and working with CeGIT on projects involving complex 3D data visualization. The current process involves transferring data from GIS software to code that can drive the 3D printer, but the workflow is loosely coupled. Examples shown include a 3D printout of a tsunami simulation. Future goals are to print more complex 3D models, multi-colored outputs, elevation data, and combining multiple data layers in a single printout.


