
Recommended
Recommended
More Related Content
Recently uploaded
Recently uploaded (20)
Featured
Featured (20)
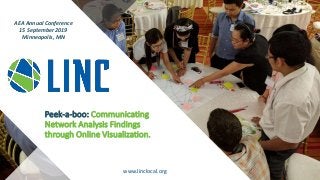
Peek-a-boo: Communicating Network Analysis Findings through Online Visualization
- 1. www.linclocal.org Peek-a-boo: Communicating Network Analysis Findings through Online Visualization. AEA Annual Conference 15 September 2019 Minneapolis, MN
- 2. www.linclocal.org 2 NETWORK ANALYSIS A way of thinking about social systems that focuses attention on the relationships among actors in a system and measures complex interactions of actors at multiple levels.
- 3. www.linclocal.org 3 v Some Up-front Lessons Promote interaction with the data: Enable the user to select nodes, edges and filter for specific attributes. MS Word and Powerpoint can’t do this. Seek off-the-shelf solutions: Kumu.io is the best that we’ve seen Maps can be overwhelming: Narrative should accompany maps. …learned the hard way Start with the overall network: Gradually zooming-in / filtering to tell a story.
- 4. www.linclocal.org 4 v Nicaragua Map Fully customized, Time-intensive, Formatting challenges Objective: Design of a new workforce development project Audience: International donor agencies in Nicaragua Visualization format: Custom web visualization utilizing R and APIs Pros: Customizable, Easy filtering, Dynamic metrics Cons: Formatting varies by device, Communicating with web-developer, Time / Resource-intensive, Narrative insights can get lost BASIC FEATURES: Go to: www.linclocal.org/nicaraguamap
- 5. www.linclocal.org 5 v Impact Investing Telling a story with Kumu Objective: Scrape pre-existing impact investment data to identify promising partnerships Audience: Impact investors, private sector engagement specialists Visualization: Kumu presentation format (www.kumu.io) Pros: Clean, Displays on multiple platforms, Narrative & maps on same page, Highly interactive, Story-telling format, Brandable Cons: Not a lot of helpful metrics BASIC FEATURES: Go to: https://lincllc.kumu.io/using-sna-to-analyze-impact- investment-ecosystems
- 6. www.linclocal.org 6 v Zambia Publications Simple maps, Cost-efficient, Utilized for monitoring efforts to increase research collaborations Objective: Quickly scrape data from Google Scholar to assess collaboration between authors, and how it evolves over time Audience: Program monitors and evaluators Visualization: Kumu presentation format (www.kumu.io) Pros: Utilized for program monitoring, Easy data collection Cons: Limited dataset BASIC FEATURES: Go to: https://linc.kumu.io/zambia-nutrition-research-collaboration
Editor's Notes
- Section 1- “Who are we” (Part 2) Source: Original PPT deck
- Grouped by Actor Type Hover above group node or group name to get basic group insights Filter by: Number of relationships (slider) Relationship strength (slider) Geography to explore three distinct sub-networks Dynamic metric updating: Filter by sector or region Insight 1 (NGOs) Biggest group in the network, but not very influential (toggle high influence) Helped us to communicate with our audience regarding limiting NGO engagement in advocacy initiatives Insight 2 (Desired cnxns) Showed us potential for growth Density increasing to 4% Insight 3 (Employment Agencies) Not positioned between educators and employers Insight 3 (Tourism) More robust, twice as dense, more reciprocation Insight 4 (Donors highly engaged in the network) Facilitation strategies recommended
- Using Kumu Free, off-the-shelf solution Subscriptions enable more project and institutional branding Presentations can be embedded in your own website (https://www.linclocal.org/2018/06/14/exploring-impact-investor-communities-through-network-analysis/) The Overall Network One large group in the center Zoom in-out Select orgs Show the settings option Connected Investors Shows the top five Investor Clusters Colored the top 8 Cluster characteristics (2 slides) Largest cluster is ANDE Clusters 3 and 4 are NY and Silicon Valley VC Identifying Bridgers Lots of buttons / filtering options built into this one Display by group on bottom of page Select Cluster 2 (ANDE/USAID) and 3 (Silicon Valley), then cnxns between groups = Omydiar, DBL Partners, DELL Select Cluster 2 (ANDE/USAID) and 4 (NY), then cnxns between groups: Village Capital, Gates Foundation, TONIIC, Investors Circle, and Serious Change Final Page Brandable More information and resources
- Analysis Overview Analyzing authors and contributors to 22 papers on nutrition in Zambia Utilizes Google Scholar for quick and easy data retrieval Data is somewhat incomplete Visualizations are straightforward, but not as advanced as the Impact Investing presentation The Overall Network Hover over publications on left to zoom-in Influencers Click the names for more attributes, such as organization Organizations Many of the orgs in the network have a lot of researchers, but are relatively disconnected (hover over orgs) By highest total researcher betweenness centrality (hover over)
- Section 1- “Who are we” (Part 1) Source: Word doc sent by Rich