Global health comparisons and attitudes
•Download as PPTX, PDF•
2 likes•401 views

A global Healthcare survey presented to the Market Research Society Healthcare Conference, London 2012

Recommended
Recommended
More Related Content
What's hot
What's hot (7)
Similar to Global health comparisons and attitudes
Similar to Global health comparisons and attitudes (20)
More from Larry Ryan
Recently uploaded
Recently uploaded (20)
Global health comparisons and attitudes
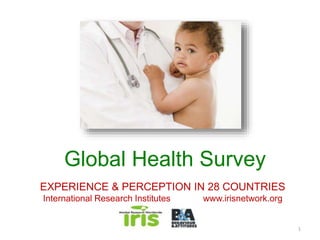
- 1. Global Health Survey EXPERIENCE & PERCEPTION IN 28 COUNTRIES International Research Institutes www.irisnetwork.org 1
- 2. 2
- 3. International Research InstituteS 3 INRA (1950’s) IRIS (1986) Split in the 1980s 5-6 members (Demoscopie (Fra), RSL (UK), NSS (NL), Demoscope (SUI), Data (Esp) B&A joined 1997 FDS (now SPA Future Thinking) 2005 33 members in 2012
- 4. International Research Institutes • A voluntary trade association (non-ownership) • Representing and consisting of quality, multi-disciplinary Independent Agencies. • Thought leadership, sharing experiences, working groups. • A network with trusted, local expertise overseas. • Meet personally every six months and virtually much more often. 4
- 5. Our Stud5 y
- 6. IRIS International Health Survey • First fielded in 2004….21 countries, slightly smaller-scale. • Fielded again Autumn 2011: – 28 countries – 22,000 interviews – Mix of methodologies – Romania/Canada/Ireland-lead but planned by a group of fifteen. 6
- 7. Sample Sizes X Country BASE Method Total TOTAL 21988 Finland Online 500 France CATI 959 Germany Online 1087 Greece CATI & Online 1002 Hungary CATI 500 Ireland Face-to-Face 1000 Italy Telepanel 2030 Lithuania Face-to-Face 1005 Netherlands Online 1062 Poland Online 812 Romania Face-to-Face 1100 Russia CATI 520 Slovenia Online 501 Turkey CATI 417 UK Online 1000 Ukraine Face-to-Face 600 BASE Method Total TOTAL 21988 USA Online 1014 Canada Online 1006 Chile Online 640 Colombia Online 506 China Online & Face-to- Face 1000 India Face-to-Face 1056 Indonesia Face-to-Face 500 Online & Face-to- Malaysia Face 427 Thailand Online 540 Pakistan Face-to-Face 300 Egypt CATI 500 Australia Online 910
- 8. Sample Sizes X Region BASE Method All respondents TOTAL 22364 India Face-to-Face 1056 China Online & Face-to-Face 1000 Asia + Africa CATI, Online & Face-to-Face 2270 Australia Online 910 East / Central Europe CATI, Online & Face-to-Face 4956 Western Europe CATI, Online & Face-to-Face 9007 Americas Online 3166
- 9. Scope • Perceived Health • Contributors to Health • Assessment of Local Systems • Funding Preference • Interaction with HCPs • Opinion of Family Physician • How we gather information or health • Personal input desired on health treatment • Pervasiveness of suicide and related mental conditions 9
- 11. System Attitudes • Broad view persists of crisis in healthcare systems. • The general view is that management failings are the primary detractor moreso than underfunding. • The European perspective is predominantly negative, even in ‘good’ systems: government or national handing invariably criticised. • Healthcare as a sector clearly needs “better press”. 11
- 12. National Health System: Good Shape or Crisis Excellent Very good shape 33 69 56 42 42 39 34 3 12 3 1 6 0 4 2 1 2 2 0 1 1 26 24 24 23 19 17 12 12 9 6 0 All Countries Turkey Finland UK Netherlands Lithuania France Italy Slovenia Germany Ireland Hungary Russia Greece Poland Ukraine Romania 51 24 18 8 81 66 66 62 51 23 7 48 3 0 1 0 20 8 14 6 4 3 5 Canada Chile USA Colombia Indonesia Malaysia India Thailand China Pakistan Egypt Australia
- 13. Regional Healthcare System Evaluation 66 51 50 48 Excellent Very good shape 22 30 28 14 4 8 5 1 2 1 India China Asia + Africa Australia East / Central Europe Western Europe Americas
- 14. Approval of National Healthcare System Strongly approve Somewhat approve 34 77 41 41 37 35 32 32 32 6 24 23 20 19 17 16 11 5 47 2 4 3 4 4 5 5 1 1 1 5 2 2 1 1 All Countries Turkey Finland Netherlands UK Hungary Russia France Ireland Slovenia Lithuania Italy Greece Germany Poland Ukraine Romania Management 42 30 29 19 83 78 72 54 53 25 17 39 2 2 4 1 31 27 20 3 6 0 4 6 Canada Chile USA Colombia Indonesia India Malaysia China Thailand Pakistan Egypt Australia
- 15. Source of Problems in the Healthcare System Inefficient management Not enough funding 63 87 84 79 74 67 64 61 59 58 58 57 50 50 47 37 37 30 10 10 19 24 27 28 38 34 42 42 37 24 41 35 47 52 All Countries Slovenia Germany Greece Poland Russia Ireland Lithuania France Netherlands Romania UK Turkey Ukraine Italy Finland Hungary 95 72 72 62 79 68 66 64 62 43 69 42 5 27 10 30 16 32 34 27 35 42 29 46 Colombia Chile USA Canada China Indonesia Thailand India Pakistan Malaysia Egypt Australia
- 16. Funding Preference: Health Expenses of Governments, through taxation Private individuals 67 84 83 83 82 82 81 78 75 74 73 69 68 65 53 53 46 25 12 17 14 18 9 16 12 14 21 21 9 26 18 38 41 44 All Countries Turkey Netherlands Lithuania Romania UK Greece Finland Hungary Poland Slovenia Italy Russia Ireland France Ukraine Germany Individuals 77 76 75 35 72 67 60 52 51 42 68 65 13 16 19 46 21 33 35 48 46 58 29 23 Canada Columbia Chile USA Malaysia Indonesia Pakistan Thailand India China Egypt Australia
- 18. Global Behavioural & Attitudinal Differences • Interesting differences across continents in relation to tobacco, alcohol, diet and other perceived contributors. • European and American obsessiveness or fastidiousness. • Asian ignorance in relation to some key contributors. • Key implications for public health initiatives. 18
- 19. Factors Contributing to Health 92 89 88 88 88 87 86 84 84 78 Very important Somewhat important 77 52 56 49 51 44 54 47 43 43 54 44 Level of physical exercise Contaminants that affect one’s water and food supply Insufficient or poor quality sleep The diet one chooses on a regular basis Family’s health history or genetics Stress and anxiety Air pollution Use of prescribed medications Outlook on life Use of tobacco The amount of alcohol consumed on a regular basis
- 20. Very Important Contributors to Health by Region TOTAL 22490 1056 1000 2266 910 4956 9137 3165 Contaminants that affect one’s water 56% 40% 54% 63% 41% 61% 55% 58% and food supply Stress and anxiety 54% 16% 46% 37% 52% 59% 56% 69% Use of tobacco 54% 9% 40% 31% 60% 54% 60% 71% Level of physical exercise 52% 54% 39% 62% 46% 52% 47% 61% The diet one chooses on a regular 51% 67% 53% 56% 56% 47% 47% 60% basis Insufficient or poor quality sleep 49% 36% 52% 51% 47% 52% 46% 56% Air pollution 47% 40% 40% 58% 27% 53% 44% 48% Family’s health history or genetics 44% 38% 44% 42% 38% 46% 42% 51% The amount of alcohol consumed on a 44% 9% 28% 26% 47% 47% 49% 53% regular basis Use of prescribed medications 43% 60% 22% 54% 34% 42% 40% 48% Outlook on life 43% 43% 30% 44% 42% 42% 39% 57%
- 21. Tobacco as a Health Contributor x Region 94 86 86 80 76 47 Very important Somewhat important 17 71 60 40 54 60 31 9 Americas Western Europe China East / Central Europe Australia Asia + Africa India
- 22. Alcohol Consumption as a Health Contributor 93 85 81 80 79 44 Very important Somewhat important 16 53 49 28 47 47 26 9 Americas Western Europe China Australia East / Central Europe Asia + Africa India
- 23. 23 Good Doctor/Bad System?
- 24. A Health Paradox • A relatively poor perspective of the health system is accepted. • In contrast, the family physician is very positively perceived. • Suggests a common hardware/software conundrum, or perhaps an explicable manager/carer issue. • Is the public simplistic in its analysis? Should the system be more obviously managed by HCPs rather than bureaucrats. 24
- 25. Usage of Key HCPs for Health Related Services in 59 45 43 24 19 13 7 7 4 65 36 18 13 15 10 3 2 2 68 38 33 9 39 16 6 5 5 Family GP in public system Pharmacists Specialists in the public system Physicians in the private health system Nurse Physiotherapists Dietician/Nutritionist Psychologist Social worker Global Ireland UK Past Year
- 26. Satisfaction with the Family Physician Very satisfied Satisfied at all 84 95 95 94 92 89 88 88 87 83 81 78 77 76 75 65 57 34 56 45 65 47 46 56 9 41 26 22 32 20 10 20 9 13 All Countries Netherlands France Ireland Hungary UK Turkey Lithuania Romania Germany Slovenia Greece Italy Poland Finland Ukraine Russia China was not included in this question 93 91 48 42 93 89 82 81 80 58 92 46 54 7 2 53 38 19 43 15 10 48 Canada USA Chile Colombia India Indonesia Malaysia Pakistan Thailand Egypt Australia
- 27. 27 Search & Information Behaviour
- 28. Finding out about Health • Primary information sources are predictable HCPs, but extent of consultation with less generalist physicians varies very widely. • Variation in online usage is enormous: British internet use highly developed while Irish levels are much lower. • Sites such as Wikipedia have enormous cachet. 28
- 29. Consulted In Past Year On Health Issues That Concern You Most Used To Get Information On Health Issues That Concern You Most Consulted in past year Used as way to get information 57 38 35 30 19 12 9 6 3 3 61 12 23 29 7 4 3 3 1 2 67 28 28 23 5 12 8 4 1 0 Own family GP in public system Specialists Family & friends Pharmacists Other GPs/physicians Others with the condition Non-doctor healthcare professionals Social networking contacts Spiritual/religious Patient advocacy groups 51 26 24 21 19 8 7 6 3 2 2 37 11 12 12 13 1 4 4 2 1 * 71 13 14 25 14 3 4 5 5 * 1 Websites TV/radio programme Magazines or newspaper Pamphlets in GP clinics Books Blogs/chatrooms (Any) social media Pamphlets mailed to you Telephone information lines Smartphone apps DVD/CDs Global Ireland UK The internet is a significant secondary source but much higher in some countries (Germany & UK 71%, USA 79%, China 69%) China (12%)
- 30. Secondary Sources by Region Web-sites TV or radio Magazi nes or newsp apers Brochures from physicians’ offices or clinics Books Blogs and/or chat rooms on the internet Social media (Facebook, Twitter etc) Global 51 26 24 21 19 8 7 India 7 51 33 7 21 1 2 China 69 61 47 23 53 23 25 Asia + Africa 40 46 38 23 23 9 18 Australia 70 14 14 28 18 8 5 East / Central Europe 47 28 26 21 18 10 5 Western Europe 48 18 18 19 14 6 4 Americas 77 18 20 27 21 8 5
- 31. The Assertive Patient 31
- 32. Input to Treatment • Indicated as one of the significant coming trends. • Desired control of own treatment more in evidence where there are better treatment choices or options (Netherlands). • Evidently a middle aged, mid/upper class, affluent, better educated phenomenon. 32
- 33. Patient Input into Treatment Decisions You decide Work with physician Physician makes decision 11 9 7 7 6 8 5 2 9 10 6 23 8 16 6 14 8 51 79 75 75 69 64 63 62 61 54 53 51 49 48 40 30 28 35 11 17 17 24 26 31 33 28 35 37 26 28 32 53 53 64 All Countries Hungary Slovenia Germany France Poland Greece Finland UK Ireland Ukraine Netherlands Italy Russia Turkey Lithuania Romania 5 7 10 11 11 25 24 24 22 30 7 10 82 75 37 36 50 45 31 24 20 9 30 56 12 16 54 50 39 27 45 48 58 61 61 25 USA Canada Chile Colombia Thailand Malaysia China Pakistan Indonesia India Egypt Australia
- 34. Actual & Perceived Health 34
- 35. Actual/Perceived Health Patterns • Many feel that they are in good general health: perceived health measures are strong. • Claimed incidences of long term serious conditions vary very substantially. • Inter-relationship of perceived and actual health data illustrates some broad relationships but equally some more perplexing conundrums. • We can categorise a First World Paradox of high incidence/high health but equally the probability of poorer detection (Ireland). 35
- 36. Perceived Personal Health Assessment 70 84 82 Excellent Good 73 72 72 72 72 69 69 63 63 57 56 56 54 53 14 33 9 12 12 17 15 15 12 20 6 8 11 6 15 12 5 All Countries Ireland Germany Netherlands Slovenia Romania France Greece UK Lithuania Italy Finland Hungary Poland Turkey Ukraine Russia 85 84 76 57 87 85 73 70 63 60 66 65 19 17 15 3 38 23 15 9 13 9 12 13 USA Colombia Canada Chile Pakistan Indonesia India Malaysia Thailand China Egypt Australia
- 37. Top 5 Chronic Conditions by Region 16 14 11 11 10 8 5 8 10 9 5 4 5 6 4 4 5 2 2 1 5 5 6 3 4 4 3 4 5 7 2 3 2 1 Western Europe Americas Australia East /Central Europe China Asia + Africa India High blood pressure High cholesterol Heart condition Diabetes Asthma
- 38. Chronic Conditions by Country (Top 5) 13 27 26 20 19 18 18 15 15 12 11 11 10 8 8 5 4 7 6 10 13 9 10 12 8 8 8 3 6 3 0 5 11 7 6 9 7 8 5 7 6 9 3 5 3 4 4 5 5 7 8 7 6 8 9 5 4 5 3 3 4 3 1 2 1 4 3 6 8 7 4 8 2 3 4 3 1 2 1 2 1 All Countries Hungary Germany Finland France Turkey Netherlands Italy Poland UK Russia Slovenia Romania Greece Lithuania Ireland Ukraine 20 16 10 5 19 10 9 5 4 3 6 11 15 13 4 3 13 4 1 0 3 2 1 9 6 4 3 0 5 2 1 1 1 1 1 4 8 6 4 1 9 4 2 3 3 1 4 6 10 3 3 1 4 3 1 4 1 1 7 Canada USA Chile Colombia Thailand China Pakistan India Malaysia Indonesia Egypt Australia High blood pressure High cholesterol Heart condition Diabetes Asthma
- 39. Actual & Perceived Health Contrast HIGHER INCIDENCE /POORER SELF PERCEPTION HIGHER INCIDENCE /BETTER SELF PERCEPTION Turkey Russia Poland LOWER INCIDENCE /POORER SELF PERCEPTION GLOBAL AVERAGE Germany LOWER INCIDENCE /BETTER SELF PERCEPTION 33% 70% Hungary Finland China Chile Thailand Australia Italy UK Greece Ukraine Egypt Canada France Nederlands USA Slovenia Romania Malaysia India Colombia Ireland Pakistan Indonesia Lithuania PERSONAL HEALTH PERCEPTION ANY SERIOUS ILLNESS INCIDENCE
- 40. Key Thoughts 40
- 41. Key Thoughts • Global variation in need but with much basic commonality. • Study helps to better illustrate global threats posed by local ignorance and the need for better regulation. • Transformative effect of online. • The rise of the assertive patient. • Differences in detection rates and in HCP use. • Need for better PR for health systems. 41
- 42. Larry Ryan Council Member, IRIS Director, B&A www.banda.ie