1. A Guide to low
resistance testing
Understanding and Measuring Low Resistance
to Ensure Electrical System Performance
www.MeGGer.coM
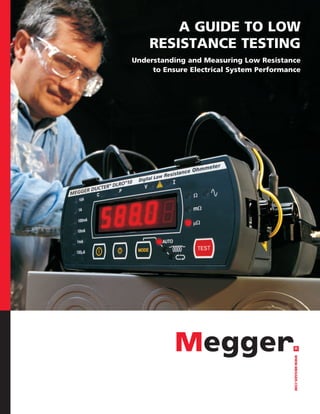
2. Front Cover
Low Resistance Ohmmeter shown being used
to measure contact resistance of a low voltage
molded case breaker.
3. A GUIDE TO LOW RESISTANCE TESTING 1
TABLE OF CONTENTS
Introduction.......................................................... 2
Why Measure Low Resistance?............................ 3
What is a Low Resistance Measurement? ....................3
What Does the Low Resistance Measurement
Tell the Operator?..........................................................3
What Problems Create the Need to
Perform the Test?..........................................................4
Industries with Significant Resistance Problems..........4
SpecificExamplesofApparatusinNeedofLowResistance
Testing............................................................................4
Motor Armature.........................................................5
Automotive Assembly.................................................5
Power Generation and Distribution
(high current joints, connections and bus bars)........5
Transformer Testing...................................................5
Uninterruptible Power Supply - Battery Straps.........5
Cement Plants and other Raw Material
Processing Applications..............................................6
Circuit Breakers...........................................................6
Aircraft Assembly........................................................7
StrapandWireBondsbetweenRailSegments(Railroad
Industry)......................................................................7
Graphite Electrodes....................................................7
Welding Spot or Seam................................................7
Cable Reels..................................................................7
How do You Measure Low Resistance................ 8
2-Wire, 3-Wire and 4-Wire DC Measurements ............8
Two-Wire Measurements...........................................8
Three-Wire Measurements.........................................9
Four-Wire Measurements...........................................9
DC vs. AC Testing............................................................9
How Does a Low Resistance Ohmmeter Operate?.....10
Current Selection..........................................................10
Probe and Lead Selection ...........................................11
Low Range Testing ......................................................11
Test on “Dead” Test Samples......................................12
Types of Testers/How to Choose........................ 12
Milli-Ohmmeter............................................................12
10-A Micro-Ohmmeter.................................................12
100+ A Micro-Ohmmeter.............................................12
Transformer Ohmmeter...............................................13
Lab Micro-Ohmmeter...................................................13
Evaluation/Interpretation of Results................ 14
Repeatability ...............................................................14
Spot Readings/Base Expectations for Readings..........14
Trending ......................................................................14
Circuit Breakers.........................................................15
Stand-by Battery Back-up Systems...........................15
Appendices.......................................................... 16
Potential Sources of Error/Ensuring
Quality Results..............................................................16
Test Leads/Probes......................................................16
Accuracy Statements.................................................17
Interference...............................................................17
Delivery of Stated Test Current Under Load ..........17
Taking the Measurement at a Stable Plateau.........17
Material Resistivity.......................................................17
Effects of Temperature on Measured Resistance Values 18
Effects of Humidity......................................................19
Background Noise Conditions,
Current and Voltage ...................................................19
Use and Misuse of Low Resistance Ohmmeters.........19
Brief History of Low Resistance Ohmmeters..............20
Calibration....................................................................20
Ingress Protection.........................................................20
Various Test Modes......................................................22
Models Designed in the 1970s and 1980s...............22
Recently Designed 10 Amp Models.........................22
Nominal versus Absolute Test Current Levels.............22
Autoranging.................................................................23
Transformer Testing.....................................................23
Bar to Bar Testing.........................................................24
Battery Strap Testing...................................................26
Wheatstone and Kelvin Bridges..................................27
Wheatstone Bridge...................................................27
Kelvin Bridge.............................................................27
Safety............................................................................28
Megger Products Overview................................ 29
4. Resistivityii Temperature Thermal emf
Composition Micro-ohms Ohms for Cir. Coefficient Against Copper
Percent for cm Cube mil Foot per ºC µv/ ºC
Cu 84%
Mn 12% 44 µΩ 264 Ω *±0.00001º 1.7
Ni 4%
* Manganin shows zero effect from 20º to 30º C.
2 A GUIDE TO LOW RESISTANCE TESTING
Introduction
The quantitative study of electrical circuits originated in 1827,
when Georg Simon Ohm published his famous book “Die
galvanische Kette, mathematisch bearbeitet” in which he gave
his complete theory of electricity. In this seminal work, he
introduced the relationship or “Law” that carries his name:
Resistance (R) = Voltage (E) / Current (I)
At that time, the standards for Voltage, Current and Resis-
tance had not been developed. Ohm’s Law expressed the fact
that the magnitude of the current flowing in a circuit depend-
ed directly on the electrical forces or pressure and inversely on
a property of the circuit known as the resistance. Obviously,
however, he did not have units of the size of our present volt,
ampere, and ohm to measure these quantities.
At this time, laboratories developed resistance elements, con-
structed of iron, copper or other available alloy materials. The
laboratories needed stable alloys that could be moved from
place to place to certify the measurements under review. The
standard for the ohm had to be temperature stable and with
minimum effects due to the material connected to the ohm
standard.
In 1861, a committee was established to develop a resistance
standard. This committee included a number of famous
men with whom we are now familiar, including James Clerk
Maxwell, James Prescott Joule, Lord William Thomson Kelvin
and Sir Charles Wheatstonei. In 1864, a coil of platinum-silver
alloy wire sealed in a container filled with paraffin was used
as a standard. This was used for 20 years while studies were
made for a more reliable standard. These studies continued
as the old National Bureau of Standards (NBS), now known
as the National Institute of Standards and Technology (NIST),
controlled the standard for the “OHM.” Today the industry
uses Manganin alloy because it has a low temperature coeffi-
cient so that its resistance changes very little with temperature
(see figure 1). The table below from Melvin B. Stout’s “Basic
Electrical Measurements” highlights the key properties of
Manganin.
The thermal emf against copper indicates the thermocouple
activity of the material whereby a voltage is generated simply
by connecting two different metals together. The goal is to
minimize thermocouple activity as it introduces error into the
measurement.
With the metric system, the measurements are in meters and
the resistivity is determined for a one-meter cube of the mate-
rial. However, more practical units are based on a centimeter
cube. With the USA system, the resistivity is defined in ohms
per mil foot. The wire diameter is measured in circular mils
(0.001)2 and the length in feet.
Figure 1 shows the temperature-resistance curve for Man-
ganin wire at 20º C. For Manganin shunts, the 20° C curve
shifts to 50º C, as this material will be operating at a higher
temperature due to the application. The Manganin alloy was
designed for use in coils used to perform stable measuring
conditions at 20º C ambient room conditions.
The alloy is modified for strips of material used in measuring
shunts, which operate at a higher ambient, up to 50º C.
The purpose of this booklet is to help the engineer, technician
or operator:
n Understand the rationale behind low resistance
testing.
n Understand how to make a low resistance
measurement.
n Understand how to select the proper instrument for the
testing application.
n Understand how to interpret and use the results.
i Swoope’s Lessons in Practical Electricity; Eighteenth Edition; Erich Hausmann, E.E., ScD.; page 111
ii Swoope’s Lessons in Practical Electricity; Eighteenth Edition; Erich Hausmann, E.E., ScD.; page 118
5. A GUIDE TO LOW RESISTANCE TESTING 3
Why Measure Low Resistance?
Measuring low resistance helps identify resistance elements
that have increased above acceptable values. The operation
of electrical equipment depends on the controlled flow of
current within the design parameters of the given piece of
equipment. Ohm’s Law dictates that for a specified energy
source, operating on V ac or V dc, the amount of current
drawn will be dependent upon the resistance of the circuit or
component.
In the modern age of electronics, increased demands are
placed on all aspects of electrical circuitry. Years ago the
ability to measure 10 milli-ohms was acceptable, but, in
the present industrial electronic environments, the field test
engineer is now required to make measurements which
show repeatability within a few micro-ohms or less. These
types of measurements require the unique characteristics of
a low resistance ohmmeter’s four-wire test method, which is
covered on page 9 in this booklet.
Low resistance measurements are required to prevent long
term damage to existing equipment and to minimize energy
wasted as heat. They indicate any restrictions in current flow
that might prevent a machine from generating its full power
or allow insufficient current to flow to activate protective
devices in the case of a fault.
Periodic tests are made to evaluate an initial condition or to
identify unexpected changes in the measured values, and the
trending of this data helps indicate and may forecast possible
failure conditions. Excessive changes in measured values point
to the need for corrective action to prevent a major failure.
When making field measurements, the operator ought to
have reference values that apply to the device being tested
(the manufacturer should include this information in the
literature or name-plate supplied with the device). If the tests
are a repeat of prior tests, then these records may also be
used to observe the range of the anticipated measurements.
If, when conducting tests, the operator records the results
and the conditions under which the tests were performed,
the information becomes the beginning of a database that
can be used to identify any changes from fatigue, corrosion,
vibration, temperature or other condition that may occur at
the test site.
What is a Low Resistance Measurement?
A low resistance measurement is typically a measurement
below 1.000 ohm. At this level it is important to use test
equipment that will minimize errors introduced by the test
lead resistance and/or contact resistance between the probe
and the material being tested. Also, at this level, standing
voltages across the item being measured (e.g. thermal emfs at
junctions between different metals) may cause errors, which
need to be identified.
To allow a measurement to compensate the errors, a four-
terminal measurement method is employed with a reversible
test current and a suitable Kelvin Bridge meter. Low resistance
ohmmeters are designed specifically for these applications.
In addition the upper span on a number of these meters
will range into kilohms, which covers the lower ranges of a
Wheatstone Bridge (please see the appendix for a discussion
of the Wheatstone and Kelvin Bridge methods). The lower
range on many low resistance ohmmeters will resolve 0.1
micro-ohms. This level of measurement is required to perform
a number of low range resistance tests.
What Does the Low Resistance Measurement Tell
the Operator?
Resistance (R) is the property of a circuit or element that
determines, for a given current, the rate at which electrical
energy is converted to heat in accordance with the formula
W=I2R. The practical unit is the ohm. The low resistance
measurement will indicate to the observant operator when
degradation has or is taking place within an electrical device.
Changes in the value of a low resistance element are one of
the best and quickest indications of degradation taking place
between two contact points. Alternatively, readings can be
compared to “like” test specimens. These elements include
rail bonds, ground bonds, circuit breaker contacts, switches,
transformer windings, battery strap connections, motor
windings, squirrel cage bars, bus bar with cable joints and
bond connections to ground beds.
Temperature
ResistanceResistance
0.99
1.00
20 Cϒ C
Wire Coil Strip - Shunt
50 C
350ϒ
ϒ
Figure 1: Qualitative Resistance-Temperature Curve for Manganiniii
iii Basic Electrical Measurements; Melvin B. Stout; 1950; page 61
6. 4 A GUIDE TO LOW RESISTANCE TESTING
Industries with Significant Resistance Problems
Industries that consume vast amounts of electrical power
must include low resistance ohmmeter measurements in
their maintenance operations. Not only does abnormally
high resistance cause unwanted heating, possibly leading
to danger, but it also causes energy losses which increase
operating costs; in effect you are paying for energy which you
can’t use.
In addition, there are industries that have critical specifications
on bond connections to ensure solid connections to “ground
beds.” Poor connections reduce the effectiveness of the
ground bed and can cause significant power quality-related
problems and/or catastrophic failure in the event of major
electrical surge. A number of sub-assembly operations supply
components to aircraft manufacturers that specify low
resistance connections to the airframe. Strap connections
between cells on a power back-up battery system also require
very low resistance. A general list of industries include:
n Power generation and distribution companies
n Chemical plants
n Refineries
n Mines
n Railroads
n Telecommunications companies
n Automotive manufacturers
n Aircraft manufacturers
n Anyone with UPS battery back-up systems
Specific Examples of Apparatus in Need
of Low Resistance Testing
As we have shown, low resistance ohmmeters have
application in a wide range of industries and can help identify
a number of problems that could lead to apparatus failure.
In general manufacturing industries, motor windings, circuit
breakers, bus bar connections, coils, ground bonds, switches,
weld joints, lightning conductors, small transformers and
resistive components all require low resistance testing.
Following are some of the more typical applications.
Motor Armature
Armature windings can be tested to identify shorting
between adjacent coils or conductors. Squirrel cage bars in
the rotor can separate from the end plates, resulting in loss
of performance. If a motor appears to be losing power, a low
resistance test should be performed. Alternatively, tests can
be made when bearings are being replaced at a periodic or
annual shutdown.
The measurement will alert the operator to changes having
taken place from the initial and/or subsequent measurements.
These changes can occur from a number of influences
including temperature, chemical corrosion, vibration, loss
of torque between mating surfaces, fatigue and improper
handling.
These measurements are required on a regular timed cycle in
order to chart any changes taking place. Seasonal changes
may be evident when summer and winter data are reviewed.
What Problems Create the Need to Perform the Test?
Assuming a device has been correctly installed in the first
place, temperature, cycling, fatigue, vibration and corrosion
all work to cause the gradual degradation of the resistance
value of an electrical device. These influences build up over a
period of time until a level is reached at which the device no
longer operates correctly. The critical degrading factor will be
determined by the application.
Environmental and chemical attacks are relentless. Even air
will oxidize organic materials while the ingress of moisture,
oil and salt will degrade connections even more rapidly.
Chemical corrosion can attack the cross sectional area of an
element, reducing the area while increasing the resistance
of the component. Electrical stresses, particularly sustained
overvoltages or impulses, can cause welds to loosen.
Mechanical stress from vibration during operation can also
degrade connections, causing resistance to rise. These
conditions result in excessive heating at the location when
the component is carrying the rated current, based on the
formula W=I2R. For example:
6000 A across a 1 µΩ bus = 36 Watts.
6000 A across a 100 µΩ bus = 3,600 Watts, which will result
in excessive heating.
If left unattended, these types of problems can lead to failure
in the electrical system containing the affected components.
Excessive heating will ultimately result in failure due to
burnout, which may open an energized circuit.
Backup battery power supplies provide a good practical
example of how degradation can occur under normal
operating conditions. Changes in current flow cause
expansion and contraction of the terminal connections,
causing them to loosen or corrode. Additionally, connections
are exposed to acid vapors, causing further degradation.
These conditions result in a decrease in the surface-to-surface
contact area with an associated increase in surface-to-surface
contact resistance, ultimately causing excessive heating at the
junction.
7. A GUIDE TO LOW RESISTANCE TESTING 5
Bar to bar testing on dc motor rotors is performed to
identify open or shorted coils (see Figure 2). These tests are
performed with spring loaded hand probes. This is a dynamic
method to determine the conditions of the windings and
the soldered connections to the riser on the commutator
segments. When test data is reviewed periodically, the effects
of overheating due to excessive temperature rise can be
identified.
Automotive Assembly
Cable leads in a “robot” spot welder can work-harden
through continual flexing. Eventually fatigue can occur
causing strands to break. This condition results in a high lead
resistance with loss of power to the weld, producing a poor
spot-weld (nugget) or even complete failure of the machine.
Power Generation and Distribution (high current joints,
connections and bus bars)
Bus bars in a power system consisting of lap joints and other
connections, are used to deliver current to the elements in
the system. These bolted connections can be degraded by
vibration and corrosion. (See Figure 3.) The bolts are stressed
to a specific tightness (torque), and the quickest and most
economical way to determine the quality of the connection
is to measure the resistance across the joint. The operator
should have historical data to make the determination on the
suitability of the connection. If left uncorrected, loss of power
and/or excessive heating could lead to a meltdown at the
connection.
Transformer Testing
Transformer winding tests are performed in the factory and
then periodically in the field. The factory test is performed
at ambient temperature. A second factory test is a heat run
to verify that, at rated power, the resistance of the windings
remains within its designed temperature rise characteristics.
Large transformers have “taps” on both the primary and
secondary windings. The condition of the taps requires
verification, since the secondary taps are operated daily and
are exposed to excessive wear and vibration as the power
distribution system balances the load carried on the various
circuits. The taps on the primary side are critical to major
adjustments in the power distribution and should be tested
to ensure that a low resistance connection is available for the
new power condition. Tap connections can corrode when not
in use and may overheat due to the high current (which can
result in a fire).
Uninterruptible Power Supply - Battery Straps
On series connected industrial batteries, straps (lead coated
copper bars) are secured to the posts on adjacent batteries,
(+) to (-), with stainless steel bolts. These surfaces are cleaned,
greased and tightened to a preset torque value. As noted
previously, they are subject to vibration, chemical corrosion
and heat due to the charging and high current discharges
associated with the application. The quickest and best way
to determine the quality of the connections is to measure the
resistance between the two adjacent battery terminals (see
Figures 4 and 5). This is the only field application in which the
operator makes measurements on an energized system. Please
see the appendix for more detail on battery strap testing.
Please note that there are various levels of “float current”
in a battery system and the test procedure must account for
this current flow. A test is performed with the test current
added to the float current and a second test is made with
the test current opposed to the float current. These two
measurements are averaged to determine the “ohmic” value
of the connection.
Standard procedures require measurements on a regular
schedule, as past experience has determined that battery
straps are one of the weakest elements in the operation of
a battery system. When not attended to on a regular test
C1 P1
C2 P2
Figure 2: Bar to Bar Testing on DC Motor Rotor
C1 C2
P1N
P1B P1C
P1D
P1A
P2N
P2B P2C
P2D
P2A
Figure 3: Bus Bar Connections
8. 6 A GUIDE TO LOW RESISTANCE TESTING
program, high resistance connections can develop. This
situation can result in the battery being unable to deliver
sufficient current when called for, or when combined with
current surge and hydrogen gas evolved from the battery
cells, can cause a fire in the battery system, destroying
the UPS.
Carrier strips “carry” the plates in a cell. The plates are
suspended from the carrier strips into the liquid in the cell. If
the resistance of the terminal to carrier strip welds is too high,
the battery’s ability to carry current is limited. In addition to
measuring strap resistance, a low resistance ohmmeter can
also be used to measure the quality of these welds
(see Figure 6).
Cement Plants and other Raw Material Processing Applications
The electrical system at a cement plant or other raw materials
processing facility includes motors, relays, disconnect
switches, etc. The testing of these power-carrying elements as
part of a regular program or when major retrofits take place is
critical to the ongoing operation of the plant.
The quality of the current connections can identify weak
elements or connections in the system. Note that cement
dust is chemically active (corrosive) and will attack metallic
connection.
Circuit Breakers
Due to arcing at the circuit breaker pads, carbonized layers
will build up and the live contact area will reduce or become
pitted, leading to increased resistance and heating. This
situation reduces the efficiency of the breaker and can lead
to failure on an active transmission system resulting in the
loss of a substation. When planning a test, the operator must
be aware of IEC62271-100 and ANSI C37.09 for test current
requirements. When testing large oil circuit breakers, the best
instrument is one that ramps up current, holds it for a period
of time and then ramps down. This test method reduces
the magnetizing, which would otherwise be created by the
sudden switching on and off of the test current. This can
result in inaccurate “CT” measurements when the system is
returned to normal ac operation.
Care should be taken when making a measurement across a
CT as high dc currents may saturate the CT, desensitizing it
to potential faults. Also, ripple on the test current may cause
circuit breakers to trip. Careful positioning of the current
probes should prevent this happening, and the ripple present
on the current waveform may be minimized by separating the
test leads.
C1 P2P1 C2
Figure 4: Single Strap with Two Contact Surfaces
+
+
+
+
C1
P1
C1
P1
C1
P1
C1
P1
C2
P2
C2
P2
C2
P2
C2
P2
Figure 5: Parallel Straps on a Large Battery Complex
A B
C
A to B – Intercell strap resistance
A to C – Carrier strip resistance
Plates
Carrier
Strip
Cell #1 Cell #2
Figure 6: Measuring Carrier Strip Resistance
9. A GUIDE TO LOW RESISTANCE TESTING 7
Aircraft Assembly
Bond testing of all the main frame electrical and mechanical
connections is required to ensure a stable “ground plane”
within an aircraft. These physical “bond” connections provide
a uniform path for static electricity to be discharged to the
wicks on the trailing edge of the wings and tail assembly. This
path reduces the chance of lightning damaging the avionics
in the event of a lightning strike situation. Over time, the
bonding of static wicks, antenna, control linkage and battery
terminals should be inspected. The integrity of a welded
exhaust system should also be verified and documented. In
normal operations, excessive static electricity will not effect
the operation of most navigation and communications
systems. The best (lowest) resistance connections will improve
the performance of such systems.
Strap and Wire Bonds between Rail Segments
(Railroad Industry)
In the railroad environment, bonds are exposed to vibration as
the wheels pass over the rails (each click-clack causes vibration
across the interface bonding the strap to the rail). These
bonds are part of the control system which tells the operator
the location of different trains. Within the rail system, a
telephone system uses the rail conductors to communicate.
The resistance of these bonds is critical to the performance of
the control system. In systems that use three rails, the third
rail is the active source of power for the engine, and power
lost across a high resistance bond (such as a poor Cadweld
joint) reduces the efficiency of the transit system. The operator
can select a five-foot section of track without a bond, make
a measurement and then measure a five-foot section with a
bond to determine the quality of the connection. As a rule of
thumb, these measurements should be within a few micro-
ohms (or ±5%).
Graphite Electrodes
Graphite electrodes have a negative temperature
characteristic. (As the temperature of the element increases
the resistance measurement will decrease.) Graphite slugs are
extruded as large diameter cylinders and may be up to six feet
in length. One of the applications for these large slugs is in
aluminum refineries where high currents (150,000 A) are used
to reduce bauxite ore to high-grade aluminum.
Low resistance testing is done as a quality control step to
verify the density of the graphite extrusion. Due to the size
of the electrodes, this test requires a special test fixture to
introduce the test current across the surface of the ends,
ensuring a uniform current density through the volume of
the sample. The potential probes are then connected across a
known length of the sample to determine the “ohms per unit
length” (see Figure 7 on the following page).
Welding Spot or Seam
The quality of a spot weld can be determined by measuring
the resistance across the joined materials. The quality of a
seam weld can be determined by a series of tests along the
weld seam. Readings should remain within a narrow band of
values. An increase and then drop in readings is an indication
that the uniformity of the weld is out of specification. To
make the measurement properly, the operator should
fabricate a fixture to keep the probes in a fixed relationship.
Readings are then taken at a number of points across the
weld seam and plotted (see Figure 8). These measurements
are normally in the micro-ohm region and special care is
required in the design of the test fixture.
Cable Reels
A reel of insulated copper wire may have a tag indicating the
wire gauge along with the ohms per unit length. When wire
remains on the reel after partial utilization, the remaining
length can be calculated by measuring the resistance of the
wire and making a calculation using the ohms per length
specification (see Figure 9).
Alternatively, if the tag has been destroyed, the operator can
cut off a known length of wire, measure that sample and
determine the ohms per length. This value can then be used
with the reading taken when measuring the balance of wire
on the reel to calculate the remaining length. The temperature
of the reel of cable will be approximately the same as the
temperature of the sample. Though the internal temperature
of the reel may be slightly different, a reasonable estimate
of the remaining length of cable can be calculated. If the
operator reviews the temperature charts on pages 18 and 19
in this book, an estimate of the inaccuracy can be determined.
This method also applies to aluminum and steel wires as long
as the wire has an insulating coating to prevent shorting
between adjacent loops of wire.
How do You Measure Low Resistance
2-Wire, 3-Wire and 4-Wire DC Measurements
Why do we have resistance measuring instruments, some with
only two test leads, some with three and even some with four
test leads? The answer depends on the degree of information
required from the measurement, and the magnitude of the
resistance being measured. Resistance readings cover a wide
10. 8 A GUIDE TO LOW RESISTANCE TESTING
range of values from micro-ohms into the thousands of meg-
ohms region. Figure 10 shows the measurement range in
which each type of instrument performs best.
Two-Wire Measurements
Two–wire testing is the simplest method and it is used to
make a general assessment of a circuit element, conductor
or the routing of a conductor in a circuit. The two-wire lead
configuration is most familiar to many operators as it is the
configuration used on most multimeters. It is generally used
when the probe’s contact resistance, series lead resistance or
parallel leakage resistances do not degrade the quality of the
measurement beyond a point acceptable to the operator.
The measured value will include the test lead wire resistance
and contact probe resistance values, which will affect
the measurement by adding some tens of milli-ohms to
the actual resistance. In most instances this will make
little practical difference to the measured value, but
when the measurement is below 1.000 ohm the two-
wire method can easily introduce an error, which could
be several percent, into the measured resistance value.
The specifications on some hand-held meters indicate
a 200 milli-ohm range with one milli-ohm sensitivity.
The lead resistance may be zeroed out, but that leaves
the uncertainty of the contact resistances, which can
change with each measurement. Contact resistance
values may be in the 35 milli-ohm range at each probe
and can vary with the temperature of the material
under investigation.
The two-wire test method is best used for readings above
10.00 ohms up to 1.0 to 10.0 megohms.
Three-Wire Measurements
Three-wire dc testing is reserved for very high resistance
and is typically used for measurements above 10.0 megohms.
We normally associate this type of testing with diagnostic
insulation resistance. The test method uses a third test lead
as a guard, and allows for resistances in parallel with the test
circuit to be eliminated from the measurement. This parallel
resistance is usually considerably lower than the insulation
resistance being measured. In fact it may, in severe cases,
effectively short out the insulation resistance such that a
meaningful measurement cannot be carried out without the
use of a guarding circuit.
This test method is described and illustrated in the Megger
booklets “A Stitch in Time…” and “A Guide To Diagnostic
Insulation Testing Above 1 kV.”
Weld Seam
Testing Path
Test1 TestN
C1
P1
P2
C2
Test Position
1 N
Zone with Poor
Weld Penetration
C1
P1
P2
C2
Figure 8: Series of Measurements Across a Weld Seam
Low Resistance
Ohmmeter
P1
P2
C1
C2
Figure 9: Determining the Remaining Length of Cable on a Reel
Figure 7: Testing Graphite Slugs for Uniform Density (ohms/inch)
11. A GUIDE TO LOW RESISTANCE TESTING 9
Four-Wire Measurements
Four-wire testing is the most accurate method when
measuring circuits below 10.00 ohms as this method
eliminates errors due to lead and contact resistances. This is
the test method associated with low resistance ohmmeters.
Four-wire dc measurements uses two current and two
potential leads (see Figure 11). The four-wire dc measurement
negates the errors due to the probe lead wire and any contact
resistance values in the final reading, ensuring more accurate
measurements.
DC vs. AC Testing
The issue here is the selection of the correct type of test
current. A dc instrument should be used when trying to
measure the pure resistance of a circuit or device. An ac
instrument is used for applications such as ground bed testing
or impedance testing.
A special impedance meter is used to perform tests on
industrial batteries. The word impedance is used to indicate
a measurement comprised of a resistance and reactance,
which can be either an inductive or capacitive component.
These measurements are conducted as part of a battery
maintenance program; typically a low resistance ohmmeter is
used to perform strap connection verification tests.
Three or four-wire ac measuring
systems are used to perform
tests on “ground beds” with
special frequencies that exclude
measurement errors from 50/60
Hz ground currents. The use
of ac prevents the test current
polarizing ions in the soil, thereby
changing the conditions and
thus the measured values. This
is an area of interest to the
electrical power distribution
and telecommunication fields.
The low ground resistance path
is required for maintaining the
potential of the ground wire to
the “earth” potential. Electrical
performance of the power system
minimizes shock hazards as a
path to ground is made available
for the energy from lightning
and other static voltages that
may affect the power control system. The same conditions
pertain to the telephone systems, as high resistance grounds
can cause excessive noise on the voice and data links. Please
see the Megger booklet “Getting Down to Earth” for more
information on ground resistance testing. Both of these
industries require not only low ground bed resistance but also
low resistance “ac/dc bonds” between the ground bed and
the active circuits.
How Does a Low Resistance Ohmmeter Operate?
A low resistance ohmmeter uses two internal measuring
circuits. The supply injects a current into the test sample
through two leads, usually identified as C1 and C2, and
the magnitude of the current is measured. Concurrently,
two probes (normally referred to as P1 and P2) measure the
potential across the sample. The instrument then performs
an internal calculation to determine the resistance of the
test sample.
Why does this approach result in a measurement that is
independent of lead resistance and contact resistance?
We have represented the complete measurement circuit in
Figure 12. Current is injected into the item under test via
-10
-5
0
5
10
15
4-wire 2-wire 3-wire
Measurement Range (Ohms)
100m
1
10
100
1m
10m
100m
1
10
100
1k
10k
100k
1M
10M
100M
1G
10G
100G
1T
ExponentialofTen
Figure 10: Selection of Optimum Measuring Technique
12. Probe and Lead Selection
The potential and current leads are either connected
separately or to a probe. When probes are used the potential
connection is identified with a “P.” The connections are
placed in contact with the sample so that the P-identified
contacts or leads are positioned towards each other. The
current contacts are then positioned outside or away from
the potential connections. This causes the current to flow
with a more uniform current density across the sample being
measured.
For the more rigorous tests, separate test leads are used
and the current connections are positioned away from the
10 A GUIDE TO LOW RESISTANCE TESTING
leads C1 and C2. The current that flows will be dependent
upon the total resistance of this loop and the power available
to push the current through that resistance. Since this current
is measured, and the measured value is used in subsequent
calculations, the loop resistance, including the contact
resistance of the C1 and C2 contacts and the lead resistance
of C1 and C2, does not have an effect on the final result.
From Ohm’s Law, if we pass a current through a resistance
we will generate a voltage across the resistance. This voltage
is detected by the P1 and P2 probes. The voltmeter to which
these probes are connected internally has a high impedance,
which prevents current flowing in this potential loop. Since
no current flows, the contact resistance of the P1 and P2
contacts produces no voltage and thus has no effect on
the potential difference (voltage) detected by the probes.
Furthermore, since no current flows through the P leads their
resistance has no effect.
A high current output is one of the qualifying characteristics
of a true low resistance ohmmeter. Generic multimeters do
not supply enough current to give a reliable indication of
the current-carrying capabilities of joints, welds, bonds and
the like under real operating conditions. At the same time,
little voltage is required, as measurements are typically being
made at the extreme low end of the resistance spectrum.
Only the voltage drop across the measured resistance is
critical, and it is measured at the millivolt level.
Good instruments alert the operator of open circuit
conditions on the test leads while a few models have
automatic range selection.
Current Selection
Depending on the instrument chosen, the current selection
can be either manual or automatic. The operator should select
the highest current suitable for the test to provide the best
signal to noise ratio for the measurement. On instruments
that offer current levels in excess of 10 amps, care is required
to minimize any heating of the sample that would itself cause
the resistance of the sample to change.
Instruments designed for circuit breaker testing have much
higher current characteristics and the operator must be careful
when setting the test current level. Instruments designed
specifically for transformer testing have a special high-voltage
power level at the beginning of the test to saturate the
winding. These units then switch to a lower constant current
mode to measure the winding on the transformer.
Constant Current
DC Source
DC Voltmeter
C1 P1 P2 C2
Resistance
Measured
Low Resistance Ohmmeter
Measuring Circuit
(with digital display; R=E/I)
Figure 12: Basic Operation Diagram
Measured Resistance
Length
Current
Probe 1
(C1)
Potential
Probe 1
(P1)
Current
Probe 2
(C2)
Potential
Probe 2
(P2)
Figure 11: Simplified Example of a 4-Wire Measurement
13. A GUIDE TO LOW RESISTANCE TESTING 11
potential connections by a distance that is 11
⁄2 times the
circumference of the sample being measured. ASTM Standard
B193-65 provides guidelines for making a measurement that
will establish uniform current density. This standard suggests
separating the current probes from the potential probes by
11
⁄2 times the cross sectional perimeter of the test specimen.
Figure 13 shows a test being made to the standard on a
cylindrical test item.
The use of probes, Kelvin Clips, or C-clamps will meet most
field requirements as the operator should be making repetitive
measurements under the same conditions. The sharp points
on the probes should leave a mark on the specimen for future
testing. In some situations a marker pen can indicate the test
area and the probe positions will be identified by the probe
indents.
Leads are available in a number of lengths to meet different
field application requirements. The probe selection is made
from separate current and potential leads with clips to
connect to the test sample. Helical spring point probes have
both potential and current probes in the same handle. The
“P” identification on the probe identifies the position on
the sample at which the measurement is taken. This probe
arrangement provides a practical method when making
repetitive measurements (ideal when testing strap connections
in UPS battery supply systems).
Kelvin Clips and C-clamps have the current and potential
connections 180º from each other, providing separate current
and potential connections. The size of the terminal connection
determines which one to select. See Figure 14 for the
different probe/lead configurations.
Note: The order of connection of potential and current clips
is not important. However, never connect the potential clip to
the current clip as this will cause an error in the measurement
due to the voltage drop at the current connection interface at
the sample.
Low Range Testing
When measuring on the extreme edge of precision and
sensitivity, factors become significant that would be too
small to be of consequence in conventional testing. In low
resistance testing, thermal emfs (electromotive forces) can
produce voltage gradients across the test sample. Although
only on the milli-volt level, and of little or no influence on
common multimeter tests, these can cause fluctuations
of several digits. Such instability defeats the purpose of
a high-precision measurement. In addition, alternating
current interference can be induced by nearby electric or
magnetic fields, or may be present from the float charge on
standby battery systems, or through leaky switches, electrical
imbalance and so on.
This problem is readily overcome, however, by taking
readings in forward and reverse polarity and then averaging
them. Some models accomplish this with a manually
operated reversal switch, while others perform the two
measurements automatically, then display the average
reading. If unidirectional measurement is desired to save time
(as in testing battery straps), the tester may have an override
function. Another sophisticated technique automatically
measures the magnitude and slope of thermal emfs and
subtracts from the displayed reading.
Test on Dead Test Samples
As a general safety measure, normal testing should always
be performed on de-energized samples. Special training
and equipment are required to perform tests on energized
circuits. Internal fused input circuits are designed into a few
instruments that will protect the instrument if inadvertently
connected to an energized test sample. The low input
impedance of the current supply internal to general
instruments becomes a willing current sink when connected
across a live circuit.
Zone with Uniform
Current Density
Circumference (Cir) = 2 Π r
P1C1
1.5(Cir)
P2 C2
1.5(Cir)
Figure 13: ASTM Standard B193-65
14. 12 A GUIDE TO LOW RESISTANCE TESTING
Types of Testers/How to Choose
Milli-Ohmmeter
As the name implies, a milli-ohmmeter is less sensitive than
a micro-ohmmeter, with measurement capability in the milli-
ohm rather than micro-ohm range (minimum resolution of
0.01 milli-ohm). This type of instrument is normally used for
general circuit and component verification. Milli-ohmmeters
also tend to be less expensive than micro-ohmmeters, making
them a good choice if measurement sensitivity and resolution
are not critical. The maximum test current is typically less than
two amperes and as low as 0.2 amperes.
10-A Micro-Ohmmeter
The field portable micro-ohmmeter with a 10-amp maximum
test current is the “work-horse” instrument for most
operators because it covers the majority of field applications.
The 10-amp output not only provides a comfortable and
suitable test current through the test sample to make the
measurement, but also allows for reduced weight and
improved battery operation.
The best 10-amp micro-ohmmeters offer measurements
from 0.1 micro-ohm to 2000 ohms with a best resolution
of 0.1 micro-ohm at the low end of the range and accuracy
of ±0.2%, ±0.2 micro-ohms. On some instruments, different
measurement modes may be selected which address different
types of testing conditions. Measurement modes could
include manual, automatic or continuous testing, or a high
power test for large windings.
Following is a selected list of key dc resistance measurement
applications for 10-amp micro-ohmmeters.
n Switch and contact breaker resistance
n Bus bar and cable joints
n Aircraft frame bonds and static control circuits
n Welded joint integrity
n Intercell strap connections on battery systems
n Resistive components (quality control)
n Small transformer and motor winding resistance
n Rail and pipe bonds
n Metal alloy welds and fuse resistance
n Graphite electrodes and other composites
n Wire and cable resistance
n Transmitter aerial and lightning conductor
bonding
100+ A Micro-Ohmmeter
According to IEC62271-100, testing the contact resistance
of high voltage ac circuit breakers calls for a test current with
any convenient value between 50 A and the rated normal
current. ANSI C37.09 specifies that the test current should be
a minimum of 100 A. Most electrical utilities prefer to test at
higher currents, as they believe this is more representative of
working conditions.
Field portable micro-ohmmeters are available that can deliver
anywhere from 100 A up to 600 A (subject to the load
resistance and supply voltage). The best instruments have
measurement resolution to 0.1 micro-ohm and offer variable
test current to address a wider range of applications. By
testing at 10 A and then at a higher current, the operator can
get a better understanding of the maintenance requirements
for the circuit breaker.
In addition to circuit breakers, electrical utilities and testing
companies use higher current micro-ohmmeters on other high
voltage apparatus, including:
n Cables
n Cable joints
n Welds
n Bus bars
n Switchgear in general
Operators using 100+ A micro-ohmmeters should be
aware of certain technical issues related to testing at
high currents. Some operators have indicated they
perform a 10 A test and then see improved resistance
C1 P1
C1 C2P1 P2
P2 C2 C1 P1
C1 C2P1 P2
P2 C2
C1
P1P1 P2
C1 C2
Combined Current and
Potential Probes
Separate Current and
Potential Probes
C-Clamps or Kelvin Clips
ϒ(P and C 180 apart)
C1 P1 P2 C2
Figure 14: Probe/Lead Configurations
15. A GUIDE TO LOW RESISTANCE TESTING 13
readings with 100+ A test currents. This difference in the
measurements raises the question of whether there is a need
for additional maintenance. A strict reading of Ohm’s Law
does not indicate the need for the higher current to perform
the measurement. In the equation R = V/I, the magnitude of
the current is not defined. Is this a situation where the high
current is blasting contaminants away from the contacts,
and at the same time welding the contacts together? The
operator should be aware that they may be masking a
potential problem in a power distribution system and avoiding
necessary maintenance.
Operators should also be aware that high current meters
are intended to be used at high currents. Their accuracy
may reduce considerably at low currents, particularly when
measuring small resistances.
Transformer Ohmmeter
The transformer ohmmeter is designed specifically for
problems found in measuring transformer windings and tap
changers (discussed in more detail in the appendix). Some
instruments include dual meters with independent range
controls such that the primary (high resistance) and secondary
(low resistance) windings of a transformer may be measured
at the same time.
The transformer ohmmeter is a multi-current device, has
measurement resolution to 1 micro-ohm and is used both
in factory tests and for field operating verification.
Operation of the transformer ohmmeter is sometimes
enhanced by connecting the test current through both
windings with opposite polarity, thus providing the fastest
test time (the mutual inductance between the windings is
minimized). This current connection operation is used on wye
to wye, wye to delta and delta to delta transformers. The
ability to measure primary and secondary windings at the
same time also speeds up the testing time.
The power supply is often designed to deliver the energy to
saturate the winding and then provide a stable level of test
current. The test set should also be able to test the windings
and contact resistance on tap-changers with make-before-
break contacts and voltage regulators. Tap-changers are
the most vulnerable part of the transformer and face more
failures and outages than any other component. Frequent
testing is required to ensure proper and reliable operation.
A transformer ohmmeter is used to:
n Verify factory test readings.
n Help locate the presence of defects in transformers,
such as loose connections.
n Check the make-before-break operation of on-load
tap-changers.
n Perform “heat runs” to determine the internal temperature
changes, via the winding resistance, that occur under rated
current conditions.
(See the Table for Copper - Temperature/ Resistance
Relationship on the following page.)
Additional field test methods are noted in the appendix.
Lab Micro-Ohmmeter
Lab-style micro-ohmmeters are designed for measuring
resistance components and use low pulsed currents
(0.01 A – 1 A), with ranges from 199.9 micro-ohms to
1999 ohms. The pulses (+) and (-) allow the meter to
eliminate errors due to thermal emf across the test sample.
These types of instruments are not intended for measuring
inductive circuits. Due to the low test current the operation in
the field is limited as the signal to noise condition will reduce
the sensitivity of the measurement.
Evaluation/Interpretation of Results
Repeatability
A good quality low resistance ohmmeter will provide
repeatable readings within the accuracy specifications for
the instrument. A typical accuracy specification is ±0.2%
of reading, ±2 lsd (least significant digit). For a reading of
1500.0, this accuracy specification allows a variance of
±3.2 (0.2% x 1500 = 3; 2 lsd = 0.2).
Additionally, the temperature coefficient must be factored
into the reading if the ambient temperature deviates from the
standard calibration temperature.
Spot Readings/Base Expectations for Readings
Spot readings can be very important in understanding the
condition of an electrical system. The operator should have
some idea of the level of the expected measurement based
on the system’s data sheet or the supplier’s nameplate. Using
this information as a baseline, variances can be identified and
analyzed. A comparison can also be made with data collected
on similar equipment.
As noted, the data sheet or nameplate on a device should
include electrical data relevant to its operation. The voltage,
16. Following are several examples of where trending can help the
operator make better-informed maintenance decisions:
Circuit Breakers
As noted previously, mechanical wear and tear on circuit
breaker contacts that reduces the area of the contact surfaces
combined with sparking and/or arcing will increase the
resistance across the working connections. This condition
will produce heat that can reduce the effectiveness of the
circuit breaker. Periodic measurements will show the rate of
increase of the contact resistance value. When these values
are compared to the original manufacturer’s specification, a
decision can be made to continue or repair. By tracking the
trend of the readings, the operator will get an idea of when
the circuit breaker should be pulled for service before damage
is done.
Stand-by Battery Back-up Systems
The interface between the terminals and the straps on battery
back-up systems is subject to chemical attack from the acid
atmosphere, thermal changes due to the charging and
discharge currents and mechanical stress from vibration. Each
of these factors can cause the resistance bond to degrade,
resulting in the potential for a fire at a critical power discharge
(due to the hydrogen gas atmosphere). Battery systems
require diligent attention, as replacement batteries are both
expensive and not off-the-shelf items. A failure situation can
14 A GUIDE TO LOW RESISTANCE TESTING
current and power requirements can be used to estimate
the resistance of a circuit, and the operating specification
can be used to determine the allowed change in a device
(for example, with battery straps, connection resistances
will change with time). Various national standards provide
guidance for periodic test cycles.
The temperature of the device will have a strong influence
on the expected reading. As an example, the data collected
on a hot motor will be different from a cold reading at
the time of the installation. As the motor warms up, the
resistance readings will go up. The resistance of copper
windings responds to changes in temperature based on the
basic nature of copper as a material. A more detailed review
of temperature effects is covered in the appendix. Using the
nameplate data for a motor, the expected percentage change
in resistance due to temperature can be estimated using the
table shown to the right for copper windings or the equation
on which it is based.
Different materials will have different temperature
coefficients. As a result, the temperature correction equation
will vary depending on the material being tested.
Trending
In addition to comparing measurements made with a low
resistance ohmmeter against some preset standard (spot test),
the results should be saved and tracked against past and
future measurements. Logging of measurements on standard
forms with the data registered in a central database will
improve the efficiency of the testing operation. Prior test data
can be reviewed by the operator, and then on-site conditions
can be determined.
Developing a trend of readings helps the operator better
predict when a joint, weld, connection, or other component
will become unsafe, and make the necessary fix(es).
Remember that degradation can be a slow process. Electrical
equipment faces mechanical operations or thermal cycles
that can fatigue the leads, contacts and bond connections.
Additionally, these components may also be exposed to
chemical attack from either the atmosphere or man-made
situations. Periodic testing and recording of the results
provides a database of values that can be used to develop
resistance trends.
Note: When taking periodic measurements, the operator
should always connect the probes in the same place on
the test sample to ensure similar test conditions.
Copper – Temperature/Resistance Relationship
Temp. Temp. Resistance Percent
ºF ºC µΩ Change
-40º -40º 764.2 µΩ -23.6%
32º 0º 921.5 µΩ -7.8%
68º 20º 1000.0 µΩ 0.0%
104º 40º 1078.6 µΩ +7.9%
140º 60º 1157.2 µΩ +15.7%
176º 80º 1235.8 µΩ +23.6%
212º 100º 1314.3 µΩ +31.4%
221º 105º 1334.0 µΩ +33.4%
R(end of test)/R(beginning of test)
= (234.5 + T(end of test))/(234.5 + T(beginning of test)
17. A GUIDE TO LOW RESISTANCE TESTING 15
result in a battery system being out of service for a number
of weeks. Periodic measurements of the strap resistance will
identify those bond connections that have degraded since the
last test and corrective action can be planned.
Note: When connections have higher than normal
resistance measurements, the operator should not
retighten the bolts, as this will over stress the soft lead
connection. Over tightening does not cure the problem.
The proper procedure is to disassemble the straps, clean,
grease and then reconnect with the bolts tightened to
the supplier’s torque level. All the connections should be
balanced within a narrow tolerance of ±10 to 20%.
In these and many other systems, time lost to repair defective
equipment may be small compared to the cost of having
equipment out of service for weeks. Periodic testing can
avert many problems. Analyzing data against past results and
reasonable standards allows the operator to select the time
when corrective work should be done.
The value of a system is in its ability to perform on demand.
Operations are predicated on many systems being available
at an instant’s notice. When elements break, production is
lost and time is wasted making emergency repairs. Taking
and analyzing periodic low resistance measurements saves
companies money by helping identify problems before they
result in catastrophic failure.
The practical example shown in Figure 15 shows how
trending low resistance measurements made on a periodic
basis provides critical information to the operator. When low
resistance measurements are made on
stranded cables on spot welding robot
#23, the operator is gathering data to
estimate when fatigue to the current
conductor will degrade the quality of the
weld nugget. The test data begins with the
wire manufacturer’s specifications. It has
been determined that a resistance increase
of up to 10% is acceptable. In this case,
measurements are made after a specific
number of weld operations. When charting
this data, observe the rate of change as
the readings approach the end of life for
the stranded cable (see Figure 15). The
critical factor could have been long-term
exposure to a chemical solvent. In other
operations the critical factor is time, with
testing performed seasonal or on specified
number of days.
Appendices
Potential Sources of Error/Ensuring Quality Results
The operator can compromise low resistance measurements
if the wrong test equipment is selected or the temperature
at the test site is not determined and noted on the test data
sheet. Prior to testing, surface preparation may be critical.
Heavy scale or oxide coatings should be removed to expose a
clean surface and ensure good current connections.
Test Leads/Probes
An instrument’s specification should have a recommended
listing of suitable test leads. The operator should always verify
that the correct leads are being used as leads may look alike
but have different resistances, which may limit the maximum
current that the instrument can produce.
Do not use thermocouple extension wire in place of copper
leads as the material mismatch will produce erratic data that
will change as the site temperature varies with the seasons.
The probe selection is also critical. High current tests require
secure connections to the work surface because high
resistance at the contacting point can limit the expected level
of test current, causing a poor signal-to-noise ratio, with
erratic results. Use of unsuitable probes for the particular
application can lead to unreliable results.
In all cases tests are performed with current injection and
potential measurements made at separate locations on the
component. Potential test clips must never be connected to
Scheduled Resistance Readings - Robot #23
136.0
123.0
134.1
132.9
115.0
120.0
125.0
130.0
135.0
140.0
Number of Operations
Allow for a 10% increase;
123.0 x 1.1 = 135.3;
100-105K operations
Area of Concern
Resistance-Micro-Ohms
0
5,000
10,000
15,000
20,000
25,000
30,000
35,000
40,000
45,000
50,000
55,000
60,000
65,000
70,000
75,000
80,000
85,000
90,000
95,000
100,000
105,000
Figure 15: Trending Analysis of Low Resistance Readings
18. 16 A GUIDE TO LOW RESISTANCE TESTING
the current connection as the voltage drop at the current
interface will be added to the potential measurement and
produce an error in the reading. The ideal current connection
injects current above the potential measurement position.
When these points are close to each other the Kelvin Clip or
C-clamp connectors are used, injecting current 180º from the
potential connection (see Figure 16).
Probes are available in five basic styles; each is designed to
address specific field and/or application situations. Figure 17
shows some of the different styles.
Fixed Point: Most economical and lightweight probes.
Kelvin Clips: Feature spade lugs on the outboard end and
alligator clips with insulated silver or gold plated jaws.
Linear Spring Points: These probes are designed with spring
points, which recess into the handle to allow for unevenness
of the surface. They are designed for clean surfaces as they
have no “cutting” action to allow them to bite through
surface contamination.
Helical Spring Points: Tips rotate and compress into the body
of the probe, allowing the probes to break through any
grease or surface film, ensuring an accurate measurement.
Additionally, these probes will leave a mark on the test
surface to identify the points where the test was performed.
Care should be taken when using these probes if the surface
being contacted is sensitive to pressure points.
C-Clamps: Current passes through the C-clamp and screw
thread while the potential passes through a four-point anvil
insulated from the clamp metal.
The test leads are matched to battery-operated meters to
ensure that the nominal level of test current will be delivered
to the test specimen.
C
P
C P
C
P
Correct Correct Wrong
Figure 16: Correct and Incorrect Probe Placements Figure 17: Basic Styles of Probes
Finally, probes are designed to make electrical connection
with the test sample. They are not intended to be used to
clean surfaces, open tins, etc.
Accuracy Statements
Quality low resistance ohmmeters will show their accuracy
statement as “±X.X% of reading, ±X lsd.” Beware of
instrument accuracies stated as a percent of range rather than
a percent of reading. While these accuracy statements may
look alike, the measurements made on an instrument with
(% of range) accuracy would provide readings that are less
accurate.
The resolution of an instrument reading is typically one-half
the least significant digit (lsd) noted in the accuracy statement.
The magnitude of the lsd influences the repeatability of
the measurement. A large lsd number is due to the low
sensitivity of the instrument, adding an additional error to the
measurement.
Check the temperature coefficient of the selected instrument.
The temperature coefficient (% of reading per degree)
is multiplied by the site temperature difference from the
instrument’s calibrated temperature and will influence the
accuracy of the field measurements. An instrument that
includes an accuracy notation of +0.2%/ ºC should not
be used in the field, as its best utilization would be in a
laboratory with a constant ambient environment.
The operator must be aware of all these characteristics when
selecting the test instrument.
19. A GUIDE TO LOW RESISTANCE TESTING 17
Interference
A strong electrical field, flux linkage from a high current
circuit or voltage induced from a high voltage conductor can
cause interference at the test site. In addition ground currents
can induce noise on a conductor. Interference can reduce
sensitivity and produce unstable readings. An instrument with
low noise rejection, or hum attenuation may be stable when
tested on the bench but be erratic in selective field conditions.
Modern electronics can detect the level of noise and some
instruments use this to indicate when excessive noise is
present to make a valid measurement.
Delivery of Stated Test Current Under Load
Battery operated, digital low resistance ohmmeters have
different test currents dependent on the selected range. The
lowest resistance range has the highest current level and as
the range increases the current will decrease. (As the range
increases by a factor of ten the test current will decrease by
a factor of ten.) This feature allows for an effective balance
between weight and functionality.
The output current delivered by the instrument is not critical,
as the instrument will be measuring the actual test current at
the time of the test. However, the instrument must be able
to deliver sufficient current to produce a clear signal in the
presence of typical noise. A typical instrument can have a
10% to 20% tolerance on the maximum current rating. But,
to make a good potential measurement, the current must be
stable. The critical factor for the measurement is the voltage
measurement via the potential leads (Ohms Law; R = V/I).
The one testing area where the test current is critical is on
a transformer due to the magnetic characteristics of the
winding. Sufficient current is needed to saturate the winding,
and then a lower constant current is used to perform the
measurement.
Taking the Measurement at a Stable Plateau
A de-energized test specimen provides a stable platform on
which to make the measurement. Live circuits can produce
an unstable test platform. An example of the latter is the
testing of battery straps on a UPS system. The charging and/
or discharging currents may induce noise across the battery
straps being measured, and at the same time cause the
resistance values to increase (due to heating of the strap and
its connections). When collecting data, the operator must
define the test conditions. As noted previously, temperature
can have a significant influence on any measurements made.
The operator should note the temperature and document any
electrical equipment that is in operation in the test area.
Material Resistivity
Conductors of the same dimensions have different resistances
if they are made of different materials due to varying number
of free electrons in varying substances. We account for these
differences with the term resistivity, which is the resistance
of a sample of the material having dimensions with specified
unit values. While scientists tend to look at cubes of material
as the measurement standard (one centimeter cube or one
inch cube), conductors tend to be circular, making a circular
standard important for practical use. The resistivity of a
material is defined in ohm-circular mils per foot; that is, the
resistance (in ohms) of a piece of material one foot long and
one circular mil cross section. It is defined at a temperature of
20º C/68º F.
20. Temperature Coefficients of Resistance
Material Per ºC Per ºF
Aluminum 0.0038 0.0021
Carbon (0-1850 ºC) -0.00025 -0.00014
Constantan (0-100 ºC) negligible negligible
Copper (@ 20 ºC) 0.00393 0.00218
Iron 0.0050 0.0028
Lead 0.0043 0.0024
Manganin (0-100 ºC) negligible negligible
Mercury 0.00090 0.00050
Platinum 0.0038 0.0021
Silver 0.0040 0.0021
Tungsten 0.0045 0.0025
Zinc 0.0037 0.0021
The following table shows the resistivities for a number of
conducting materialsiv:
18 A GUIDE TO LOW RESISTANCE TESTING
Effects of Temperature on Measured Resistance Values
Resistance measurements are dependent on temperature. If
the original data was read at one temperature but later tests
are conducted at other temperatures, this temperature data
is required to determine the suitability of the measurements.
All materials do not react to temperature to the same degree.
Aluminum, steel, copper and graphite have specific tempera-
ture coefficients that will affect the degree of changes that
may take place with temperature at the site of the measure-
ment.
Low resistance measurements rely on the operator conduct-
ing the tests within the operating temperature range of the
instrument (the operator must be aware of field conditions).
When the operator sees out-of-tolerance measurements, one
of the first steps is to verify the instrument’s reading with a
suitable calibration shunt.
As mentioned previously, resistance measurements are
dependent on temperature. The resistance of all pure metals
increases with rising temperature. The proportional change
in resistance for a specific material with a unit change in
temperature is called the temperature coefficient of resistance
for that material. Temperature coefficients are expressed as
the relative increase in resistance for a one-degree increase in
temperature. While most materials have positive temperature
coefficients (resistance increases as temperature rises), carbon
graphite materials have negative temperature coefficients
(resistance decreases as temperature rises).
The following table shows the temperature coefficients of
resistance for selected materialsv.
Resistivities of Conductors
Micro-Ohms Ohm-CM
Substance CM Cube In. Cube per Foot
Aluminum 2.83 1.11 17.0
Carbon (Graphite) 700 275 4210
Constantan 49 19.3 295
(Cu 60%, Ni 40%)
Copper (annealed) 1.72 0.68 10.4
Iron (99.98% pure) 10 3.94 60.2
Lead 22 8.66 132
Manganin 44 17.3 264
(Cu 84%, Ni 4%, Mn 12%)
Mercury 95.78 37.7 576
Platinum 9.9 3.9 59.5
Silver 1.65 0.65 9.9
Tungsten 5.5 2.17 33.1
Zinc 6.1 2.4 36.7
iv Electrical Metermen’s Handbook; Third Edition; 1965; page 479
v Electrical Metermen’s Handbook; Third Edition; 1965; page 480
In most field applications the operator will determine the suit-
ability of a field measurement against a pre-selected specifica-
tion. In most cases, these specifications have been generated
from the following formula (at 20º C/68º F):
R = rL/A
Where:
r = resistivity of the material in ohm-CM per foot.
L = distance between two points on the
material, in feet.
A = cross section area measured in circular mils.
21. A GUIDE TO LOW RESISTANCE TESTING 19
Figure 18 shows the temperature-resistance
curves for some of these materials (based on
a baseline reading of 1000 micro-ohms at
20º C).
When making a measurement on a specific
material, the operator can calculate the
change in resistance due to a change in
temperature by multiplying the resistance
at the reference temperature by the
temperature coefficient of resistance and by
the change in temperature.
R2-R1 = (R1)(a)(T2 – T1)
Where:
R1 = resistance of the conductor at the
reference temperature
R2 = resistance of the conductor when
the measurement is made
T1 = reference temperature
T2 = temperature at which the measurement is made
a = temperature coefficient of resistance for the material
being tested
The operator should also be aware of operating and storage
temperature specifications of the instrument he/she is using
to ensure that it is suitable for the environment in which it will
be used.
Effects of Humidity
The relative humidity of the test specimen should not affect
the resistance reading unless the material is hygroscopic, in
which case more moisture will be absorbed into the sample
at higher humidities. This will change the measurement
conditions and will affect the achieved result. However, most
conductors are non-hygroscopic. Therefore, since instruments
are typically designed with an operating range of from 0 to
95% RH, providing that moisture is not actually condensing
on the instrument then a correct reading will be obtained.
Background Noise Conditions, Current and Voltage
Resistance measurements can be degraded by static voltages
and ripple currents (electrical noise) impressed on the test
specimen. The operator should be aware of the level of noise
rejection in the instrument being used. Changing to a differ-
ent model may help the operator make a measurement at a
difficult test site.
The magnitude of the test current used by the instrument
will affect the noise rejection capability of that instrument.
A 10 Amp test current will provide much better noise rejection
than a 0.1 Amp test current. Beware of excessive test currents
which can change or damage the test sample due to heating
(W = I2R). If 100 Amp is used in place of 10 Amp, the sample
will experience 100 times the heat of the lower test current.
The open circuit voltage on most low resistance ohmmeters is
low. When making measurements on transformer windings,
additional power is required to saturate the winding and allow
the meter to stabilize more rapidly. Instruments designed for
this type of application have a higher open circuit voltage (in
the 30 Vdc range) to deliver the energy needed to saturate
the windings. Then a constant current mode of operation is
used to perform the resistance measurement.
Use and Misuse of Low Resistance Ohmmeters
The effective operation of a low resistance ohmmeter relies on
the operator using the correct test leads. Battery operated in-
struments are designed for a specific lead resistance, based on
the operational life of the test sequence. The specified leads
allow for a reasonable current drain from the power supply
for the testing cycle. If leads with a higher resistance are used,
the current used for the testing may be lower than the meter
requires, potentially causing a signal-to-noise problem that
may reduce the accuracy and/or repeatability
of the measurement.
800.0
900.0
1000.0
1100.0
1200.0
1300.0
1400.0
1500.0
1600.0
-40 -20 0 20 40 60 80 100
Temperature - Degrees C
Carbon
Copper
Iron
Resistance-Micro-ohms
Figure 18: Temperature-Resistance Curves for Iron, Copper and Carbon
22. solve problems. However, electronics and battery technology
advanced to the point where a considerable number of
improvements could be made to the 1970s designs. Newly
designed low resistance ohmmeters by Megger include data
storage and downloading capability, additional test modes,
reduced weight, extended battery life, etc.
Calibration
Calibration of low resistance ohmmeters can be checked in
the field by the use of a shunt. Calibration is performed with
individual current and potential 12-gauge copper leads to
ensure correct current distribution through the shunt and an
accurate potential measurement. Be aware that “test probes”
do not provide accurate positioning of the leads to verify
the instrument calibration. They can, however, be used to
determine the relative calibration of the instrument.
The following table shows commercially available shunts:
These calibration shunts when used with a Certificate of
Calibration, traceable to National Standards, help the field
service engineer demonstrate to a customer the accuracy of
the tests being conducted.
Ingress Protection
Somewhere in the fine print (specifications) of most test
instrument product bulletins is an IP rating, a number that
gives the operator vital information. In fact, the IP rating
lets the operator know whether a piece of test equipment is
suitable for his/her application and test environment.
20 A GUIDE TO LOW RESISTANCE TESTING
If leads with lower than the specified resistance values are
used, the test cycle for the instrument will be shorter than
anticipated. This situation may be suitable if the meter is to be
used in a test program with high background electrical noise.
The use of special leads with shielding may also be a solution
for these high noise situations.
A common error in the field is to use a low resistance ohmme-
ter to sample the resistance of a ground bed. This application
is incorrect, as the ground bed test method requires an instru-
ment that toggles the test signal at a known frequency and
current level. A low resistance ohmmeter used in this applica-
tion will provide an erroneous reading as the ground current
will have an undue influence on the measurement. A proper
ground tester performs in essentially the same way as a low
resistance ohmmeter, that is, by injecting a current into the
test sample and measuring the voltage drop across it. How-
ever, the earth typically carries numerous currents originating
from other sources, such as the utility. These will interfere
with the dc measurement being performed by a low resis-
tance ohmmeter. The genuine ground tester, however, oper-
ates with a definitive alternating square wave of a frequency
distinct from utility harmonics. In this manner, it is able to
perform a discrete measurement, free of noise influence.
Brief History of Low Resistance Ohmmeters
The original DUCTER
™
low resistance ohmmetervi was de-
veloped by Evershed & Vignoles (one of the companies that
evolved into Megger and the developer of the first insulation
resistance tester) in 1908 and employed the cross-coils meter
movement that was already used in the insulation resistance
tester. This initial design evolved into field units in the 1920s
that required a leveling procedure at the time of the test due
to the sensitivity of the coil (to being level). These early models
did not travel well and were sensitive to shock and vibration.
For fifty years, field portable low resistance ohmmeters were
analog units. In 1976, in response to numerous customer
requests, the James G. Biddle Company (another one of the
companies that ultimately became Megger) developed and
introduced a digital low resistance ohmmeter. This unit was
known by its trade name, the DLRO
®
(a registered trademark
of Megger). Ultimately, the James G. Biddle Company
released 10 amp and 100 amp versions of the DLRO,
including a single box design for some versions that simplified
the testing process, and an extended range model.
This style of instrument served the industry well for a number
of years, and the various versions continue to help end users
vi Basic Electrical Measurements; Melvin B. Stout; 1950; page 61
Resistance ±0.25% Value Current Rating
10.000 ohm 1.0 mA
1.0000 ohm 10 mA
0.1000 ohm 100 mA
0.0100 ohm 1 A
0.0010 ohm 10 A
0.0001 ohm 100 A
23. A GUIDE TO LOW RESISTANCE TESTING 21
“IP” stands for “ingress protection.” That is the degree
to which the instrument can withstand invasion by foreign
matter. The IP rating system has been established by the
IEC (International Electrotechnical Commission), in their
Standard 529, and is used as a guide to help the operator
protect the life of the instrument. It also can help the operator
make a more informed purchase decision by ensuring that
the piece of test equipment is designed to work in the
environment(s) that the user faces.
The IP rating is comprised of two digits, each signifying a
separate characteristic. The designation indicates how well
the item is sealed against invasion by foreign matter, both
moisture and dust (the higher the number(s), the better the
degree of protection). What would a typical rating of IP54 tell
a buyer about the application capabilities of a model? If you
want to sound thoroughly knowledgeable, that’s IP five-four,
not fifty-four. Each digit relates to a separate rating, not to
each other.
The first digit refers to particulate ingress, reflecting the
degree to which solid objects can penetrate the enclosure. A
level of “5” indicates “dust protected” as well as protected
from invasion with a wire down to 1.0 mm. There is only one
higher category: “dust tight.”
The second digit refers to moisture. A rating of “4” means
resistance to “splashing water, any direction.” The higher
ratings of 5 through 8 indicate “jetting water” and “tempo-
rary” or “continuous” immersion.
As an example, suppose an instrument under consideration
was rated only to IP43. What would that tell the operator
about its usability? Could it be thoroughly utilized in a quarry
or cement plant? Hardly! The particulate rating 4 indicates
“objects equal or greater than 1 mm.” That’s a boulder
in comparison to particles typically produced by industrial
processes. Flying dust could put the instrument out of com-
mission.
Suppose the instrument is rated at IP42. A moisture rating
of 2 indicates dripping water. Therefore, it would not be
resistant to flying spray. Acquiring an instrument for an
environment that exceeds its IP capabilities likely means
that the operator will need another very soon. What about
a rating of IP40? A moisture rating of 0 means that the
instrument is not protected against any liquid ingress.
The following charts provide a guide to various IP ratings and
what they mean to the operator.
Protection against Ingress of Solid Foreign Objects
(First Digit)
Number Description
0 Non-protected
1 Objects equal or greater than 50 mm
2 Objects equal or greater than 12.5 mm
3 Objects equal or greater than 2.5 mm
4 Objects equal or greater than 1 mm
5 Dust protected
6 Dust tight
Protection against Ingress of Liquids (Second Digit)
Number Description
0 Non-protected
1 Water dripping vertically
2 Water dripping, enclosure tilted
up to 15°
3 Spraying water, up to 60° angle
from vertical
4 Splashing water, any direction
5 Jetting water, any direction
6 Powerful jetting water, any direction
7 Temporary immersion in water
8 Continuous immersion in water
Protection against Access to Hazardous Parts
(First Digit)
Number Description
0 Non-protected
1 Protected against access with back of
hand (50 mm)
2 Protected against access with jointed
finger (12 x 80 mm)
3 Protected against access with a tool
(2.5 mm)
4,5,6 Protected against access with a wire
(1.0 mm)
24. 22 A GUIDE TO LOW RESISTANCE TESTING
Various Test Modes
Digital low resistance ohmmeters designed in the 1970s and
1980s tended to offer two modes of operation, each designed
for specific applications. Recent microprocessor technology
has allowed newer instruments to include additional modes,
further extending the capabilities of these models. Following is
a brief review of the types of test modes available on different
vintage instruments:
Models Designed in the 1970s and 1980s
Continuous Mode: This switch position allows the test current
to flow and a measurement taken when the current and
potential probes contact the test specimen. This mode of
operation is usually implemented when the helical spring-
point lead sets are used and is the normal method when
conducting field tests. Battery life is extended, as the test
current flows only when the tests are performed.
Momentary Mode: This switch position requires both sets of
test leads to be connected to the specimen. The measurement
is performed when the switch is toggled to the momentary
position. This mode of operation is used when separate
current and potential leads are connected to the specimen.
Recently Designed 10 Amp Models
Normal Mode: Test mode where the operator connects all
four test leads and presses the test button on the instrument
to initiate a test. The instrument checks the continuity of
the test connections and then applies forward and reverse
current. The reading is displayed for a short period
(10 seconds).
Auto Mode: Test mode that allows forward and reverse
current measurements to be made (the average value is
displayed) simply by making contact with all four probes. Each
time the probes are removed and reconnected to the load,
another test is performed. This mode, which is similar to the
Continuous Mode found on older instruments, is an excellent
time-saving method to use when testing battery straps with
handspikes. It has the added advantage, when testing with
handspikes, that the contact detection sensing ensures good
contact before applying heavy currents. This avoids arcing
when contact is made, which erodes the probe tips as well as
potentially damaging the surface of the item under test.
Continuous Mode: Test mode that allows repeated
measurements to be made on the same test sample. Once
the test leads are connected and the test button pushed, a
measurement is made every set number of seconds until the
circuit is broken.
Unidirectional Mode: This mode applies current in one
direction only. While this type of measurement does not
negate standing emfs, it does speed up the measuring
process. In many test conditions, such as testing battery
straps, it is not necessary to perform a reversed current test on
the sample. This mode is also used when testing objects with
inductive properties such as motors and transformers.
Recently Designed 100+ Amp Models
Normal Mode: Test mode where the operator connects all
four test leads and presses the test button on the instrument
to initiate a test. The instrument checks the continuity of the
test connections and then applies the test current.
Continuous Mode: This mode is used to monitor test
conditions for a period of time. After the test leads are
connected and the test button pressed, tests will be recorded
every set number of seconds until the test button is pressed or
contact is broken with any of the test probes.
Auto Mode: With this mode, because of the heavy test
currents used, the operator connects the current leads, selects
the desired test current and presses the test button. As soon
as the potential leads are connected, a test will begin. To
make another test, the operator breaks contact with the
voltage probes and then remakes contact. This is an excellent
mode for measuring individual joints in a bus bar.
Nominal vs. Absolute Test Current Levels
Battery operated digital low resistance ohmmeters have
different test currents, which are a function of the selected
range. The lowest range has the highest current level and
as the range increases the current decreases. As the range
increases by a factor of 10, the test current will decrease by
a factor of 10. This action allows for a balance of weight
and function; if the current were to increase as the range
increases, this field instrument would lose much of its
portability, and its usefulness for field-testing would decrease
significantly. In power plants, substation and distribution
sites, the test equipment is exposed to interference from high
currents generated in the area. The operator will have to
determine the test current level to provide the most accurate
and repeatable measurements.
25. A GUIDE TO LOW RESISTANCE TESTING 23
Note: The Kelvin Bridge instrument, which has been
used to make measurements in the sub-micro-ohm
region, uses approximately 5 A of test current.
Autoranging
Autoranging capability in an instrument allows the operator
full use of the test probes. An autoranging instrument
automatically selects the range with the fullest use of
the display, providing the most sensitive reading for the
measurement and optimizing the resolution of the reading.
When taking a series of readings, the operator will be able to
maximize the use of his/her time.
Transformer Testing
Regular testing of transformers can help identify problems
that reduce system performance and can lead to unexpected
outages. The dc resistance of a transformer winding can
indicate the internal temperature of the winding when the
resistance at ambient is compared to the hot resistance. The
ideal test method is to make resistance readings at one-
minute intervals as the hot winding is cooling. When this data
is charted, the resistance at time zero can be estimated (see
Figure 19).
The typical test will indicate excessive overheating in the coils
due to fatigue or corrosion of the internal coil and/or the
internal connections. Low resistance testing on transformers
addresses small, medium, large single, large poly-phase and
auto-transformer windings. Tests are performed on:
Industry-standard test currents were originally developed
according to available technology in metering. With early
technology, enormous currents were needed in order to
develop a measurable voltage across a test sample with
negligible resistance. By Ohm’s Law, a typical meter of 1 milli-
volt full scale would require 100 amps in order to measure as
little as a micro-ohm. The micro-ohm being the preferred unit
of measurement for low-resistance testing, this made 100
amp testers the standard design for early instrumentation.
Unfortunately, this design made for testers that were large,
difficult to move, and of limited practicality in the field. The
development of cross-coil movements, with the balancing of
voltage and current in two separate coils driving the pointer,
produced a dramatic increase in sensitivity, and brought
workable test currents down to the familiar 10-Amp level. Of
course, microprocessors have further extended the sensitivity
of modern instruments. But this process is limited by the need
for adequate noise suppression. Low resistance ohmmeters
measure at levels several powers of ten lower than common
multimeters. Noise becomes large by comparison, and makes
noise suppression critical to the adequate function of the
instrument. The tester, therefore, must maintain an adequate
signal-to-noise ratio.
Testers with large current outputs are still widely used,
however, for testing specific types of equipment. The
limiting factor on the high end is principally the generation
of heat. Testing at too high a current can cause a heating
effect on the measurements, be injurious to the test item,
and even cause welding of contacts. Certain types of
equipment such as high voltage ac circuit breakers (see
IEC62271-100) have sufficiently large conductors and
areas of contact to carry currents of several hundred
amps without experiencing these harmful effects.
The demand for test current is critical when testing
coils, transformers or other magnetic components
due to the inductive characteristics of these types of
components. Industry standards, then, may call for
some specified high current. Such selection is typically
a compromise between various factors as discussed
above, with a view toward practicality, rather than
scientifically justified demands. Sophisticated testers
will automatically balance current against the load,
for maximum precision and minimum heat effect, so
that it is not necessary to impose specific, pre-selected
values on the test procedure. Some suppliers specify
200+ amps for SF6 breaker contacts in order to
overcome oxidation on the contact surfaces.
T 1 T 2 T 3
R 3
R 2
R 1
T 0
Extrapolate to Time Zero
for the hot resistance
of the winding
Figure 19: Resistance Graph of Cooling Transformer Windings - Heat Run
26. 24 A GUIDE TO LOW RESISTANCE TESTING
n Dual windings with the test current connected through the
windings in opposed polarities.
n Wye to wye windings with and without a neutral
connection; the leg of the other winding is connected to
the potential lead to measure the voltage at the internal
connection.
n Wye to delta windings; a jumper is used to connect the
current from the wye winding to the delta winding (this
test mode reduces the test time).
n Delta to delta windings; the test time can be improved
by connecting the current jumper to the primary and
secondary of the same phase in opposed polarities.
Taps are used to improve voltage regulation and are adjusted
daily. Excessive wear and loosening due to vibration can be
identified with low resistance measurements. Consecutive
tests can be performed on secondary tap changers (shorting
style of taps). Large transformers have many tap positions and
test time will be reduced, as the test current does not have to
be shut off between tests. Tests on primary taps (open taps)
must be performed as individual tests with the test current
shut off between tests.
The low resistance ohmmeter must have sufficient current
capacity to saturate the windings. The testing time will
depend on the available test current. Large transformers
require special attention prior to performing the tests. The
insulation between the windings will store energy, similar to
the dielectric in a cable, and must be discharged before a test
can be performed.
When testing three-phase transformers, interaction
will occur between the primary and secondary
windings. This situation will be most evident when
testing transformers with wye and delta windings, and
can be minimized by connecting the test current to
flow through both primary and secondary windings.
The net effect is to reduce the mutual coupling
between the windings and minimize the flow of
circulating current in the delta winding.
Test current should be limited to the magnetizing
current, which is about 1% of the full load current.
The lower test currents reduce stress in the magnetic
core of the winding. Large test currents produce large
forces on the core and may cause damage.
Bar to Bar Testing
Helical spring point probes are used to measure the value
of the bar to bar resistances of the rotor in a dc motor
(see previous Figure 2). This test is typically performed at
the 10 Amp current level with the typical coil resistance
measurements in the 6000 micro-ohm range. These tests
identify broken/loose welds or solder connections between
the coils and commutator bars. The resistance measurements
should remain consistent. Readings may be higher on a
heated motor, due to the temperature of the coils. As the
coils cool, the resistance values may drop to some prior
reference value recorded at ambient temperature.
Figure 20 shows a lap winding, a style where the windings
are connected to bars laying next to each other. To make a
test, the current probe should be placed at the end of the
commutator bar and the potential probe should be placed at
the connection to the winding (the riser on the commutator
bar). The operator measures the resistance of the windings
between each set of bars being tested (1-2, 2-3, 3-4, etc.). In
this example, there is a possible weak solder joint between
bars 4 and 5, and a break in the coil between bars 12 and 13
(the instrument will indicate this as an open).
In Figure 21 (lap winding, 24 coils), all the coils are connected
in series. The resistance of each coil will be measured with
the resistance of all of the other coils connected in parallel.
The primary question for the operator is what constitutes an
acceptable reading for a specific coil (Rm) since the remaining
23 coils in parallel will lower the resistance of the coil being
Open0.0230.0240.0230.0230.0240.0240.0230.1230.0240.0230.023Value
12-1311-1210-119-108-97-86-75-64-53-42-31-2Bars
1 2 3 4 5 6 7 8 9 10 11 12 13
C
P
Commutator Bars
C
P
Break in Coil
Figure 20: Testing a Lap Winding
27. A GUIDE TO LOW RESISTANCE TESTING 25
tested. For this example, we will assume that the resistance
of the coil before insertion into the motor (Rc) was 1.00 ohm.
The expected resistance can be calculated by the equation:
Expected Rm = (Rc)(# of coils being tested)(# of coils in
parallel)/(# of coils being tested + # of coils in parallel).
In this example:
Expected Rm = (1.00 ohm)(1)(23)/(1 + 23)
Expected Rm = .958 ohm
Figure 22 shows a wave winding, another manufacturing
technique for putting high resistance coils in a motor. In this
example, the coil runs from commutator bar 1 to 6 to 11 to
16 and then loops back around the armature to commutator
bar 2 (connected in series). When the operator measures
between bars 1 and 2, he/she is checking the resistance of the
wave wound coil (the complete loop). In this example,
there is a break in the coil between bars 12 and 17.
This problem will appear when measuring bars 2 and
3, since they are the beginning and end bars of the
loop.
Figure 23 shows wave winding commutator
connections to the internal coils and test probe
connections to individual commutator bars. This is a
simplified layout, as the heavy ring shows the series
connections for all the coils in the armature. A dc
motor will have a different number of coils depending
on the horse power and the voltage rating. In this
example (testing from bar #1 to bar #2), two coils
are in series and nineteen are in parallel. If one coil is
open in the ring, the measurement from bar #1 to bar
#2 will be the series value of the two coils. If the test
probes are across the open coil, the total resistance of
the other nineteen coils will be displayed.
Battery Strap Testing
When testing battery straps, the operator should have
baseline values or targets to compare against the actual
results. Following are several examples of how these target
levels are determined.
Rm
Rm = resistance measured at
the commutator's surface
’
Figure 21: Commutator with 24 Coils in Series
0.50.50.50.50.50.50.50.50.50.50.50.50.50.5Open0.5
16-1715-1614-1513-1412-1311-1210-119-108-97-86-75-64-53-42-31-2
1 2 3 4 5 6 7 8 9 10 11 12 13 14 15 16 17
Connections loop
around the armature
to the second bar
End of the circuit
from the first bar
C
P
C
P
Figure 22: Testing a Wave Winding
21
11
1 12
2
13
3
14
4
15
5
16
617
10
20
9
19
8
18
7
Figure 23 Coil Arrangement in a Wave Winding
28. 26 A GUIDE TO LOW RESISTANCE TESTING
In the first example (see Figure 24), the operator is measuring
the resistance (R0) across a single battery strap (both sides
of the terminal). The straps on each side of the terminal
have a resistance of 20 micro-ohm and the connections to
the terminals each have a resistance of 5 micro-ohm. Under
these conditions, the target resistance that the operator
wants to see is 15 micro-ohm. A significant variance from
this resistance in the actual reading would indicate loose
connection.
The second example (see Figure 25) shows terminals
connected in parallel by carrier strips with a resistance of
100 micro-ohms. In this case, the target resistance that the
operator wants to see is 14 micro-ohms.
If there were an open strap between terminal “a” and
terminal “b,” the resistance reading would be significantly
higher than the target, as follows:
Ra-b = Ra-c + Rc-d + Rb-d
Ra-b = 100 + 15 + 100
Ra-b = 215 µΩ
Additional tests can be performed between the same polarity
terminals on a cell. Such a test will help determine the quality
of the terminal-to-bar welds and major problems with the
internal bar to which the plates are welded, as all are series
connected. In this example, the measured resistance between
like terminals on the same cell should be in the 100 micro-
ohm range.
Figure 24: Single Strap Resistance Target
Cell #1 Cell #2
(+) (-)
C1 P1 P2 C2
+
20
20
55 + R0
20
20
5
5
5
5
R0 =
(5+20+5)(5+20+5)
(5+20+5)+(5+20+5)
R0 =
900
60
R0 = 15
+
20
20
55
+
20
20
55
100 100
+ R01
20
20
5
5
5
5
+ R02
20
20
5
5
5
5
a b
c d
Independent set of straps:
R01 = 15
R01 = R02
Parallel sets of terminals:
Ra-b=
(Ra-c + Rc-d + Rb-d) x R01
(Ra-c + Rc-d + Rb-d) + R01
Ra-b=
(100 + 15 + 100) x 15
(100 + 15 + 100) + 15
Ra-b = 14
Figure 25: Parallel Strap Resistance Target
29. A GUIDE TO LOW RESISTANCE TESTING 27
Wheatstone and Kelvin Bridges
Wheatstone Bridge
A pioneering method for measuring resistance was devised
in 1833 by S. H. Christie and made public by Sir Charles
Wheatstone. The simplest arrangement is a square pattern
of four resistors with a galvanometer connected across one
diagonal and a battery across the other (see Figure 26). Two
of the resistors are of known appropriate values and comprise
the ratio arm (A + B). A third has a known value which can
be varied in small increments over a wide range, and is thus
designated the rheostat arm (R). The fourth is the resistance
being measured, the unknown arm (X).
The bridge is considered balanced when the rheostat arm has
been adjusted (tweaked) so that current is divided in such a
way that there is no voltage drop across the galvanometer
and it ceases to deflect (is nulled). The resistance being
measured can then be calculated from a knowledge of the
values of the ratio resistors and the adjusted value of the
rheostat arm. The basic formula is:
X = B/A x R
Where:
B and A are the ratio resistors
R is the rheostat
The Wheatstone Bridge can be constructed to a variety
of ranges and is generally used for all but the highest and
lowest measurements. It is suited to a range of about 1 to
100,000 ohms.
Kelvin Bridge
The Kelvin Bridge (also known as the Thomson Bridge) is
used for precision measurements below the typical range of
the Wheatstone Bridge. Sir William Thomson (Lord Kelvin)
devised the concept circa 1854. The classic arrangement has
six resistors in a rectangle, bisected by a galvanometer (see
Figure 27). A comparatively large current is passed through
the unknown resistance and a known resistance of a low
value. The galvanometer compares the voltage drops across
these two resistances with the double-ratio circuit comprised
of the other four resistors.
G
A B
X R
Figure 26: Wheatstone Bridge circuitvii
vii Electrical Meterman’s Handbook; Third Edition; 1965; page 479
vii Electrical Meterman’s Handbook; Third Edition; 1965; page 480
G
A B
X RY
a b
Figure 27: Kelvin Bridge Circuitviii