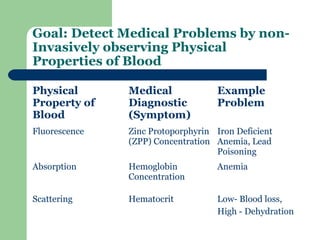
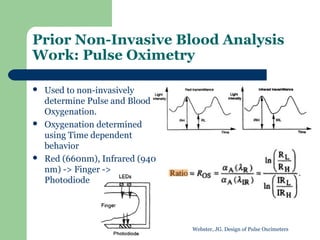
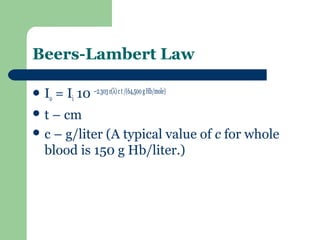
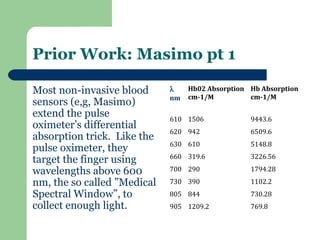
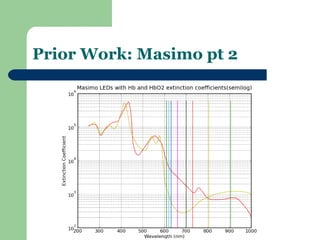
Improving Non-Invasive Blood
Analysis by Expanding the Medical
         Spectral Window


                Katherine Paseman
Goal: Detect Medical Problems by non-
Invasively observing Physical
Properties of Blood

Physical       Medical             Example
Property of    Diagnostic          Problem
Blood          (Symptom)
Fluorescence   Zinc Protoporphyrin Iron Deficient
               (ZPP) Concentration Anemia, Lead
                                   Poisoning
Absorption     Hemoglobin          Anemia
               Concentration

Scattering     Hematocrit          Low- Blood loss,
                                   High - Dehydration
Prior Non-Invasive Blood Analysis
Work: Pulse Oximetry

   Used to non-invasively
    determine Pulse and Blood
    Oxygenation.
   Oxygenation determined
    using Time dependent
    behavior
   Red (660nm), Infrared (940
    nm) -> Finger ->
    Photodiode


                                 Webster, JG. Design of Pulse Oxcimeters
Beers-Lambert Law

 Io   = Ii 10 –2.303 ε(λ) c t /(64,500 g Hb/mole)
t  – cm
 c – g/liter (A typical value of c for whole
  blood is 150 g Hb/liter.)
Prior Work: Masimo pt 1

Most non-invasive blood      λ    Hb02 Absorption Hb Absorption
                             nm   cm-1/M          cm-1/M
sensors (e,g, Masimo)
extend the pulse             610 1506             9443.6
oximeter’s differential
                             620 942              6509.6
absorption trick. Like the
                             630 610              5148.8
pulse oximeter, they
                             660 319.6            3226.56
target the finger using
wavelengths above 600        700 290              1794.28

nm, the so called ”Medical   730 390              1102.2
Spectral Window”, to         805 844              730.28
collect enough light.        905 1209.2           769.8
Prior Work: Masimo pt 2
Prior Work: Samsung pt 1
Samsung’s attempt to use lower      λ     Hb02 Absorption Hb Absorption
  wavelengths produced this               cm-1/M          cm-1/M
  comment:
G Yoon <gyoon@snut.ac.kr> -
  569nm is highly absorbing in      569 44496             45072
  tissue and, at the same time,
  569nm intensity is small          660   319.6           3226.56
  compared with that at longer
  wavelength. That is why you
  may not get good signal. We       805   844             730.28
  used a custom-made LED array
  that has several chips of 569nm   940   1214            693.44
  to increase intensity.
                                    975   1144            389.288
Prior Work: Samsung pt 2
Our Research: Target Thumb Webbing
for Absorption instead of Finger

   Our idea is to extend the medical
    spectral window by targeting the
    thumb webbing for absorption
    ([Sabrina Paseman 2008] did
    this for fluorescence)
   Our hypothesis is that we can get
    better measurements than
    Samsung with a wider spectrum
    of wavelengths by offsetting the
    increase in extinction coefficient
    with the decrease in sample
    thickness.
   Interrogating thumb webbing
    would give us a wider window in
    which to view medical problems
Implications

Increasing the size of the window would allow us to:
 Detect Sources of error in Samsung’s work
 See if there is a statistically significant difference
  between the light absorption of systolic and diastolic
  blood at 569, 660, 805, 940 and 975 nm.
 See if there is a statistically significant difference
  between the fluorescence of systolic and diastolic
  blood excited at 425 nm.
The Apparatus
   We’ve created an adjustable width clip
    that fits either the subject’s index
    finger or thumb webbing.
   One end of the clip holds the same 5-
    LED package used by Samsung and the
    other holds a fiber optic cable which
    connects to a spectrometer.
   This allows us to double check the
    LED’s wavelength, determine its
    intensity, and observe any swamping
    of fluorescing effects.
   Samsung’s work specifies “Three
    variables of R569,805, R569,940, and
    R569,975 were used for calibration and
    prediction models. It means that four
    wavelengths were used in hematocrit
    monitoring.” It is for this reason we
    look specifically at 569nm
Experimental Approach 1

   Clamp is adjusted to fit the subject’s index finger.
    Subject removes finger so distance between
    spectrometer and LED can be measured with a
    micrometer.
   Thumb webbing is placed over the entire LED,
    integration time is adjusted and data is collected.
   Subject removes thumb webbing and places index
    finger over LED. Data is collected with the same
    integration time and plotted on the same axis for
    comparison
Data: 569 nm Subject 1

                             Thumb webbing
                             Index Finger
       54054.5 counts

                           Integration Time: 404.05 ms


                           Width: 0.7175 cm


           4131.5 counts
Findings

   Transmission increases 13 fold
   Samsung’s LED chip has an artifact at around 875nm
    when the 569nm LED is lit. If their device uses a
    photodiode to collect light, especially at low
    intensities, much of the collected light would come
    from the artifact rather than the 569nm absorption
   This method limited the quality of the readings we
    could take from subjects with darker skin
Experimental Approach 2

 Hold  led underneath the thumb webbing and
  the spectrometer on the other side.
 Re-integrate the spectrometer and record the
  integration time. Capture the graph.
 For data analysis, find the ratio between the
  ratios of the peak counts at 569nm and the
  integration time               Counts    thumb webbing
                                  Integration timethumb webbing
             Absorption Ratio =
                                  Countsindex finger
                                  Integration timeindex finger
Data: 569 nm Subject 1 Finger

                                Index Finger

                             Integration Time: 3097.90 ms


          13640.500 counts
Data: 569 nm Subject 1 Webbing

                            Thumb Webbing

                         Integration Time: 99.70 ms


      32847.801 counts
Data: 569 nm Subject 2 Finger

                                Index Finger

                             Integration Time: 1736.15 ms


          61598.500 counts
Data: 569 nm Subject 2 Webbing

                              Thumb Webbing

        60849.000 counts   Integration Time: 208.91 ms
Data: 569 nm Subject 3 Finger

                              Index Finger

        60534.000 counts   Integration Time: 3808.11 ms
Data: 569 nm Subject 3 Webbing

                              Thumb Webbing

        55602.750 counts   Integration Time: 114.73 ms
Data: 569 nm


Subject Countstw    Integrationtw Countsif    Integrationif Ratio
                    (ms)                      (ms)

1       32847.801   99.70         13640.500 3097.90        74.825
2       60849.000   208.91        61598.500   1736.15      8.209
3       55602.750   114.73        60534.000 3808.11        30.488
Conclusions

 Transmission  increases across the board but
  varies from subject to subject
 Our suspicions about the artifact are affirmed
  by our second set up
Further Research

 Collectdata for more subjects with varying
  melanin contents
 Observe wavelengths other than 569 nm
 Investigate the potential for finding pulse
  readings through thumb webbing

Expanding the medical spectral window v3

  • 1.
    Improving Non-Invasive Blood Analysisby Expanding the Medical Spectral Window Katherine Paseman
  • 2.
    Goal: Detect MedicalProblems by non- Invasively observing Physical Properties of Blood Physical Medical Example Property of Diagnostic Problem Blood (Symptom) Fluorescence Zinc Protoporphyrin Iron Deficient (ZPP) Concentration Anemia, Lead Poisoning Absorption Hemoglobin Anemia Concentration Scattering Hematocrit Low- Blood loss, High - Dehydration
  • 3.
    Prior Non-Invasive BloodAnalysis Work: Pulse Oximetry  Used to non-invasively determine Pulse and Blood Oxygenation.  Oxygenation determined using Time dependent behavior  Red (660nm), Infrared (940 nm) -> Finger -> Photodiode Webster, JG. Design of Pulse Oxcimeters
  • 4.
    Beers-Lambert Law  Io = Ii 10 –2.303 ε(λ) c t /(64,500 g Hb/mole) t – cm  c – g/liter (A typical value of c for whole blood is 150 g Hb/liter.)
  • 5.
    Prior Work: Masimopt 1 Most non-invasive blood λ Hb02 Absorption Hb Absorption nm cm-1/M cm-1/M sensors (e,g, Masimo) extend the pulse 610 1506 9443.6 oximeter’s differential 620 942 6509.6 absorption trick. Like the 630 610 5148.8 pulse oximeter, they 660 319.6 3226.56 target the finger using wavelengths above 600 700 290 1794.28 nm, the so called ”Medical 730 390 1102.2 Spectral Window”, to 805 844 730.28 collect enough light. 905 1209.2 769.8
  • 6.
  • 7.
    Prior Work: Samsungpt 1 Samsung’s attempt to use lower λ Hb02 Absorption Hb Absorption wavelengths produced this cm-1/M cm-1/M comment: G Yoon <gyoon@snut.ac.kr> - 569nm is highly absorbing in 569 44496 45072 tissue and, at the same time, 569nm intensity is small 660 319.6 3226.56 compared with that at longer wavelength. That is why you may not get good signal. We 805 844 730.28 used a custom-made LED array that has several chips of 569nm 940 1214 693.44 to increase intensity. 975 1144 389.288
  • 8.
  • 9.
    Our Research: TargetThumb Webbing for Absorption instead of Finger  Our idea is to extend the medical spectral window by targeting the thumb webbing for absorption ([Sabrina Paseman 2008] did this for fluorescence)  Our hypothesis is that we can get better measurements than Samsung with a wider spectrum of wavelengths by offsetting the increase in extinction coefficient with the decrease in sample thickness.  Interrogating thumb webbing would give us a wider window in which to view medical problems
  • 10.
    Implications Increasing the sizeof the window would allow us to:  Detect Sources of error in Samsung’s work  See if there is a statistically significant difference between the light absorption of systolic and diastolic blood at 569, 660, 805, 940 and 975 nm.  See if there is a statistically significant difference between the fluorescence of systolic and diastolic blood excited at 425 nm.
  • 11.
    The Apparatus  We’ve created an adjustable width clip that fits either the subject’s index finger or thumb webbing.  One end of the clip holds the same 5- LED package used by Samsung and the other holds a fiber optic cable which connects to a spectrometer.  This allows us to double check the LED’s wavelength, determine its intensity, and observe any swamping of fluorescing effects.  Samsung’s work specifies “Three variables of R569,805, R569,940, and R569,975 were used for calibration and prediction models. It means that four wavelengths were used in hematocrit monitoring.” It is for this reason we look specifically at 569nm
  • 12.
    Experimental Approach 1  Clamp is adjusted to fit the subject’s index finger. Subject removes finger so distance between spectrometer and LED can be measured with a micrometer.  Thumb webbing is placed over the entire LED, integration time is adjusted and data is collected.  Subject removes thumb webbing and places index finger over LED. Data is collected with the same integration time and plotted on the same axis for comparison
  • 13.
    Data: 569 nmSubject 1 Thumb webbing Index Finger 54054.5 counts Integration Time: 404.05 ms Width: 0.7175 cm 4131.5 counts
  • 14.
    Findings  Transmission increases 13 fold  Samsung’s LED chip has an artifact at around 875nm when the 569nm LED is lit. If their device uses a photodiode to collect light, especially at low intensities, much of the collected light would come from the artifact rather than the 569nm absorption  This method limited the quality of the readings we could take from subjects with darker skin
  • 15.
    Experimental Approach 2 Hold led underneath the thumb webbing and the spectrometer on the other side.  Re-integrate the spectrometer and record the integration time. Capture the graph.  For data analysis, find the ratio between the ratios of the peak counts at 569nm and the integration time Counts thumb webbing Integration timethumb webbing Absorption Ratio = Countsindex finger Integration timeindex finger
  • 16.
    Data: 569 nmSubject 1 Finger Index Finger Integration Time: 3097.90 ms 13640.500 counts
  • 17.
    Data: 569 nmSubject 1 Webbing Thumb Webbing Integration Time: 99.70 ms 32847.801 counts
  • 18.
    Data: 569 nmSubject 2 Finger Index Finger Integration Time: 1736.15 ms 61598.500 counts
  • 19.
    Data: 569 nmSubject 2 Webbing Thumb Webbing 60849.000 counts Integration Time: 208.91 ms
  • 20.
    Data: 569 nmSubject 3 Finger Index Finger 60534.000 counts Integration Time: 3808.11 ms
  • 21.
    Data: 569 nmSubject 3 Webbing Thumb Webbing 55602.750 counts Integration Time: 114.73 ms
  • 22.
    Data: 569 nm SubjectCountstw Integrationtw Countsif Integrationif Ratio (ms) (ms) 1 32847.801 99.70 13640.500 3097.90 74.825 2 60849.000 208.91 61598.500 1736.15 8.209 3 55602.750 114.73 60534.000 3808.11 30.488
  • 23.
    Conclusions  Transmission increases across the board but varies from subject to subject  Our suspicions about the artifact are affirmed by our second set up
  • 24.
    Further Research  Collectdatafor more subjects with varying melanin contents  Observe wavelengths other than 569 nm  Investigate the potential for finding pulse readings through thumb webbing