Walsack, Phil, MPUA, Baseline Statistics Demographic Trends State of the State, MECC, Kansas City
•
1 like•629 views

Walsack Phil MPUA Baseline Statistics Demographic Trends State of the State MECC Kansas City May 11-13 Overland Park

Recommended
More Related Content
Similar to Walsack, Phil, MPUA, Baseline Statistics Demographic Trends State of the State, MECC, Kansas City
Similar to Walsack, Phil, MPUA, Baseline Statistics Demographic Trends State of the State, MECC, Kansas City (20)
More from Kevin Perry
More from Kevin Perry (20)
Recently uploaded
Recently uploaded (20)
Walsack, Phil, MPUA, Baseline Statistics Demographic Trends State of the State, MECC, Kansas City
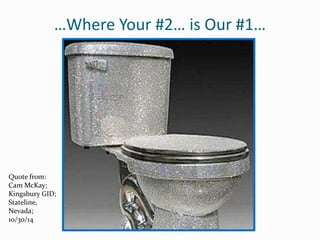
- 1. …Where Your #2… is Our #1… Quote from: Cam McKay; Kingsbury GID; Stateline, Nevada; 10/30/14
- 2. State of the State
- 3. Missouri 68,886 = Land area in square miles 2,747 = Land area inside municipal limits in square miles 4% = Land area inside municipalities 96% = Land area outside of municipalities 5,998,900 = Population (2010 U.S. Census Data) 6,063,600 = Population (2014 U.S. Census QuickFact) 3,959,616 = Population of Missouri municipalities 65.3% = Municipal Population of Missouri 34.7% = Non-Municipal Population of Missouri
- 4. Missouri 974 = Number of communities with population >100 people. 799 = Number of communities with population totals between 100 and 3,500 people. 4th = Missouri’s rank nationally of number of smaller communities. (less than 1,000 people) 658 = Number of cities. 13 = Number of cities with populations >50,000 people. $47,764 = Median Household Income (2010-2014 U.S. Census QuickFact)
- 5. Population Trends of Missouri 44 = Counties north of the Missouri River 34 = Counties have lost population for the past 100 years (1900 to 2000). 6 = Counties have had periods of both gaining and losing populations from the 1900 baseline. 4 = Counties have had growing populations every decennial over the past 100 years Audrain Boone Clay St. Charles
- 6. Population Trends of Missouri 44 = Counties north of the Missouri River 34 = Counties have lost population for the past 100 years (1900 to 2000). Counties with tough population hardships: 1900 2000 Chariton 26,800 8,400 Shelby 16,200 6,700 Gentry 20,500 6,500 Mercer 14,100 2,700
- 7. Population Trends of Missouri 28 = Counties south of the Missouri River & north of Interstate 44. 18 = Counties have lost population for the past 100 years (1900 to 2000), including: Bates Barton Benton Cedar Cooper Dade Dallas Henry Hickory Lafayette Lawrence Maries Moniteau Osage Polk St. Clair Saline Vernon
- 8. State of the Sewers
- 9. The 2012 Clean Watersheds Needs Survey was scheduled to be released in July 2014. The release was postponed until after the mid-term elections in the Fall of 2014.
- 10. The 2012 Clean Watersheds Needs Survey was scheduled to be released in July 2014. Then, the release was postponed until after the Christmas Holidays of 2014.
- 11. The 2012 Clean Watersheds Needs Survey was scheduled to be released in July 2014. Then, the release was postponed until after the Office of Management & Budget made its comments on the Survey during the first quarter of 2015.
- 12. The 2012 Clean Watersheds Needs Survey was scheduled to be released in July 2014. Then, the release was postponed until after the Office of Management & Budget made its comments on the Survey during the first quarter of 2015….then it languished!
- 13. Playing politics with our pipes is not productive when we need to uncover the facts about the state of our wastewater infrastructure and tell the truth to our rate-payers.
- 14. The 2012 Clean Watersheds Needs Survey was released in January 2016.
- 15. Clean Watersheds Needs Survey 2008 Survey (released in 2010) $298.1 Billion National Needs (from 2008 to 2028) 2012 Survey (released in 2016) $271.0 Billion National Needs (from 2012 to 2017)
- 16. Past Clean Watersheds Needs Survey USEPA 2008 Needs Survey (released in 2010) $298.1 Billion Nation-wide (from 2008 to 2028) $5.19B Missouri’s share. Missouri ranked 14th neediest overall. Missouri ranked worst in the nation (i.e., most needy) in inflow/infiltration correction, at $1.25B in need.
- 17. Newest Clean Watersheds Needs Survey USEPA 2012 Needs Survey (released in 2016) $271.0 Billion Nation-wide (from 2012 to 2017) $9.59B Missouri’s share (Categories I-V). Missouri ranked 6th neediest overall.
- 18. Clean Watersheds Needs Survey Category I: Secondary Wastewater Treatment: Biochemical Oxygen Demand (BOD) and Total Suspended Solids (TSS) effluent levels to attain 30 mg/L. $2.08B Missouri’s share. Missouri ranked 6th neediest.
- 19. Clean Watersheds Needs Survey Category II: Advanced Wastewater Treatment: Biochemical Oxygen Demand (BOD) and Total Suspended Solids (TSS) effluent levels to attain 20 mg/L; stringent limits for ammonia, nitrogen, phosphorus, metals, and man-made synthetic organics. $297M Missouri’s share. Missouri ranked 30th neediest.
- 20. Clean Watersheds Needs Survey Category III-B: Conveyance System Repair - Sewer Replacement & Rehabilitation $347M Missouri’s share. Missouri ranked 29th in need.
- 21. Clean Watersheds Needs Survey Category III-A: Conveyance System Repair - I/I Correction $1.14B Missouri’s share. Missouri ranked 1st in need.
- 22. Crunching the Numbers Of the $1.493B addressed in the Clean Watersheds Needs Survey for Missouri’s total Category III-A and III-B Needs (Collections Systems), five larger cities take up $1.206B of the need. Jefferson City, Kansas City, St. Joseph, St. Louis, and Springfield. That leaves just $287M for the rest of Missouri.
- 23. Digging Deep into the Numbers That $287M is claimed by only 71 communities. But Missouri has 747 communities eligible for state funding (SRF). That means that just 9.7% of Missouri communities claim, and can document that, they have a I/I correction need.
- 24. Coloring by Number with Phil How many miles of collection piping are there in Missouri? No one knows …not even me.
- 25. Coloring by Number with Phil How many miles of collection piping are there in Missouri? No one knows…not even me. But I am closing in on that long-ignored number. As of yesterday, there are 24,581 collection system pipe miles confirmed.
- 26. Phil’s “Guess-estimate” is 26,000 miles Holes to fill in the dataset: 98 satellite system are MIA. 22 cities with populations >3,500 people are unaccounted for. 216 very small cities, towns, and villages do not know how many miles of sewer piping they have…they just don’t know.
- 27. Rehabilitating 26,000 pipe miles If a cost of $172,000/mile (from the semi-urban cities in their Bypass Elimination Plans) is used as the high end of a range. And a cost of $104,635 (from the urban cities in the 2012 Clean Watersheds Needs Survey) is used as a low end of a range. Then…
- 28. Rehabilitating 26,000 pipe miles An estimated rehabilitation cost ranges between $4.23B to $2.75B. This estimate is much more realistic, and higher, than the 2012 USEPA’s Needs Survey value of $1.42B.
- 29. The Only Way…Grind it out!
- 32. Phil Walsack Missouri Public Utility Alliance 1808 I-70 Drive SW Columbia, MO 65203 573-445-3279 pwalsack@mpua.org
- 33. Quit Covering Your Assets with Asphalt!