The Five Largest Foreign-Born Groups in Massachusetts
•Download as PPTX, PDF•
0 likes•110 views

The spatial distribution of the five largest foreign-Born groups in Massachusetts.

Recommended
More Related Content
Similar to The Five Largest Foreign-Born Groups in Massachusetts
Similar to The Five Largest Foreign-Born Groups in Massachusetts (20)
More from Instituto Diáspora Brasil (IDB)
More from Instituto Diáspora Brasil (IDB) (20)
Recently uploaded
Recently uploaded (20)
The Five Largest Foreign-Born Groups in Massachusetts
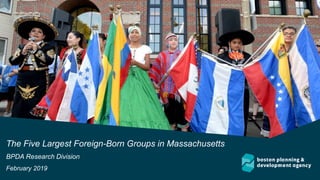
- 1. The Five Largest Foreign-Born Groups in Massachusetts BPDA Research Division February 2019
- 2. Produced by the BPDA Research Division: Alvaro Lima – Director Jonathan Lee – Deputy Director Christina Kim – Senior Research Associate Phillip Granberry – Senior Researcher/Demographer Matthew Resseger – Senior Researcher/Economist Kevin Kang – Research Associate Kelly McGee – Research Manager Jing Chen – Research Assistant Avanti Krovi — Research Assistant Interns: Dilara Sisman & Ahsim Shaaban The BPDA Research Division strives to understand the current environment of the city to produce quality research and targeted information that will inform and benefit the residents and businesses of Boston. The Division conducts research on Boston’s economy, population, and commercial markets for all departments of the BPDA, the City of Boston, and related organizations. The information provided in this report is the best available at the time of publication. All or partial use of this report must be cited. Our preferred citation is as follows: Boston Planning and Development Agency Research Division, January 2019 More research produced by the Boston Planning and Development Agency can be found on the BPDA Research Website: Research Publications Research requests can be made through the BPDA Research Division’s Research Inquiries. 2 Director, Brian P. Golden Cover photo: August 25th, 2017 - Mayor Martin J. Walsh and the Mayor’s Office for Immigrant Advancement unveiled a mural completed in collaboration with the Mayor’s Mural Crew as part of the “To Immigrants With Love” public art campaign. (City of Boston Mayor's Office)
- 3. Origins: 66% from Latin America and Asia Over 34% of immigrants come from five countries: 1. China ( 9.6% ) 2. Dominican Republic ( 7.7% ) 3. India ( 6.0% ) 4. Brazil (5.9%) 5. Portugal ( 5.0% ) 3 Massachusetts is home to over 1 million foreign born residents 21% 30% 9% 36% 3% Regions of Origin Europe Asia Africa Latin America Other Source: U.S Census Bureau, 2013-2017 American Community Survey 5-Year Estimates
- 4. 4 Immigrants in Massachusetts Source: U.S. Census Bureau, 1980 &1990 Decennial Census, Public Use Microdata Areas (PUMAs) Database; U.S. Census Bureau 2000 Decennial Census; U.S Census Bureau, 2013-2017 American Community Survey 5-Year Estimates. The Number of Immigrants in Massachusetts by Year - 200,000 400,000 600,000 800,000 1,000,000 1,200,000 1980 1990 2000 2017
- 5. 5 Immigrants in Massachusetts Top 10 Cities with Highest Immigrant Population • Boston (189,680) • Worcester (38,932) • Lynn (32,318) • Cambridge (31,305) • Lawrence (31,204) • Lowell (29,651) • Quincy (29,323) • Brockton (26,569) • Malden (26,485) • Revere (19,940) Source: U.S. Census Bureau, 2013-2017 American Community Survey 5-Year Estimates. Source: U.S. Census Bureau, 1980 &1990 Decennial Census, Public Use Microdata Areas (PUMAs) Database; U.S. Census Bureau 2000 Decennial Census; U.S Census Bureau, 2013-2017 American Community Survey 5-Year Estimates.
- 6. 6 Brazilian Immigrants The Number of Brazilian Immigrants in Massachusetts by Year Source: U.S. Census Bureau, 1980 &1990 Decennial Census, Public Use Microdata Areas (PUMAs) Database; U.S. Census Bureau 2000 Decennial Census; U.S Census Bureau, 2013-2017 American Community Survey 5-Year Estimates. 2,260 10,857 36,669 65,111 - 10,000 20,000 30,000 40,000 50,000 60,000 70,000 1980 1990 2000 2017
- 7. 7 Brazilian Immigrants Top 10 Cities and Towns with the Most Massachusetts's Residents Born in Brazil* • Framingham (6,083) • Everett (4,183) • Boston (3,835) • Marlborough (3,163) • Lowell (2,988) • Malden (2168) • Somerville (2,108) • Worcester (1,804) • Revere (1,804) • Barnstable (1,693) Note: The numbers do not include the residents born in Brazil of American parent(s). Source: U.S. Census Bureau, 2013-2017 American Community Survey 5-Year Estimates. Source: U.S. Census Bureau, 1980 &1990 Decennial Census, Public Use Microdata Areas (PUMAs) Database; U.S. Census Bureau 2000 Decennial Census; U.S Census Bureau, 2013-2017 American Community Survey 5-Year Estimates.
- 8. 8 Chinese Immigrants Source: U.S. Census Bureau, 1980 &1990 Decennial Census, Public Use Microdata Areas (PUMAs) Database; U.S. Census Bureau 2000 Decennial Census; U.S Census Bureau, 2013-2017 American Community Survey 5-Year Estimates. 14,960 31,929 54,450 104,840 - 20,000 40,000 60,000 80,000 100,000 120,000 1980 1990 2000 2017 The Number of Chinese Immigrants in Massachusetts by Year
- 9. 9 Chinese Immigrants Top 10 Cities and Towns with the Most Massachusetts's Residents Born in China* • Boston (21,386) • Quincy (12,537) • Malden (6,092) • Newton (4,238) • Cambridge (4,045) • Brookline (3,330) • Waltham (2,678) • Lexington (2,476) • Worcester city (1,807) • Medford city (1,772) Note: The numbers do not include the residents born in China of American parent(s). Source: U.S. Census Bureau, 2013-2017 American Community Survey 5-Year Estimates. Source: U.S. Census Bureau, 1980 &1990 Decennial Census, Public Use Microdata Areas (PUMAs) Database; U.S. Census Bureau 2000 Decennial Census; U.S Census Bureau, 2013-2017 American Community Survey 5-Year Estimates.
- 10. 10 Dominican Immigrants Source: U.S. Census Bureau, 1980 &1990 Decennial Census, Public Use Microdata Areas (PUMAs) Database; U.S. Census Bureau 2000 Decennial Census; U.S Census Bureau, 2013-2017 American Community Survey 5-Year Estimates. 5,580 19,420 46,744 84,526 - 10,000 20,000 30,000 40,000 50,000 60,000 70,000 80,000 90,000 1980 1990 2000 2017 The Number of Dominican Immigrants in Massachusetts by Year
- 11. 11 Dominican Immigrants Top 10 Cities and Towns with the Most Massachusetts's Residents Born in Dominican Republic* • Lawrence (24,569) • Boston (21,200) • Lynn (8,271) • Methuen (4,251) • Worcester (3,129) • Salem city (2,494) • Springfield (2,375) • Haverhill (1,862) • Lowell (1,423) • Peabody (1,147) Note: The numbers do not include the residents born in Dominican Republic of American parent(s). Source: U.S. Census Bureau, 2013-2017 American Community Survey 5-Year Estimates. Source: U.S. Census Bureau, 1980 &1990 Decennial Census, Public Use Microdata Areas (PUMAs) Database; U.S. Census Bureau 2000 Decennial Census; U.S Census Bureau, 2013-2017 American Community Survey 5-Year Estimates.
- 12. 12 Portuguese Immigrants Source: U.S. Census Bureau, 1980 &1990 Decennial Census, Public Use Microdata Areas (PUMAs) Database; U.S. Census Bureau 2000 Decennial Census; U.S Census Bureau, 2013-2017 American Community Survey 5-Year Estimates. 60,600 58,154 66,627 54,605 - 10,000 20,000 30,000 40,000 50,000 60,000 70,000 1980 1990 2000 2017 The Number of Portuguese Immigrants in Massachusetts by Year
- 13. 13 Portuguese Immigrants Top 10 Cities and Towns with the Most Massachusetts's Residents Born in Portugal* • Fall River city (10,771) • New Bedford (9,826) • Taunton (3,267) • Dartmouth (2,384) • Ludlow (1,804) • Lowell city (1,602) • Somerville (1,563) • Somerset (1,422) • Peabody (1,282) • Swansea (1,190) Note: The numbers do not include the residents born in Portugal of American parent(s). Source: U.S. Census Bureau, 2013-2017 American Community Survey 5-Year Estimates. Source: U.S. Census Bureau, 1980 &1990 Decennial Census, Public Use Microdata Areas (PUMAs) Database; U.S. Census Bureau 2000 Decennial Census; U.S Census Bureau, 2013-2017 American Community Survey 5-Year Estimates.
- 14. 14 Indian Immigrants Source: U.S. Census Bureau, 1980 &1990 Decennial Census, Public Use Microdata Areas (PUMAs) Database; U.S. Census Bureau 2000 Decennial Census; U.S Census Bureau, 2013-2017 American Community Survey 5-Year Estimates. 4,820 11,779 28,086 65,501 - 10,000 20,000 30,000 40,000 50,000 60,000 70,000 1980 1990 2000 2017 The Number of Indian Immigrants in Massachusetts by Year
- 15. 15 Indian Immigrants Top 10 Cities and Towns with the Most Massachusetts's Residents Born in India* • Boston (4,608) • Shrewsbury (2,883) • Quincy (2,292) • Lowell (2,211) • Cambridge (2,195) • Westborough (2,138) • Burlington (2,054) • Waltham (1,973) • Acton (1,805) • Malden (1,774) Note: The numbers do not include the residents born in India of American parent(s). Source: U.S. Census Bureau, 2013-2017 American Community Survey 5-Year Estimates. Source: U.S. Census Bureau, 1980 &1990 Decennial Census, Public Use Microdata Areas (PUMAs) Database; U.S. Census Bureau 2000 Decennial Census; U.S Census Bureau, 2013-2017 American Community Survey 5-Year Estimates.