
Recommended
Recommended
More Related Content
Similar to What Kind of Organization will you Create Your Playbook forYou .docx
Similar to What Kind of Organization will you Create Your Playbook forYou .docx (9)
More from kendalfarrier
More from kendalfarrier (20)
Recently uploaded
Recently uploaded (20)
What Kind of Organization will you Create Your Playbook forYou .docx
- 1. What Kind of Organization will you Create Your Playbook for? You will develop a Strategy Playbook for a publicly traded company (with more than 100 employees). What will the Playbook Focus On? You will write the playbook throughout the course, from the perspective of a consultant. The “plays” you will develop will be responses, based on analysis, to the core questions that any solid business strategy must ask and answer : · What is your winning aspiration? (What to you stand for and believe deeply in?) · Where will you play? (Who will you serve, and who will either help or compete against you?) · How will you win?(How will you create unique value?) · Which capabilities must be in place (to win)? (What skills, competencies and capabilities do you need now, and in the future?) · What management systems are required? (Do you have a supporting culture, structure, systems, and appropriate measures to implement a strategy?) The final compilation of your “Strategy Playbook for Exceptional Results” will be tangible evidence that you can put your MBA education to use and it will provide you a template for how you can help your current organization, or one you hope to work with in the future, achieve exceptional results. How will I Develop the Playbook? Your playbook will be written and developed throughout the entire course—not all in one week! The process for building your playbook is the same each week, although the content of analysis will vary week-to-week. Each week you will examine and analyze a given case study, and you will then identify key insights from your analysis, and apply lessons from the case study, the week’s required readings, and readings you identify from the MBA Program Capstone Bibliography, into your Playbook entry for the week.
- 2. The table below provides an overview of what you will be analyzing each week: Strategy Playbook Elements Week Playbook Analysis Completed? One Evaluate candidate companies to study and select a publicly- traded company Two Evaluate the stated mission, vision, and values, within the context-level of analysis, of your chosen company. Three Apply insights from internal strategy analysis tools and concepts towards the development of relevant portions of your strategy playbook. Four Apply key insights from P.E.S.T. and Stakeholder strategy analysis tools and concepts towards the development of relevant portions of your strategy playbook. Five Apply key insights from competitive strategy analysis tools and concepts towards the development of relevant portions of your strategy playbook.
- 3. Six Apply key insights from Key Success Factor strategy analysis tools and concepts towards the development of relevant portions of your strategy playbook. Seven Explicitly identify, provide a name for, explain the basics of, and evaluate, a preliminary company-wide strategy that you recommend for your company. Eight Synthesize all prior entries into a single document, so that it aligns with your identified strategy. Write an executive summary that explains your proposed strategy and how the playbook can help you analyze it further. Develop a Strategy Playbook Diagram or table that summaries your playbook elements. What Will be in the Final Draft of the Playbook? In week eight you will put together all of the week-by-week analysis elements into a single appendix. Then you will extract out the core – most important and interesting elements and recommendations from those analyses. From that core, you will write an Executive Summary and develop a Strategy Playbook diagram. These will be the two primary components of the Playbook, followed by the analysis appendix and all your references. So, the Playbook will consist of: · A cover page. This should include a title for your strategy (which becomes the title of your playbook), your name, the date, and the course number and section and name of the faculty member. · A written Executive Summary that Provides Key Highlights of your Playbook.
- 4. · A Strategy Map or other Playbook Summary Diagram. · An Analysis Appendix: This will be comprised of your synthesized, integrated work from your previous Playbook entries. What Purpose Does the Executive Summary for the Playbook Serve? The Executive Summary for your Playbook is where you, in a single page (of single-spaced writing), explain to your audience (senior executives at the company you are studying) what you have found in your analysis that is most interesting, and what it means in terms of what the future goals, strategies and initiatives for the company should be. This is very difficult writing, and it should relate directly to both your appendix information, and your Strategy Playbook Diagram or Table. Do I just Re-use or Cut/Paste my Prior Playbook Entries into the Final Playbook? No, the appendix should be an integrated, improved version of all the entries you have made during the course. Since strategic thinking is an iterative (it repeats itself), non-linear way of thinking (what you do at the end might mean you re-evaluate and revise, analyses you made earlier), your playbook entries in the appendix should all align with one another and reflect all improvements you have made based on peer and faculty feedback. It would not be good to just do simple cut and paste from your original drafts, as then the appendix would not flow as if it was all written as one piece of analysis—which it should be. What will the Format of the Final Playbook be? GENERAL FORMAT: all sections should be single spaced. Start with a cover page and then start page numbering with the Executive Summary. Continue page numbering through the very end, including the appendix. References should be included after the appendix and follow APA 6th format. Note: Your paper should have a cover page with a title for the recommended strategy that describes the strategy, like "Maru-
- 5. C" ("Encircle Caterpillar"), which was a large scale strategy that Komatsu strove for in the 1980's. · Lafley, A.G., Martin, R., Riel, J. (2013). A Playbook for Strategy: The five essential questions at the heart of any winning strategy. Rotman Magazine, Winter, pp. 5-9. Rubric Detail Select Grid View or List View to change the rubric's layout. Content Name: WMBA_6990_Week8_Assignment_Rubric Grid ViewList View Exemplary Very Good Proficient Opportunity for Improvement Unacceptable Element 1: Strategy Title and Cover Page Points: 3 (3%)
- 6. Student provides a logical Strategy Title that communicates the project effectively on a cover page to his/her Strategy Playbook. Feedback: Points: 2.79 (2.79%)
- 7. Student provides a logical Strategy Title that mostly communicates the project effectively on a cover page to his/her Strategy Playbook. Feedback: Points: 2.55 (2.55%) Student provides a logical Strategy Title that somewhat communicates the project effectively on a cover page to his/her Strategy Playbook.
- 8. Feedback: Points: 2.25 (2.25%) Student provides a Strategy Title that vaguely communicates the project on a cover page to his/her Strategy Playbook. Feedback:
- 9. Points: 0 (0%) Not submitted or little to no evidence of addressing the criterion. Feedback: Element 1a: Executive Summary: Summary of Key Highlights and Most Critical Findings
- 10. Points: 5 (5%) Student provides a thorough and detailed evaluation summarizing the most important findings based on his/her evaluation of the critical issues in the playbook, defends conclusions based on a rationale supported by evidence and experience, and evaluates issues facing the company to develop his/her final set of key highlights and most critical findings using objective criteria, including justifying all assumptions. Feedback:
- 11. Points: 4.65 (4.65%) Student provides an evaluation summarizing the most important findings based on his/her evaluation of the critical issues in the playbook, defends conclusions based on a rationale supported by evidence and experience, and evaluates issues facing the company to develop his/her final set of key highlights and most critical findings using objective criteria, including justifying all assumptions. One or two details are missing. Feedback: Points:
- 12. 4.25 (4.25%) Student provides an evaluation of the key highlights and important findings based on the critical issues he/she presented in his/her playbook supported with some rationale as to why he/she has identified the final set of key highlights and critical findings, and builds a compelling argument intended to influence decisions that will be made by the CEO, senior leadership, or business owner. Feedback: Points: 3.75 (3.75%)
- 13. Student provides a cursory explanation identifying a few of the more important findings, and supports his/her selections with little or no rationale. Feedback: Points: 0 (0%)
- 14. Not submitted or little to no evidence of addressing the criterion. Feedback: Element 1b: Executive Summary: Recommendations to the CEO, Senior Leadership, or Business Owner Points: 5 (5%)
- 15. Student presents a thorough and detailed explanation of well- reasoned, preliminary recommendations to the CEO/business owner that addresses the most critical issues potentially facing the organization’s future, makes specific connections between the recommendations and the issues they address, and states assumptions and limitations of the recommendations. Feedback: Points: 4.65 (4.65%) Student presents a thorough and detailed explanation of well- reasoned, preliminary recommendations to the CEO/business owner that addresses the most critical issues potentially facing
- 16. the organization’s future, makes specific connections between the recommendations and the issues they address, and states assumptions and limitations of the recommendations. Response is comprehensive but missing one or two details. Feedback: Points: 4.25 (4.25%) Student presents an explanation of preliminary recommendations to the CEO/business owner that addresses the issues facing the organization and makes a compelling case as to why the recommendations will be effective in addressing the most critical issues.
- 17. Feedback: Points: 3.75 (3.75%) Student presents a description of few preliminary recommendations meant to help the organization and provides vague or missing details on why the recommendations were suggested or to which issues they pertain. Feedback:
- 18. Points: 0 (0%) Not submitted or little to no evidence of addressing the criterion. Feedback:
- 19. Element 1c: Executive Summary: Recommendations - Priorities and Road Map Points: 5 (5%) Student presents an explicit and thorough explanation of his/her prioritized order of recommendations, including a road map that shows what additional analyses and actions would need to be completed, why, and by whom, in order to develop a more full and robust set of actionable recommendations. Feedback:
- 20. Points: 4.65 (4.65%) Student presents an explicit and thorough explanation of his/her prioritized order of recommendations, including a road map that shows what additional analyses and actions would need to be completed, why, and by whom, in order to develop a more full and robust set of actionable recommendations. Response is comprehensive but missing one or two details. Feedback:
- 21. Points: 4.25 (4.25%) Student presents an explanation with some details of his/her prioritized order of recommendations, including a road map that shows what additional items would need to be completed to develop a more full and robust set of actionable recommendations. Feedback: Points: 3.75 (3.75%)
- 22. Student presents a cursory explanation with vague or missing details of his/her prioritized order of recommendations, including a road map that shows a few additional items to develop some actionable recommendations. Feedback: Points: 0 (0%)
- 23. Not submitted or little to no evidence of addressing the criterion. Feedback: Element 1d: - Risks and Mitigation Strategies Points: 5 (5%) Student provides a thorough and detailed explanation of the
- 24. major risks of both taking action on his/her final set of recommendations, what could happen if the organization fails to address the issues it faces or follow the recommendations, ideas for mitigating the identified risks, a convincing case as to why such approaches would be effective, and justifies assumptions. Feedback: Points: 4.65 (4.65%) Student provides an explanation of the major risks of both taking action on his/her final set of recommendations, what could happen if the organization fails to address the issues it faces or follow the recommendations, ideas for mitigating the
- 25. identified risks, a convincing case as to why such approaches would be effective, and justifies assumptions. One or two details are missing. Feedback: Points: 4.25 (4.25%) Student provides an explanation identifying the risks of both taking action on his/her final set of recommendations as well as what could happen if the organization fails to address the issues it faces or follow the recommendations, and explains ideas for mitigating the identified risks.
- 26. Feedback: Points: 3.75 (3.75%) Student provides a cursory description of a few risks to the organization. Feedback:
- 27. Points: 0 (0%) Not submitted or little to no evidence of addressing the criterion. Feedback: Element 2a: Format of Executive Summary - Beginning
- 28. Points: 5 (5%) Student begins the Executive Summary with a clear and compelling statement of its purpose and presents a succinct cohesive summary that focuses on the main outcomes of his/her strategy review and Strategy Playbook development. Student makes it clear why he/she chose to highlight the content and topics and provides supporting details and examples. Feedback:
- 29. Points: 4.65 (4.65%) Student begins the Executive Summary with a clear statement of its purpose and presents a succinct cohesive summary that focuses on the main outcomes of his/her strategy review and Strategy Playbook development. Student addresses why he/she chose to highlight the content and topics and provides some supporting detail. Feedback: Points: 4.25 (4.25%)
- 30. Student begins the Executive Summary with a clear statement of its purpose and presents a summary that focuses on the main outcomes from his/her strategy review and Strategy Playbook development. Feedback: Points: 3.75 (3.75%)
- 31. Student summarizes a few main points from his/her strategy review and playbook, but does not create an Executive Summary aligned with the expectations for this type of business communication document. Feedback: Points: 0 (0%) Not submitted or little to no evidence of addressing the
- 32. criterion. Feedback: Element 2b: Format of Executive Summary - Ending Points: 5 (5%) The Executive Summary is clear, organized, and concise (less than 4 paragraphs). Student writes in nontechnical language and defines any language that may not be familiar to his/her audience. A logical flow is maintained throughout the Executive Summary, and a brief conclusion at the end of the summary that
- 33. enables the reader to synthesize the information provided is presented. Feedback: Points: 4.65 (4.65%) The Executive Summary is organized and concise (less than 4 paragraphs). Student writes in nontechnical language and defines any language that may not be familiar to his/her audience. A logical flow is maintained throughout the Executive Summary, and a brief conclusion at the end of the summary that enables the reader to understand the information provided is presented.
- 34. Feedback: Points: 4.25 (4.25%) The Executive Summary is concise (less than 4 paragraphs). Student mostly writes in nontechnical language and defines any language that may not be familiar to his/her audience. A logical flow is maintained throughout the Executive Summary, including a brief conclusion at the end of the summary.
- 35. Feedback: Points: 3.75 (3.75%) The Executive Summary includes a brief conclusion at the end of the summary. Work is vague and lacks detail. Feedback:
- 36. Points: 0 (0%) Not submitted or little to no evidence of addressing the criterion. Feedback: Element 3: Reference List
- 37. Points: 7 (7%) An annotated bibliography of the references that follows APA style guidelines is included. Feedback: Points: 6.51 (6.51%)
- 38. An annotated bibliography of the references that follows APA style guidelines is included. Annotated bibliography is comprehensive with one or two minor errors. Feedback: Points: 5.95 (5.95%) An annotated bibliography of the references that partially
- 39. follows APA style guidelines is included. Feedback: Points: 5.25 (5.25%) A few references are provided. Feedback:
- 40. Points: 0 (0%) Not submitted or little to no evidence of addressing the criterion. Feedback: Element 4: Strategy Map or other Playbook Summary Diagram
- 41. Points: 15 (15%) Student provides a thorough and detailed analysis including an easy to read strategy map or other playbook summary diagram depicting the information most important to the organization in a logical, straightforward graphical manner and strategy map follows a balanced scorecard or cascade logic identifying issues ranging from mission and vision to specific operational items. Feedback:
- 42. Points: 13.95 (13.95%) Student provides a thorough and detailed analysis including an easy to read strategy map or other playbook summary diagram depicting the information most important to the organization in a logical, straightforward graphical manner and strategy map follows a balanced scorecard or cascade logic identifying issues ranging from mission and vision to specific operational items. One or two details are missing. Feedback: Points:
- 43. 12.75 (12.75%) Student provides a strategy map or other playbook summary diagram. Feedback: Points: 11.25 (11.25%)
- 44. Student provides a cursory strategy map or other playbook summary diagram that appears to be a rough draft or is incomplete. Feedback: Points: 0 (0%) Not submitted or little to no evidence of addressing the criterion.
- 45. Feedback: Element 5: Appendices Points: 15 (15%) Student provides an edited, synthesized, integrated compilation of all previous playbook entries from each week's Capstone Forum with the appendix providing transitional language and analysis to create logic and flow across the separate entries so that it appears to be a single narrative.
- 46. Feedback: Points: 13.95 (13.95%) Student provides an edited, synthesized, integrated compilation of all previous playbook entries from each week's Capstone Forum with the appendix providing transitional language and analysis to create logic and flow across the separate entries so that it appears to be a single narrative. Response is comprehensive but missing one or two details.
- 47. Feedback: Points: 12.75 (12.75%) Student provides a synthesized, integrated compilation of all previous playbook entries from each week's Capstone Forum. Feedback:
- 48. Points: 11.25 (11.25%) Student provides cursory, unedited Capstone Forum entries with little or no attempt to synthesize or integrate them into a cohesive set. Feedback: Points:
- 49. 0 (0%) Not submitted or little to no evidence of addressing the criterion. Feedback: Element 6: Critical Thinking, Analysis, and Synthesis Points: 10 (10%)
- 50. Student exhibits evidence of thoughtful critical analysis and thinking; careful examination is made of assumptions and possible biases, with detailed supporting rationale. Writing synthesizes the classroom experiences and content; analyzes patterns or connections between theory and practice; and draws logical conclusions based on well-reasoned arguments. New questions may be presented based on synthesis of ideas and input. Feedback: Points: 9.3 (9.3%)
- 51. Student exhibits evidence of thoughtful critical analysis and thinking; examination is made of assumptions and possible biases, with supporting rationale. Writing synthesizes the classroom experiences and content; analyzes patterns or connections between theory and practice; and draws logical conclusions based on well-reasoned arguments. New questions may be presented based on synthesis of ideas and input. Feedback: Points: 8.5 (8.5%)
- 52. Student exhibits some evidence of thoughtful critical analysis and thinking; some examination is made of assumptions and possible biases, with rationale. Writing somewhat synthesizes the classroom experiences and content; analyzes patterns or connections between theory and practice; or draws logical conclusions based on well-reasoned arguments. Feedback: Points: 7.5 (7.5%)
- 53. Student exhibits little or no evidence of thoughtful critical analysis and thinking; minimal examination is made of assumptions and possible biases, with rationale. Writing minimally synthesizes the classroom experiences and content; analyzes patterns or connections between theory and practice; or draws logical conclusions based on well-reasoned arguments. Feedback: Points: 0 (0%) Not submitted or little to no evidence of addressing the criterion.
- 54. Feedback: Element 7: Written Communications Points: 5 (5%) Writing is clear, logical, well-organized and appropriate. Work is free from spelling and grammar/syntax errors. Tone is professional and free from bias (i.e., sexism, racism). There are no errors.
- 55. Feedback: Points: 4.65 (4.65%) Writing is mostly clear, logical, and organized. Few, if any spelling and grammar/syntax issues are noted. Overall, a few sections need additional editing, but generally, work appears proofread. Tone is professional and free from bias (i.e., sexism, racism). There are one or two minor errors. Feedback:
- 56. Points: 4.25 (4.25%) The main points are clear and organized. Some spelling, grammar/syntax issues are noted. Tone is professional and free from bias (i.e., sexism, racism). Feedback:
- 57. Points: 3.75 (3.75%) There are key sections that lack organization or logical flow. Many spelling, grammar/syntax issues are noted. Work requires additional proofreading. Feedback: Points: 0 (0%)
- 58. Not submitted or little to no evidence of addressing the criterion. Feedback: Element 8: Relevance Points: 10 (10%)
- 59. Student provides a thorough and detailed explanation effectively and directly integrating discussion/assignment content with relevant and compelling personal experiences, additional research, or current events from credible news sources, specifically adding new and/or different insights or perspectives on the subject area(s) being discussed or treated in the assignment. Feedback: Points: 9.3 (9.3%)
- 60. Student offers personal experiences, additional research, or current events from credible news sources, discussing their relevance, but does not specifically add new or different insights or perspectives on the subject areas(s) being discussed or treated in the assignment. Feedback: Points: 8.5 (8.5%) Student offers some examples of how the content of the discussion/application applies to real-world scenarios with
- 61. general discussion of why those examples are relevant. Feedback: Points: 7.5 (7.5%) Student offers brief or cursory descriptions of personal experiences, additional research, or current events from credible news sources. Feedback:
- 62. Points: 0 (0%) Not submitted or little to no evidence of addressing the criterion. Feedback:
- 63. Element 9: Formal and Appropriate Documentation of Evidence, Attribution of Ideas (APA Citations) Points: 5 (5%) Student demonstrates full adherence to scholarly or credible reference requirements and adheres to APA style with respect to source attribution and references. There are no APA errors. Feedback:
- 64. Points: 4.65 (4.65%) Student demonstrates full adherence to scholarly or credible reference requirements and adheres to APA style with respect to source attribution and references. There are one or two minor errors in APA style or format. Feedback: Points: 4.25 (4.25%)
- 65. Student addresses guidelines for scholarly or credible references and/or APA style with respect to source attribution and references. Some errors in APA format and style are evident. Feedback: Points: 3.75 (3.75%)
- 66. Student demonstrates inconsistent adherence to scholarly reference requirements and/or inconsistent adherence to APA style with respect to source attribution and references. Significant and/or numerous errors in APA format and style are evident. Feedback: Points: 0 (0%) Not submitted or little to no evidence of addressing the
- 67. criterion. Feedback: Show Descriptions Show Feedback Element 1: Strategy Title and Cover Page-- Levels of Achievement: Exemplary 3 (3%) points Student provides a logical Strategy Title that communicates the
- 68. project effectively on a cover page to his/her Strategy Playbook. Very Good 2.79 (2.79%) points Student provides a logical Strategy Title that mostly communicates the project effectively on a cover page to his/her Strategy Playbook. Proficient 2.55 (2.55%) points Student provides a logical Strategy Title that somewhat communicates the project effectively on a cover page to his/her Strategy Playbook. Opportunity for Improvement 2.25 (2.25%) points Student provides a Strategy Title that vaguely communicates the project on a cover page to his/her Strategy Playbook.
- 69. Unacceptable 0 (0%) points Not submitted or little to no evidence of addressing the criterion. Feedback: Element 1a: Executive Summary: Summary of Key Highlights and Most Critical Findings-- Levels of Achievement: Exemplary 5 (5%) points
- 70. Student provides a thorough and detailed evaluation summarizing the most important findings based on his/her evaluation of the critical issues in the playbook, defends conclusions based on a rationale supported by evidence and experience, and evaluates issues facing the company to develop his/her final set of key highlights and most critical findings using objective criteria, including justifying all assumptions. Very Good 4.65 (4.65%) points Student provides an evaluation summarizing the most important findings based on his/her evaluation of the critical issues in the playbook, defends conclusions based on a rationale supported by evidence and experience, and evaluates issues facing the company to develop his/her final set of key highlights and most critical findings using objective criteria, including justifying all assumptions. One or two details are missing. Proficient 4.25 (4.25%) points Student provides an evaluation of the key highlights and important findings based on the critical issues he/she presented in his/her playbook supported with some rationale as to why he/she has identified the final set of key highlights and critical
- 71. findings, and builds a compelling argument intended to influence decisions that will be made by the CEO, senior leadership, or business owner. Opportunity for Improvement 3.75 (3.75%) points Student provides a cursory explanation identifying a few of the more important findings, and supports his/her selections with little or no rationale. Unacceptable 0 (0%) points Not submitted or little to no evidence of addressing the criterion. Feedback:
- 72. Element 1b: Executive Summary: Recommendations to the CEO, Senior Leadership, or Business Owner-- Levels of Achievement: Exemplary 5 (5%) points Student presents a thorough and detailed explanation of well- reasoned, preliminary recommendations to the CEO/business owner that addresses the most critical issues potentially facing the organization’s future, makes specific connections between the recommendations and the issues they address, and states assumptions and limitations of the recommendations. Very Good 4.65 (4.65%) points Student presents a thorough and detailed explanation of well- reasoned, preliminary recommendations to the CEO/business owner that addresses the most critical issues potentially facing the organization’s future, makes specific connections between the recommendations and the issues they address, and states assumptions and limitations of the recommendations. Response
- 73. is comprehensive but missing one or two details. Proficient 4.25 (4.25%) points Student presents an explanation of preliminary recommendations to the CEO/business owner that addresses the issues facing the organization and makes a compelling case as to why the recommendations will be effective in addressing the most critical issues. Opportunity for Improvement 3.75 (3.75%) points Student presents a description of few preliminary recommendations meant to help the organization and provides vague or missing details on why the recommendations were suggested or to which issues they pertain. Unacceptable 0 (0%) points
- 74. Not submitted or little to no evidence of addressing the criterion. Feedback: Element 1c: Executive Summary: Recommendations - Priorities and Road Map-- Levels of Achievement: Exemplary 5 (5%) points Student presents an explicit and thorough explanation of his/her prioritized order of recommendations, including a road map that shows what additional analyses and actions would need to be completed, why, and by whom, in order to develop a more full and robust set of actionable recommendations.
- 75. Very Good 4.65 (4.65%) points Student presents an explicit and thorough explanation of his/her prioritized order of recommendations, including a road map that shows what additional analyses and actions would need to be completed, why, and by whom, in order to develop a more full and robust set of actionable recommendations. Response is comprehensive but missing one or two details. Proficient 4.25 (4.25%) points Student presents an explanation with some details of his/her prioritized order of recommendations, including a road map that shows what additional items would need to be completed to develop a more full and robust set of actionable recommendations. Opportunity for Improvement 3.75 (3.75%) points Student presents a cursory explanation with vague or missing
- 76. details of his/her prioritized order of recommendations, including a road map that shows a few additional items to develop some actionable recommendations. Unacceptable 0 (0%) points Not submitted or little to no evidence of addressing the criterion. Feedback: Element 1d: - Risks and Mitigation Strategies-- Levels of Achievement: Exemplary 5 (5%) points
- 77. Student provides a thorough and detailed explanation of the major risks of both taking action on his/her final set of recommendations, what could happen if the organization fails to address the issues it faces or follow the recommendations, ideas for mitigating the identified risks, a convincing case as to why such approaches would be effective, and justifies assumptions. Very Good 4.65 (4.65%) points Student provides an explanation of the major risks of both taking action on his/her final set of recommendations, what could happen if the organization fails to address the issues it faces or follow the recommendations, ideas for mitigating the identified risks, a convincing case as to why such approaches would be effective, and justifies assumptions. One or two details are missing. Proficient 4.25 (4.25%) points Student provides an explanation identifying the risks of both taking action on his/her final set of recommendations as well as what could happen if the organization fails to address the issues
- 78. it faces or follow the recommendations, and explains ideas for mitigating the identified risks. Opportunity for Improvement 3.75 (3.75%) points Student provides a cursory description of a few risks to the organization. Unacceptable 0 (0%) points Not submitted or little to no evidence of addressing the criterion. Feedback:
- 79. Element 2a: Format of Executive Summary - Beginning-- Levels of Achievement: Exemplary 5 (5%) points Student begins the Executive Summary with a clear and compelling statement of its purpose and presents a succinct cohesive summary that focuses on the main outcomes of his/her strategy review and Strategy Playbook development. Student makes it clear why he/she chose to highlight the content and topics and provides supporting details and examples. Very Good 4.65 (4.65%) points Student begins the Executive Summary with a clear statement of its purpose and presents a succinct cohesive summary that focuses on the main outcomes of his/her strategy review and Strategy Playbook development. Student addresses why he/she chose to highlight the content and topics and provides some supporting detail.
- 80. Proficient 4.25 (4.25%) points Student begins the Executive Summary with a clear statement of its purpose and presents a summary that focuses on the main outcomes from his/her strategy review and Strategy Playbook development. Opportunity for Improvement 3.75 (3.75%) points Student summarizes a few main points from his/her strategy review and playbook, but does not create an Executive Summary aligned with the expectations for this type of business communication document. Unacceptable 0 (0%) points Not submitted or little to no evidence of addressing the criterion.
- 81. Feedback: Element 2b: Format of Executive Summary - Ending-- Levels of Achievement: Exemplary 5 (5%) points The Executive Summary is clear, organized, and concise (less than 4 paragraphs). Student writes in nontechnical language and defines any language that may not be familiar to his/her audience. A logical flow is maintained throughout the Executive Summary, and a brief conclusion at the end of the summary that enables the reader to synthesize the information provided is presented. Very Good 4.65 (4.65%) points
- 82. The Executive Summary is organized and concise (less than 4 paragraphs). Student writes in nontechnical language and defines any language that may not be familiar to his/her audience. A logical flow is maintained throughout the Executive Summary, and a brief conclusion at the end of the summary that enables the reader to understand the information provided is presented. Proficient 4.25 (4.25%) points The Executive Summary is concise (less than 4 paragraphs). Student mostly writes in nontechnical language and defines any language that may not be familiar to his/her audience. A logical flow is maintained throughout the Executive Summary, including a brief conclusion at the end of the summary. Opportunity for Improvement 3.75 (3.75%) points The Executive Summary includes a brief conclusion at the end of the summary. Work is vague and lacks detail.
- 83. Unacceptable 0 (0%) points Not submitted or little to no evidence of addressing the criterion. Feedback: Element 3: Reference List-- Levels of Achievement: Exemplary 7 (7%) points An annotated bibliography of the references that follows APA style guidelines is included.
- 84. Very Good 6.51 (6.51%) points An annotated bibliography of the references that follows APA style guidelines is included. Annotated bibliography is comprehensive with one or two minor errors. Proficient 5.95 (5.95%) points An annotated bibliography of the references that partially follows APA style guidelines is included. Opportunity for Improvement 5.25 (5.25%) points A few references are provided. Unacceptable
- 85. 0 (0%) points Not submitted or little to no evidence of addressing the criterion. Feedback: Element 4: Strategy Map or other Playbook Summary Diagram-- Levels of Achievement: Exemplary 15 (15%) points Student provides a thorough and detailed analysis including an easy to read strategy map or other playbook summary diagram depicting the information most important to the organization in a logical, straightforward graphical manner and strategy map follows a balanced scorecard or cascade logic identifying issues
- 86. ranging from mission and vision to specific operational items. Very Good 13.95 (13.95%) points Student provides a thorough and detailed analysis including an easy to read strategy map or other playbook summary diagram depicting the information most important to the organization in a logical, straightforward graphical manner and strategy map follows a balanced scorecard or cascade logic identifying issues ranging from mission and vision to specific operational items. One or two details are missing. Proficient 12.75 (12.75%) points Student provides a strategy map or other playbook summary diagram. Opportunity for Improvement 11.25 (11.25%) points
- 87. Student provides a cursory strategy map or other playbook summary diagram that appears to be a rough draft or is incomplete. Unacceptable 0 (0%) points Not submitted or little to no evidence of addressing the criterion. Feedback: Element 5: Appendices-- Levels of Achievement: Exemplary 15 (15%) points
- 88. Student provides an edited, synthesized, integrated compilation of all previous playbook entries from each week's Capstone Forum with the appendix providing transitional language and analysis to create logic and flow across the separate entries so that it appears to be a single narrative. Very Good 13.95 (13.95%) points Student provides an edited, synthesized, integrated compilation of all previous playbook entries from each week's Capstone Forum with the appendix providing transitional language and analysis to create logic and flow across the separate entries so that it appears to be a single narrative. Response is comprehensive but missing one or two details. Proficient 12.75 (12.75%) points Student provides a synthesized, integrated compilation of all previous playbook entries from each week's Capstone Forum.
- 89. Opportunity for Improvement 11.25 (11.25%) points Student provides cursory, unedited Capstone Forum entries with little or no attempt to synthesize or integrate them into a cohesive set. Unacceptable 0 (0%) points Not submitted or little to no evidence of addressing the criterion. Feedback: Element 6: Critical Thinking, Analysis, and Synthesis--
- 90. Levels of Achievement: Exemplary 10 (10%) points Student exhibits evidence of thoughtful critical analysis and thinking; careful examination is made of assumptions and possible biases, with detailed supporting rationale. Writing synthesizes the classroom experiences and content; analyzes patterns or connections between theory and practice; and draws logical conclusions based on well-reasoned arguments. New questions may be presented based on synthesis of ideas and input. Very Good 9.3 (9.3%) points Student exhibits evidence of thoughtful critical analysis and thinking; examination is made of assumptions and possible biases, with supporting rationale. Writing synthesizes the classroom experiences and content; analyzes patterns or connections between theory and practice; and draws logical conclusions based on well-reasoned arguments. New questions may be presented based on synthesis of ideas and input.
- 91. Proficient 8.5 (8.5%) points Student exhibits some evidence of thoughtful critical analysis and thinking; some examination is made of assumptions and possible biases, with rationale. Writing somewhat synthesizes the classroom experiences and content; analyzes patterns or connections between theory and practice; or draws logical conclusions based on well-reasoned arguments. Opportunity for Improvement 7.5 (7.5%) points Student exhibits little or no evidence of thoughtful critical analysis and thinking; minimal examination is made of assumptions and possible biases, with rationale. Writing minimally synthesizes the classroom experiences and content; analyzes patterns or connections between theory and practice; or draws logical conclusions based on well-reasoned arguments. Unacceptable 0 (0%) points
- 92. Not submitted or little to no evidence of addressing the criterion. Feedback: Element 7: Written Communications-- Levels of Achievement: Exemplary 5 (5%) points Writing is clear, logical, well-organized and appropriate. Work is free from spelling and grammar/syntax errors. Tone is professional and free from bias (i.e., sexism, racism). There are no errors. Very Good 4.65 (4.65%) points
- 93. Writing is mostly clear, logical, and organized. Few, if any spelling and grammar/syntax issues are noted. Overall, a few sections need additional editing, but generally, work appears proofread. Tone is professional and free from bias (i.e., sexism, racism). There are one or two minor errors. Proficient 4.25 (4.25%) points The main points are clear and organized. Some spelling, grammar/syntax issues are noted. Tone is professional and free from bias (i.e., sexism, racism). Opportunity for Improvement 3.75 (3.75%) points There are key sections that lack organization or logical flow. Many spelling, grammar/syntax issues are noted. Work requires additional proofreading. Unacceptable
- 94. 0 (0%) points Not submitted or little to no evidence of addressing the criterion. Feedback: Element 8: Relevance-- Levels of Achievement: Exemplary 10 (10%) points Student provides a thorough and detailed explanation effectively and directly integrating discussion/assignment content with relevant and compelling personal experiences, additional research, or current events from credible news sources, specifically adding new and/or different insights or
- 95. perspectives on the subject area(s) being discussed or treated in the assignment. Very Good 9.3 (9.3%) points Student offers personal experiences, additional research, or current events from credible news sources, discussing their relevance, but does not specifically add new or different insights or perspectives on the subject areas(s) being discussed or treated in the assignment. Proficient 8.5 (8.5%) points Student offers some examples of how the content of the discussion/application applies to real-world scenarios with general discussion of why those examples are relevant. Opportunity for Improvement 7.5 (7.5%) points
- 96. Student offers brief or cursory descriptions of personal experiences, additional research, or current events from credible news sources. Unacceptable 0 (0%) points Not submitted or little to no evidence of addressing the criterion. Feedback: Element 9: Formal and Appropriate Documentation of Evidence, Attribution of Ideas (APA Citations)-- Levels of Achievement: Exemplary 5 (5%) points
- 97. Student demonstrates full adherence to scholarly or credible reference requirements and adheres to APA style with respect to source attribution and references. There are no APA errors. Very Good 4.65 (4.65%) points Student demonstrates full adherence to scholarly or credible reference requirements and adheres to APA style with respect to source attribution and references. There are one or two minor errors in APA style or format. Proficient 4.25 (4.25%) points Student addresses guidelines for scholarly or credible references and/or APA style with respect to source attribution and references. Some errors in APA format and style are evident. Opportunity for Improvement
- 98. 3.75 (3.75%) points Student demonstrates inconsistent adherence to scholarly reference requirements and/or inconsistent adherence to APA style with respect to source attribution and references. Significant and/or numerous errors in APA format and style are evident. Unacceptable 0 (0%) points Not submitted or little to no evidence of addressing the criterion. Feedback:
- 99. Name: WMBA_6990_Week8_Assignment_Rubric Example – Bigger, Better, Faster and Stronger Student 1 Walden University WMBA-6990-6, Capstone Instructor: Dr. Ed Dixon
- 100. Table of Contents Executive Summary ............................................................................................... ..........................1 Summary ............................................................................................... .....................................1 Recommendations ............................................................................................... .......................1 Risk and Mitigation Strategies ............................................................................................... ....2 Strategy Map ............................................................................................... .....................................3 References ............................................................................................... .........................................4 Appendix ............................................................................................... ...........................................5 Company Selection ............................................................................................... .....................6 Mission, Vision, and Values ............................................................................................... .......6 Internal Strategy Analysis Tools ...............................................................................................
- 101. .8 P.E.S.T. and Stakeholder Strategy Analysis ............................................................................11 Competitive Strategy Analysis ............................................................................................... .14 Key Success Factor Strategy Analysis .....................................................................................16 Company-Wide Strategy ............................................................................................... ...........19 Executive Summary Summary Example is service provider to the Health and Human Services industries of government entities (Example, 2014). Domestically, the growth of the industry is very slow. Internationally, the growth of the industry is increasing. One of the challenges of working in the industry is the lack of product differentiation. The services required by the government are tightly controlled and, therefore, competitors tend to provide the services in a very similar manner. The similarity
- 102. of the services provided to governments gives a great deal of leverage to the clients and promotes competition primarily on price. Through competition on price, the margins continually decrease for the competitive field. Example needs to grow the value of the firm. Achieving an increase in value requires differentiation of product and service and growth of the target market. By focusing on product and service differentiation and growth, Example can establish a greater degree of competitive advantage. The implementation of a bigger, better, faster and stronger strategy allows Example to work towards achieving these objectives. Recommendations Example needs to establish a strategy for growing the company and increasing the value of the services provided through establishing product differentiation. The growth strategy can be achieved by focusing on becoming bigger. Growth is achievable by Example through putting additional emphasis on the industry available internationally. Example’ current target market
- 103. has a primarily domestic focus. By broadening the international focus, there will be more clients that need the services that Example provides. Through increasing Example’ target market, the company will have more opportunity to be selective and not feel compelled to bid on business that requires lower margins. Domestically, the industry growth is so slow; and therefore the competition is primarily judged on costs. The international Health and Human Services industry can provide opportunities to Example – allowing them to become bigger. Analysis of the international market needs to take place to ensure it is a good fit for the company. The international market needs to be in line with the mission and values of the company. Additionally, Example should focus strategic efforts on providing better service. The quality of the services provided can be increased by increasing the innovative products developed by the company. Through standardization of operational functions that technology helps to drive, the quality of the services will increase. Example can achieve product differentiation through being
- 104. first-to-market with new and innovative products. In addition to technology providing product differentiation, technology can also increase the switching costs for a client to change to another competitor. When a client changes from one vendor to another, the operation’s people and technology changes for the client. The more the technology is integrated into the client’s systems, the more challenging it is to switch to a new competitor’s system. The Information Technology team needs to have continual training opportunities to keep their skills and ideas fresh to provide innovative solutions to business problems. It is important to have a well- rounded team to be able to identify areas of opportunity for improvement. To provide further differentiation, Example needs to become faster. Example needs to become more efficient and agile. This strategic objective requires leveraging technology to increase efficiency and automate functions that are repetitive. Functions that cannot be automated should be analyzed to
- 105. reduce touchpoints and speed the process. Agility can also be obtained through innovative software that is flexible, configurable, and scalable to meet the changing needs to the client base. If Example can achieve the better and faster objectives, they should be able to reduce the number of people each contract requires. People resources are one of the most expensive costs in a project. The reduction of people needed for a contract increases the profit expected. Finally, Example needs to become stronger. A competitive advantage for Example is with the employees. Providing services to government entities requires a great deal of subject matter expertise. As Example expands more internationally, it will become more crucial to be sure and have expertise on staff that knows the political climate of the industry for the area. The subject matter expertise will provide knowledge on how to implement operations that satisfy the needs of the client. Example needs to work to achieve high retention rates to keep and grow expertise within the company. They also need to focus on recruitment of the right people for the right
- 106. jobs. The employees that provide the services to the government are a competitive advantage for Example. They need to be treated as such and have adequate training and career paths established to promote retention. The Human Resources and Management roles need to be trained on avenues to increase employee satisfaction and retention. If Example can become bigger, better, faster and stronger, they will establish competitive advantages that promote growth and sustainability. Risk and Mitigation Strategies There are some risks to the bigger, better, faster and stronger strategy. One risk is the reliance of the industry on politics. The government services industry heavily relies on political leaders and the political landscape. When elections occur, the politics can change quickly, changing the nature of the business quickly. To mitigate this risk, the better and stronger pieces of the strategy come into play. Hiring subject matter experts will help Example anticipate and prepare for changes that may be coming. The political
- 107. changes should not be looked at as inconveniences, but be analyzed for ways that new opportunities can form from them. Agility of the staff and information technology associated with the services will allow for Example to pivot towards new opportunities as they come about. Another risk is the need to control growth. As new opportunities are presented, Example needs to choose the opportunities carefully. The opportunities need to be sure they are in line with the mission and values of the company, and that the company is prepared to take on the growth. The internal infrastructure of Example will need to continue to expand as the company grows. A focus on Human Resources, Information Technology, and Management in the stronger area of the strategy helps to mitigate the risk of rapid growth. Finally, and perhaps most importantly, Example needs to get their values, mission, and message to employees and clients in alignment. The alignment will define the opportunities that are a good fit for the company, and give employees guidelines and boundaries to use to make decisions. The company, particularly with ambitious
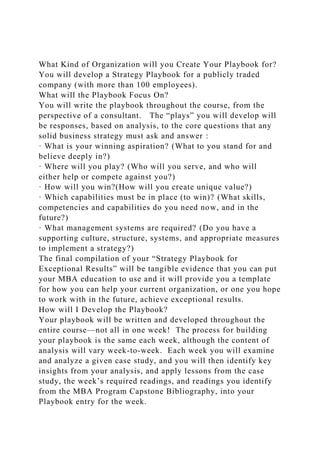
- 108. growth initiatives, needs to create synergy, and all be working towards the same goals. Strategy Map Financial Market/ Customer Internal Busi ness Learning Expand Growth Increase Market Share Better Pricing First to Mark et Solution
- 109. sIncrease Operational Performance Improve R etention Increase Training Initiatives Ins pire Innovation Increase IT S taffDevel op HR Skill s Hire Subject Matter Experts Increase Agility Devel op IT S kills Increase Quality Increase Operational Efficiency Improve
- 110. Profitability Increase Customer Bas e Devel op Management Skills References Ager, D. L., & Roberto, M. A. (2013). Trader Joe's (Harvard Business School Case No. 9-714- 419). Retrieved from https://cb.hbsp.harvard.edu/cb/pl/28623611/28636590/b5fa59a8 f4a8d6877be2d2ccdefa
- 111. 9f3e Callanan, L., Wei-Skillern, J., & Onayemi, P. (2014). James Houghton and Signature Theatre (Haas School of Business Case No. B5798). Retrieved fromhttps://cb.hbsp.harvard.edu/cb/pl/28623611/28636589/4d48 22a1aab5ad1390b3b25 ab1d140d8 Carpenter, Rob. (2014). How to Calculate Customer Retention. Retrieved from: http://www.evergage.com/blog/how-calculate-customer- retention/ Collis, D. J., & Rukstard, M. G. (2008). Can you say what your strategy is? Harvard Business Review, 86(4), 82–90. Retrieved from https://cb.hbsp.harvard.edu/cb/pl/28623611/28644118/a0fa58fcd a86692847a484b57789
- 112. 085f Davenport, T. H., Mule, L. D., & Lucker, J. (2011). Know What Your Customers Want Before They Do. Harvard Business Review, 89(12), 84-92. Goleman, D. (2000). LEADERSHIP THAT GETS RESULTS. Harvard Business Review, 78(2), 78-90. Jacob, D., Bergland, S., & Cox, J. (2010). Velocity: Combining Lean, Six Sigma, and the theory of constraints to achieve breakthrough performance. New York, NY: Free Press. Jeffrey, S. (2009). Are You Killing Creativity?. Sales & Service Excellence, 9(5), 5. Kim, W. C., & Mauborgne, R. (2004). Blue ocean strategy. Harvard Business Review, 82(10),
- 113. 76–84. Retrieved from https://cb.hbsp.harvard.edu/cb/pl/28623611/28644112/b76fd4d3 8e57dd041f680807fb9 3f2be Lafley, A. G., Martin, R., & Riel, J. (2013). A playbook for strategy: The five essential questions at the heart of any winning strategy. Rotman Management, 4–9. Lencioni, P. M. (2002). Make Your Values Mean Something. Harvard Business Review, 80(7), 113-117. Levitt, T. (2004). Marketing myopia. Harvard Business Review, 82(7/8), 138–149. Retrieved fromhttps://cb.hbsp.harvard.edu/cb/pl/28623611/28644111/c209 df73cb1b3eba21d137d e9b1e03de
- 115. Example, Inc. (2014). Example, Inc. Form 10-K. Retrieved from: http://investor.Example.com/sites/Example.investorhq.business wire.com/files/report/fil e/EXAMPLE_AnnualReport_FY2014.pdf Example Inc. SWOT Analysis. (2015). EXAMPLE, Inc. SWOT Analysis, 1-9. Montgomery, C. A. (2008). Putting leadership back into strategy. Harvard Business Review, 86(1), 54–60. Retrieved from https://cb.hbsp.harvard.edu/cb/web/pl/product.seam?c=2033126 6&i=20331397&cs=f68 1723ce94064afdc9f567c211557e3 Pfeffer, J., & Veiga, J. F. (1999). Putting people first for
- 116. organizational success. Academy Of Management Executive, 13(2), 37-48. doi:10.5465/AME.1999.1899547 Porter, M. E. (1983). Note on the structural analysis of industries [Industry and Background note]. Retrieved fromhttps://cb.hbsp.harvard.edu/cb/pl/28623611/28644116/e94b c0593b2ab35046b839e 8732d70ac Porter, M. E. (1996). What is strategy? Harvard Business Review, 74(6), 61–78. Retrieved fromhttps://cb.hbsp.harvard.edu/cb/pl/28623611/28644110/1c6d 5c20554e3448b476e95 caee1379f Raynor, M. E., & Ahmed, M. (2013). THREE RULES FOR MAKING A COMPANY
- 117. REALLY GREAT. (cover story). Harvard Business Review, 91(4), 108-117. Rothaermel, F. T. (2014). Apple (in 2013): How to sustain a competitive advantage? (McGraw-Hill Education Case No. 0077645065). Retrieved from https://cb.hbsp.harvard.edu/cb/pl/28623611/28636592/e37ff563 5161c90740b6f0c11c48 2537 Shanks, G., Jagielska, I., & Jayaganesh, M. (2009). A Framework for Understanding Customer Relationship Management Systems Benefits. Communications Of The Association For Information Systems, 25263-287. SHRM. (2005). Turnover: How do we calculate monthly
- 118. turnover rates for our company? Retrieved from: http://www.shrm.org/templatestools/hrqa/pages/turnovercalculat ions.aspx Spenner, P., & Freeman, K. (2012). To Keep Your Customers, Keep It Simple. Harvard Business Review, 90(5), 108-114. Wolfe, N. (2011). The living organization: Transforming business to create extraordinary results. Irvine, CA: Quantum Leaders Publishing. http://investor.maximus.com/sites/maximus.investorhq.business wire.com/files/report/file/MAXIMUS_AnnualReport_FY2014.p df http://investor.maximus.com/sites/maximus.investorhq.business
- 120. he%20Living%20Organization.pdf https://class.waldenu.edu/bbcswebdav/institution/USW1/201620 _02/MS_WMBA/WMBA_6990/readings/USW1_WMBA_6990_T he%20Living%20Organization.pdf Appendix Company Selection Example is a public company that provides government services. Example is my company’s largest competitor. I think analyzing how Example does things will provide some interesting insights. My organization is a small, privately owned company. When we go against them in a Request for Proposal (RFP), it almost feels like a David and Goliath scenario.
- 121. They are a large company with many resources and a high overhead. My company, in comparison, has far fewer employees and much lower overhead. I anticipate finding that the differences in the two companies go far beyond just the high- level statistics. Both my company and Example are very successful in our industry. It will be interesting to see how different strategies for different companies play into the successes we both enjoy. Example is in the Hoovers Company Listing. Additionally, the Example website (http://www.Example.com/) has a great deal of information on the company. The Business Source Complete database also has several articles on Example that I think will prove to be useful in my analysis. There is a Example SWOT analysis
- 122. document that I believe will be helpful as well. Mission, Vision, and Values The mission, vision and values of an organization define what Lafley, Martin, and Riel, (2013) refer to an organization’s “winning aspiration”. This is one of the five pieces of a strategy for a company. Strong Foundation to a Soulful Purpose The mission statement of Example (2014) is, “Helping Government Serve the People” (p. 4). The direction of the mission statement is to the client and the end-users of the services provided by the company. Wolfe (2011) describes a Soulful Purpose as defining, “ what role
- 123. that particular company will play on the stage of business, the unique contribution it will make to our community as a whole and the market that company can best serve” (p. 86). The mission statement by itself does not provide clarity on the role the business will play or the specific market that it works within. The General section of the Example Annual Report does go a bit further and explains the problems that the company attempts to solve and why it is important. The Example (2014) annual report states one of the problems the services provided by the company solves as, “Aging populations that place a greater strain on health care and welfare systems” (p. 4). The company helping to resolve these types of issues gives insight into their Soulful Purpose. The problems they solve explain why the
- 124. company is meaningful to the markets in which they participate. The mission and values together do explain their Soulful Purpose. http://www.maximus.com/ Strength and Weaknesses of the Mission, Vision, and Value One of the major weaknesses of the Mission and Vision is that there seem to be two sets. The website does not echo the same mission as the annual report. It is odd they would want the shareholders to understand what the company does and why, and not want the potential clients to have that same information. The website (www.Example.com) also lists some points about
- 125. “Why Example”. These vision statements do not match the ones in the Annual Report. Neither set of statements includes the role of the employees or shareholders. Goleman (2000) states, “six key factors that influence an organization's working environment: its flexibility- that is, how free employees feel to innovate unencumbered by red tape,- their sense of responsibility to the organization; the level of standards that people set; the sense of accuracy about performance feedback and aptness of rewards; the clarity people have about mission and values; and finally, the level of commitment to a common purpose” (p. 81)
- 126. This gap between the website and the annual report create ambiguity that likely impacts the level of commitment to the mission and values. The lack of clarity in the mission and vision statements is not at all like the Signature Theatre experienced under the leadership of Houghton (Callanan, Wei-Skillern, and Onayemi, 2014). Houghton had a clear, concise and consistent message that was reiterated to the stakeholders and assisted in maintaining the vision of the company (Callanan et al., 2014). The message within the Example mission and vision are not consistent. The differences in the website and the annual report make me question if perhaps they have changed their mission statement since the Annual Report was released. Another
- 127. explanation is that the Annual Report is written with the audience of shareholders in mind (with one mission statement and one set of vision), and the website is written to an audience of potential clients and end-users. A strength of the mission and vision statements is that if the sets from the website and the Annual Report are all taken together, they do explain the purpose of the company from the perspective of the shareholder, the client and the end-user. This covers the major stakeholders in the company except the employees. The groups that are addressed know why the company is important, and the role the company (and the stakeholder) plays in their market and the community. What the mission and vision statement together provide is the purpose of the
- 128. company, whom they serve, and why it is important to the market. Revisions to the Mission and Vision Statements To improve the mission and vision statement, Example should revise them to have a single set throughout all of the company literature. Lencioni (2002) states, “a vision that isn’t shared is an unrealized dream; a strategy without organizational commitment is a delusion” (p. 5). The ambiguity between the two sets can lead to questions as to what the true mission and values are and devalue them. Consideration of the role the employees play in the company would also add value to the mission statement. The Example (2014) Annual Report lists the following as a risk: “We may be unable to attract and retain
- 129. sufficient qualified personnel to sustain our business” (p. 99.1). If attracting good employees are a risk to the company; the employees can also be a competitive advantage and an important stakeholder to the company. Another addition to consider is to include the specific markets that the company works within. The Annual Report references that the company divested other lines of business to focus on the two markets of Health and Human Services (Example, 2014). These two markets are where their specialty is and where the competitive advantage lies with their experience. Wolfe (2011) states, “The idea was to have a well-defined Mission/Vision/Value to
- 130. deeply engage all employees, to energize and motivate them and to have a force that draws them into the future like a magnet” (p. 120). Changes to the mission and value statements to be more inclusive of all stakeholders will need to be made to reach that level of engagement and motivation with the entire set of stakeholders. Internal Strategy Analysis Tools An internal strategy analysis defines for a company what capabilities they must have in place to compete and win in their field. This is looked at as the company’s core capabilities. The analysis of the internal strategy shows where Example needs to improve their capabilities to win.
- 131. Recommendation: Monitor Retention Rates Example provides services instead of selling products. The services that are provided by Example are “labor intensive” (Example, 2014). Example (2014) states that one of their competitive advantages is subject matter expertise in their field. Like the Trader Joe’s case study, retention of employees is very important to the company. Example (2014) states one of their risks as not being able to retain the personnel they need to run their business. In a service provider business, your employees are a key to the success of the organization. Pfeffer and Veiga (1999) state, “Companies which place workers at the core of their strategies produce higher long-term returns to shareholders than their industry
- 132. peers” (p. 37). Strategically, maximizing employee retention provides increased long-term results and also reduces costs on hiring and the ramp-up for new employees. Employee retention helps to keep the organization viable and healthy. There are three quantitative metrics and one qualitative metric that are useful in analyzing the retention and turnover of the company. The first quantitative metric is the turnover rate. The turnover rate is the number of separations divided by the number of employees within the same period (SHRM, 2005). However, the number of separations should be considered carefully. If someone leaves your company, it could be because of dissatisfaction, but it could also be for
- 133. reasons beyond the company’s control such as retirement. Another quantitative metric that can be used is the retention rate. This rate is the percentage of employees who were employed at the beginning of a period and remain with the company at the end of the period (Carpenter, 2014). Ideally, this number would be a high percentage. The retention calculation describes what the “churn” is on employees. A third quantitative metric that can be used is the average tenure of employees. The average tenure is the sum of the months worked by all current employees, divided by the number of employees. Ideally, this number would also be high. In addition to these quantitative measures, a qualitative measure of employee retention is exit interviews. Exit interviews will give a company insight into why the average
- 134. tenure may be low and may point to a specific issue such as compensation, training, and advancement. Identifying trends allows for a business to work towards rectifying the situation. However, this information is a challenge to get real answers on. Employees may be truthful, and they may not. Monitoring the set of statistics discussed will alert the company to potential employee issues that have the possibility of being a critical risk to the company. Davenport, Mule, and Lucker (2011) state, “Combining human judgment with predictive models can be more effective than simply following a model’s recommendation” (p. 91). Using both qualitative and
- 135. quantitative data will yield more effective results. Trends upwards or downwards in the metrics can give management the opportunity to make the appropriate changes. These changes are necessary to maintain the health of the company. Recommendation: Improving Cost and Time Estimates for Pricing Example (2014) identifies the following risk, “If we fail to accurately estimate the factors upon which we base our contract pricing, we may generate less profit than expected or incur losses on those contracts” (p. 85). Example derived approximately 72% of revenue from fixed price and performance based contracts (Example, 2014). These contracts require estimation of
- 136. expected price and performance when bidding for the work through the RFP process. If the cost estimates are inflated, the company may not win the business. If the cost estimates are too low, the company may not be able to make an adequate amount of profit or take a loss on the project. Wolfe (2011) states, “Profit is the foundational metric and a critically important component of the feedback loop” (p. 57). The monitoring and examination of this feedback loop can help improve the estimates both in the short and long-term. While the Trader Joe’s case study did not cover this type of capability, the ability to estimate accurately impacts the bottom line directly for Example. There are several metrics that can be used to monitor the estimated versus actual pricing
- 137. and to improve the estimation over time. The first metric is to compare the actual costs to the budgeted costs. The comparison is typically performed at the end of a project, but could be performed throughout the project to track progress and detect trends that might cause concern. One problem with looking at the budget versus actuals throughout the project is that the service contracts typically have many upfront costs to establish the service with the client (Example, 2014). Thus, it cannot be assumed the consumption of the budget will occur at the same rate for the length of the project. This needs to be kept in consideration when tracking the progress through the life cycle of the contract. If the budgets versus actuals are compared only at the end
- 138. of the project, the opportunity to make changes for that contract is lost. If any negative trends are noted through the tracking, the management team should discuss the trend and decide if any action is required. Another metric used in pricing estimation is the number of man hours a contract will require to work to completion. When providing services, the costs of people are one of the largest costs the project will incur. As such, estimation should occur in much the same manner as the costs. Estimations of man hours should be performed when pricing a contract for an RFP. The budgeted man hours should be monitored both throughout the contract and also at the end in a review of the project. As any negative trends begin to develop, the management team can respond with changes in the plan if
- 139. necessary. For both metrics, performing a retrospective at the end of each project will help improve the estimating over time by looking at the lessons learned. To further strengthen the validity of the estimates and thus the health of the company, a risk analysis should take place when pricing a contract. A list of potential risks should be developed. These risks should be scored in two ways: with a probability of occurrence and an anticipated impact. Development of mitigation plans are needed for the risks that have a high probability and a high impact to the project. The mitigation plans should have cost and man-
- 140. hour estimates associated with them. Management can then make educated decisions about additional costs and hours that may occur throughout the life of the contract, and that may need to be considered when developing pricing for the RFP. While a risk analysis will strengthen the estimating process, there are still some significant challenges. The projects typically span multiple years and are subject to changes within the government (Example, 2014). It is difficult to predict the landscape of the challenges that might occur that far out in the future. Another difficulty in learning from the past is that many of the RFP’s presented to the company vary a great deal in how to execute them. At times, to learn from the past contracts may be like
- 141. comparing apples to oranges. However, if the operations are broken down into sets of repeatable tasks that are applicable across multiple projects, then trending and a retrospective become more valuable. As the gap between actuals and budgets begin to close through these analyses, the company can more accurately anticipate the profit to be expected. Recommendation: Improve Operational Efficiencies As mentioned above, the cost of people involved providing the services is a very expensive part of a contract. It is important to try reducing the number of people needed to work a contract so that the bid in the RFP can be more competitive. To reduce the number of people, but maintain a high degree of quality, the service operations need to be optimized. Optimization
- 142. could occur within a business in any industry such as a grocer, but it is particularly necessary with a services contract. Efficient, repeatable processes are needed to optimize the services provided. Wolfe (2011) states, “The ultimate determinant of an organization’s success if how well these four domains – leadership, people, process, and customers – are optimized and in balance with each other” (p. 104). Optimization of processes can occur in several ways. The first is by reorganizing the work to be done in a way that makes the processes within the operations require less manpower. Another way is by automating through technology as many of the processes as possible. Raynor and Ahmed (2013) state, “…outstanding performance is
- 143. caused by greater value and not by lower price” (p. 113). Finding efficiencies will increase the performance that can be achieved and feed the value and viability of the organization. There are several ways to determine where there is an opportunity for optimization. The first is to survey the employees for their thoughts on optimization. While they are closest to the work being accomplished, they may have fears of optimizing themselves out of a job. Another way to determine where efficiencies can be gained is in customer surveys. Determining where they think a company excels and where there is room for improvement will give management some key places to concentrate on. Some quantitative analysis can be performed as well. Key workflow processes within the operations can be identified and
- 144. analyzed. Adopting a Lean and Six Sigma approach will reduce waste and increase value (Jacob, Bergland, and Cox, 2010). Using Lean and Six Sigma approaches; efficiencies through automation or re-organization of the process can be made. The process can then be analyzed again to see if the desired results were obtained. An additional way to determine where efficiencies can be gained is through Service Level Agreement (SLA) analysis. If the company is not meeting the established SLA’s, then a root cause analysis can be performed and then remediation plans developed. Driving efficiencies into processes can be somewhat labor intensive itself.
- 145. However, the labor of analysis and remediation is needed only for the duration of creating the efficiency. The company can then benefit from them over the long-term. P.E.S.T. and Stakeholder Strategy Analysis Lafley, Martin, and Riel (2013) define a third area of strategy as “Where will you play?” The P.E.S.T and Stakeholder analysis define who the people are that need to be satisfied for the company to be successful and the factors that influence the company and the stakeholders. The analysis revealed some areas of weakness that could be strengthened to create more competitive advantage. Recommendation: Encourage Target Market Growth through
- 146. Building a Coalition of Service Providers to Talk with Governments about the Service Options that are Available Just as Tesla was experiencing issues getting their target market fully committed to electric cars, Example experiences issues with getting their target market (governments) to consider outsourcing services. The primary target market for Example is the Health and Human Services divisions of governments (Example, Inc., 2014). Example (2014) believes the target market has an “aging population that places a greater strain on the health care and welfare systems” (p. 4). While there is a growing need for services within the government to be filled, governments have the option to manage the growth themselves or to outsource services.
- 147. Governments tend to want to keep the services within the government. For the workers within the government agencies, outsourcing poses a threat to their employment. There are many reasons why governments should consider outsourcing services. One is that the private sector has demonstrated an ability to perform the services more efficiently at a smaller cost (Example, 2014). Another is that the performance of the private sector managing the services can provide an increase in quality of the services provided to the public (Example, 2014). If Example combined their expertise with the expertise of their competitors, they would have a more compelling story to tell to the government and the public. They could explicitly state why
- 148. outsourcing is a viable alternative and help to ease fears that the government may have by providing alternative remediation actions. Without more government entities willing to outsource, there is a finite amount of the market to service. A coalition could be the impetus needed for governments to change their views on the management of government services. The growth in the industry would allow growth for the companies competing within the industry. There are a couple of metrics that could help to measure the implementation of this strategy. The first is measuring the trending of government functions across the states that are being outsourced. This information is reasonably easy to obtain, as most of it is public information. Through analysis of this information, new target
- 149. markets within the government arena may be identified as a growth opportunity. The analysis would also demonstrate which states are more willing to outsource and which are less likely to outsource. Knowing which states may outsource allows for more emphasis of sales of services to be placed with that potential client. Another metric to analyze is the performance metrics of the services provided. By trending the performance metrics per service type, per state, Example would be able to tell which government entities are succeeding with their current strategy, and which may be more primed for a change because performance goals are not being
- 150. met. Not meeting performance goals could mean a change in the outsourcing vendor (if the government entity is already outsourcing) or a growth opportunity in the industry of a government that is willing to begin to outsource. This information is largely public information and can be easily obtained. Recommendation: Work with Publications to Publish the Performance Objectives Achieved through Outsourcing Government Functions In today’s world, much of the news published is negative. If Example is not meeting performance goals for a government entity, it will likely be in the newspapers. The customer’s perspective is formed according to the publicity it receives. Tesla experiences the same
- 151. phenomenon. Although negative press (particularly for valid reasons) is challenging to control; positive press can be released championing the successes that are a result of outsourcing government functions. Relaying the success stories will help get the Example name out in the industry and have it associated with positive results. Another positive impact is that other government entities that have chosen not to outsource will begin to see potential benefits of outsourcing the services they provide. A third benefit is that promoting positive press has the potential to get the public involved. The public is the ones that elect the government leaders that make the decisions on how their services should be managed and maintained. If the public understood the issues and were able to see the success stories
- 152. from it, they could rally their support around more government entities outsourcing. In this way, the press could be used to influence both the potential clients and end users. Spenner and Freeman(2012) state, “The marketer’s goal is to help customers feel confident about their choice” (p. 113). Through the use of publications, trust and confidence can be built up for the option of outsourcing services. The potential government clients, existing government clients and the end users of the services are the agents for change in the industry. One metric that can be used to measure the success of utilizing the press to promote growth in the industry is by measuring the number of publications or stories that are related to
- 153. Example and categorize them as positive or negative. There should be many more positive publications and stories over time if the strategy is successful. Additionally, if the strategy of positive publications does begin to influence the government agencies and the public that utilize the services, growth within the industry should occur. There is a challenge in making the assertion that if growth in the industry is experienced, that it is due in part of the positive publications. There is only an indirect link that can be assumed in the analysis. Another way to measure the success of the strategy is to monitor upward trends in customer satisfaction surveys. Surveys can be sent to both the government client and the end- user. If the positive press is influencing these groups appropriately, there is an expectation
- 154. that customer satisfaction will improve. The reverse should be true as well – negative press should cause a decrease in customer satisfaction. There is an assumption made that customer satisfaction increasing is in part a result of positive press. Positive press should help to increase the field of the target market as well as increase customer satisfaction experienced by the clients and end users. Recommendation: Attend Industry Conferences to Develop Relationships with Potential Clients As with the other recommendations, this recommendation of attending industry
- 155. conferences is being made to support the growth strategy of the company by growing the target market and strengthening the relationships in the current market. The recommendation for Example to have attendees at industry conferences is to advocate the use of outsourcing and to build the relationships needed to win the business. The ability to get the Example name embedded into the industry along with the successes that can be expected through outsourcing can be powerful to the growth of the industry and the company. Relationships are needed to encourage the outsourcing message in a politically charged market like governments. Wolfe (2011) states, “It is the energy you project in what you say or do that creates the experience that
- 156. is felt” (p. 78). The face-to-face interactions in a conference setting are a way to energize the industry about the services offered and the value they provide. Industry conferences are where government agencies come together to discuss alternatives. Outsourcing needs to be on their agenda along with the competitive advantages that Example has to offer. One way to track the implementation of this recommendation is to collect data on the connections made at the conferences. There can be some challenges in data collection. The data must be given from the new connection to the Example employee and then tracked. While this may be electronically executed, there are manual ways to implement this as well - such as collecting business cards. In either a somewhat automated
- 157. manner or through manual entry, the information should be entered into a Customer Relationship Management (CRM) system for storage. The CRM can also help to facilitate other metrics collected such as how many times and by what method each potential client has been communicated with. Shanks, Jagielska, and Jayaganesh (2009) describe a CRM as, “managing and improving relationships with customers in the areas of sales, marketing, and customer support and service” (p. 264). The assumption being made is that the efforts of communication will increase awareness of the options and thus increase the growth of the industry and the company. Conclusion – P.E.S.T and Stakeholder Strategy All three recommendations have the same objective – to
- 158. increase the target market and to increase growth for the company leveraging external stakeholders. Montgomery (2008) states that a company “must keep one eye on how the company is currently adding value and the other eye on changes, both inside and outside the company, that either threaten its position or present some new opportunity for adding value” (p. 6). Working together with the external stakeholders, the recommendations made could help facilitate the relationships and influence needed to create opportunities for the company and the industry.
- 159. Competitive Strategy Analysis Lafley, Martin, and Riel (2013) define a fourth area of strategy as “How will you win?” The competitive analysis is an analysis of the potential competition. The recommendations focus on areas where Example’s strengths can be used to their advantage in competition and minimize their weaknesses. Critical Competitive Forces The most critical competitive force for Example is the buyers. From the case study this week, Apple should also feel a threat from the competitive force of the buyers. In Apple’s scenario, the switching costs are low, and buyers have the luxury of multiple choices that are all fairly similar. Porter (1983) states, “consumers tend to be more
- 160. price sensitive if they are purchasing products that are undifferentiated” (p. 15). For Apple within the smartphone industry, the products offered by different companies have similar functionality. With Example, the same holds true. The competitors in the Health and Human Services industry all offer similar functionality. The Health and Human Services industry is strictly controlled by the governments. This makes differentiation between competitors a challenge and gives buyers some leverage. Unlike Apple where the switching costs to another competitor is low; the switching costs for Example is high. When companies win business within the industry, the services delivered include employees to provide the services as well as the technology and
- 161. infrastructure to support the services provided (Example Inc., 2015). When a buyer chooses a different vendor, the whole service provided is implemented again – likely with different employees, process, and technology. Comparison of Competitive Forces between Apple and Example For Apple and Example, the threat of new entrants is low. There are high start-up costs within both industries. To compete with the current industry leaders, a new company must have funding to manage the capital requirements (Porter, 1983). Additionally, in the Health and Human Services industry, to win business, you have to have references of prior successful implementations of similar size and scope. This requirement by the government eliminates most
- 162. new entrants. Both Apple and Example enjoy strong branding within their industries. Apple benefits from “brand equity that lasts for decades” (Kim and Mauborgne, 2004). Example Inc.(2015) claims they have, “been operating large scale program management operations on behalf of government agencies since 1975 and enjoys brand recognition as a proven partner with government agencies” (p. 5). The strong brand images make it a challenge for customers to choose a new player in the market over one that has a proven reputation. A difference in the competitive forces between Apple and Example is the threat of direct competition. Apple’s direct competition is high. The switching costs are low, and the
- 163. aggressiveness of other firms is high. For Example, the switching costs are high, and the aggressiveness of other firms is moderate. Since the Health and Human Services industry is won through Request for Proposals (RFP) that become public record, the competitors each can easily see what each other has to offer potential clients. The ability to know what the competitive advantages are of each competitor lowers the threat of direct competitors. Recommendation: Focus on International Growth The growth of outsourcing is slow within the Health and Human Services industry in the United States. The lack of industry growth causes the number
- 164. of buyers to be stagnant. An increase in the number of buyers should provide opportunities for growth of the company. With the growth being slow, competitors tend to have to compete on price to win the business from another competitor. Example Inc. (2015) has seen that there is “robust demand in the UK public sector outsourcing market” (p. 4). The increase in demand internationally provides opportunities for company growth that can likely not be achieved within the United States. Market growth internationally needs to be measured to watch for trends upward or downward in the growth of outsourcing public services. This information is public information and is not a challenge to obtain. Example also should track the number of contracts and revenue generated
- 165. from winning international business. This metric will show the trends in growth within the company that can be attributed to the focus on the international market. Finding ways to increase the numbers of buyers available to purchase the services, increases the ability for a company to grow. Recommendation: Hire Employees with Industry Knowledge The Health and Human Services industry is “specialized in nature” (Example Inc., 2015). Employees that have subject matter expertise in the field should be recruited to help facilitate and operate the new business that is obtained by the company. The depth of knowledge and understanding Example has within the industry is a competitive advantage. This advantage
- 166. provides differentiation needed to keep the threat of new entry low. Pfeffer and Veiga (1999) state, “Companies which place workers at the core of their strategies produce higher long-term returns to shareholders than their industry peers” (p. 38). The goal of hiring people with subject matter expertise can be measured by Human Resources through the hiring process. One challenge in using this metric as a measure of success is that each employee could have varying skills and expertise in the industry. Having ten people with a low degree of industry expertise may be equivalent in creating competitive advantage to having one person with extensive expertise. The metric is a count and not a complete measure of how subject matter expertise
- 167. impacts the company. Another metric to be measured is the ability for Example to reach and exceed the performance goals. The company should become more adept at meeting the performance goals with the more industry expertise they have on staff. The performance goals are not challenging to obtain; however, meeting the performance goals may not be as a direct result of hiring employees with the specific expertise. Recommendation: Leverage Technology to Create Differentiation between Competitors The recommendation for Example is similar to recommendations that could benefit Apple – increase switching costs and increase product differentiation as much as possible. In an industry where the services that are provided are so similar, any product differentiation could
- 168. become a large competitive advantage. Product differentiation for both Apple and Example can be obtained through technology innovations. A creative and innovative work environment will translate into more efficient and higher quality operations of the services provided. Developing a creative work environment requires creating, “an atmosphere where people are inspired to succeed rather than afraid to fail” (Jeffrey, 2009). Apple was able to cultivate this type of atmosphere through the leadership of Steve Jobs (Rothaermel, 2014). In addition to product differentiation, switching costs should be considered. The more tied the customer is through
- 169. technology integration, the higher the switching costs. The higher the switching costs, the less likely it is for a client to switch vendors. For Example, the technology innovations can be measured through the number of products and technology enhancements released. The more releases there are, the higher the innovation should be, which should translate into quality and efficiency. Although this metric is not challenging to obtain, not all releases will carry similar impacts to the operations. Another metric that can be used is measuring quality and efficiencies within the operations. With more efficient tools, employees should be able to complete their jobs in a shorter amount of time with increased quality. The metrics can be analyzed for trends
- 170. over time. Innovation areas that have a positive impact on operations can be focused on for additional tuning of the tools. Conclusion – the Competitive Environment Example needs to focus on maintaining high switching costs, increasing the focus and scope of where they compete and provide innovative product differentiation. By keeping the switching costs high, the buyers are more likely to stay with the same vendor. The focus on international business will give the company a chance at more opportunities and allow them to grow in an industry that has slow growth in the United States. Example must also find ways to differentiate themselves from other competitors. Differentiation can be through hiring subject
- 171. matter expertise that can be leveraged to win and improve the business. Product differentiation can also be accomplished through innovative technology choices and design that increase their ability to meet performance goals and to drive efficiency into the operations. Key Success Factor Strategy Analysis The Key Success Factor analysis reveals the ways to create competitive advantages and value within the company. Example should devote attention to the areas in the recommendations to leverage and build their key success factors. Recommendation: International Growth From the five forces analysis on Example, the buyers pose the highest threat. This is different from the forces that Trader Joe’s would find