More Related Content
Similar to LogRhythm Visualization Use Case
Similar to LogRhythm Visualization Use Case (20)
LogRhythm Visualization Use Case
- 1. USE CASE
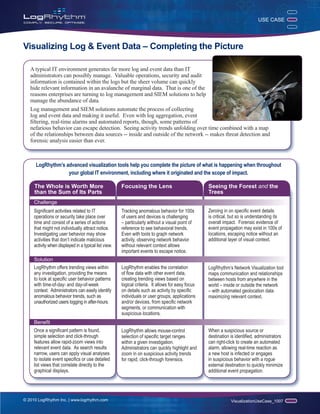
Visualizing Log & Event Data – Completing the Picture
A typical IT environment generates far more log and event data than IT
administrators can possibly manage. Valuable operations, security and audit
information is contained within the logs but the sheer volume can quickly
hide relevant information in an avalanche of marginal data. That is one of the
reasons enterprises are turning to log management and SIEM solutions to help
manage the abundance of data.
Log management and SIEM solutions automate the process of collecting
log and event data and making it useful. Even with log aggregation, event
filtering, real-time alarms and automated reports, though, some patterns of
nefarious behavior can escape detection. Seeing activity trends unfolding over time combined with a map
of the relationships between data sources -- inside and outside of the network -- makes threat detection and
forensic analysis easier than ever.
LogRhythm’s advanced visualization tools help you complete the picture of what is happening when throughout
your global IT environment, including where it originated and the scope of impact.
The Whole is Worth More Focusing the Lens Seeing the Forest and the
than the Sum of Its Parts Trees
Challenge
Significant activities related to IT Tracking anomalous behavior for 100s Zeroing in on specific event details
operations or security take place over of users and devices is challenging is critical, but so is understanding its
time and consist of a series of actions – particularly without a visual point of overall impact. Forensic evidence of
that might not individually attract notice. reference to see behavioral trends. event propagation may exist in 100s of
Investigating user behavior may show Even with tools to graph network locations, escaping notice without an
activities that don’t indicate malicious activity, observing network behavior additional layer of visual context.
activity when displayed in a typical list view. without relevant context allows
S important events to escape notice.
Solution
LogRhythm offers trending views within LogRhythm enables the correlation LogRhythm’s Network Visualization tool
any investigation, providing the means of flow data with other event data, maps communication and relationships
to look at specific user behavior patterns creating trending views based on between hosts from anywhere in the
with time-of-day- and day-of-week logical criteria. It allows for easy focus world – inside or outside the network
context. Administrators can easily identify on details such as activity by specific – with automated geolocation data
anomalous behavior trends, such as individuals or user groups, applications maximizing relevant context.
unauthorized users logging in after-hours. and/or devices, from specific network
segments, or communication with
suspicious locations.
Benefit
Once a significant pattern is found, LogRhythm allows mouse-control When a suspicious source or
simple selection and click-through selection of specific target ranges destination is identified, administrators
features allow rapid-zoom views into within a given investigation. can right-click to create an automated
relevant event data. As search results Administrators can quickly highlight and alarm, allowing real-time reaction as
narrow, users can apply visual analyses zoom in on suspicious activity trends a new host is infected or engages
to isolate event specifics or use detailed for rapid, click-through forensics. in suspicious behavior with a rogue
list views that correlate directly to the external destination to quickly minimize
graphical displays. additional event propagation.
© 2010 LogRhythm Inc. | www.logrhythm.com VisualizationUseCase_1007