Bearish Sentiment and JSCO Pain Index Chart
•
0 likes•94 views

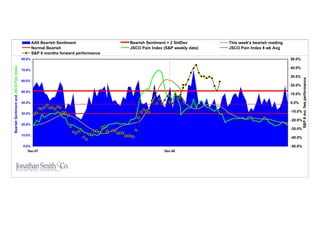
1st chart 12/31/2001 thru 11/11/2009 2nd chart is a closeup showing 12/31/2007 thru 11/11/2007. Past results do not guarantee or imply future results. For educational purposes only. No investment advice given or implied.

Recommended
More Related Content
Viewers also liked
Viewers also liked (20)
Similar to Bearish Sentiment and JSCO Pain Index Chart
Similar to Bearish Sentiment and JSCO Pain Index Chart (20)
Recently uploaded
Recently uploaded (20)
Bearish Sentiment and JSCO Pain Index Chart
- 1. AAII Bearish Sentiment Bearish Sentiment + 2 StdDev This week's bearish reading Normal Bearish JSCO Pain Index (S&P weekly data) JSCO Pain Index 8 wk Avg S&P 6 months forward performance 80.0% 50.0% Bearish Sentiment and JSCO Pain Index 40.0% 70.0% 30.0% S&P 6 mo. fws performance 60.0% 20.0% 50.0% 10.0% 40.0% 0.0% -10.0% 30.0% -20.0% 20.0% -30.0% 10.0% -40.0% 0.0% -50.0% Dec-07 Dec-08
- 2. AAII Bearish Sentiment Bearish Sentiment + 2 StdDev This week's bearish reading Normal Bearish JSCO Pain Index (S&P weekly data) JSCO Pain Index 8 wk Avg S&P 6 months forward performance 80.0% 50.0% Maximum bearish In 2002, 2004, and 2005, bearish Bearish Sentiment and JSCO Pain Index sentiment in 21 years 40.0% 70.0% sentiment was nearly as high as it was in March 2009; 6 months later (as indicated 30.0% S&P 6 mo. fws performance by the black dots), share prices rose 60.0% hi h 20.0% 50.0% 10.0% 40.0% 0.0% -10.0% 30.0% -20.0% 20.0% -30.0% 10.0% -40.0% 0.0% -50.0% Dec-01 Dec-02 Dec-03 Dec-04 Dec-05 Dec-06 Dec-07 Dec-08