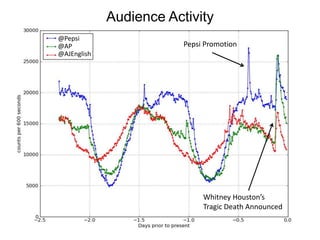
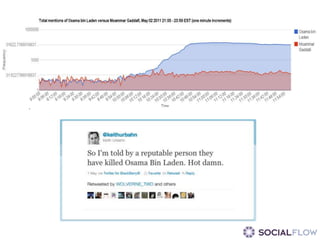
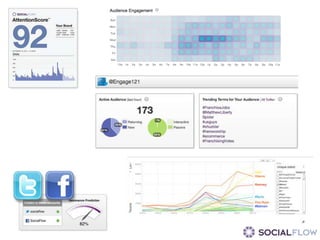
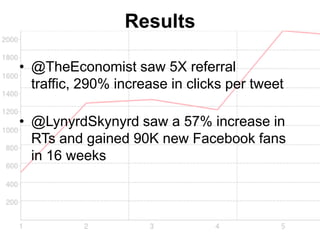
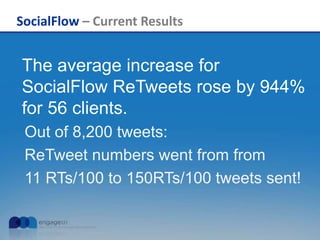
It’s All About Timing
    Best Practices for Optimizing Your Social Media Publishing


Megan Smith               Gilad Lotan                  Jennifer
Account Strategist           VP of R&D
   SocialFlow                SocialFlow
                                                      MacDonald
@mightymegasaur                                     Director of Engagement
                              @gilgul
                                                          Engage121
                                                       @jennimacdonald
Agenda
•   Routines vs Anomalies
•   Trends & Trends Over Time
•   Audience fluctuations
•   Determining the “Best Time” in Social
•   Our Approach
•   Results
Networked Attention: what we learn from data
      Gilad Lotan | @gilgul | gilad@socialflow.com
Attention is the Bottleneck


                              Flickr: mangpages
Information Flows through People


                                   Alex Dragulescu
$ = f(Channel, Demographics, Time, …)


                                        Flickr: sharynmorrow
$ = f(Topic, Network, Timing, Influence, Trust,
              “engagement” …)
Daily Routines
Geographic Distribution


           USA


                 Germany   Indonesia
Data Reflects Us
Identifying Spikes
49ers: 36, Saints: 32
Typical Sports Event
                        Game ends!

49ers


         Game starts
TV Show


Social Movement             Awards
                            Ceremony
#gayrights, #lgbt, #jesus,                          #palestine, #OWS, #immigration,
#flipflop, #jobs, #economy                          #abortion
                             #republican, #dems,
                             #economics, #amnesty
Shape of an Audience
Audience Activity
@Pepsi
@AP                      Pepsi Promotion
@AJEnglish


                              Whitney Houston’s
                              Tragic Death Announced
#Kony2012
Noblesville, IN                  Birmingham, AL


Oklahoma City


                             Engelwood, Dayton, OH
                Pittsburgh
Information Flows
Gaining Your Network’s
Trust
Audience Gain
Understanding Your Audience
Audience Conversations


                         demo
- Know your audience
      What type of people follow you, how they’re connected, where in the world they
are
      Alignment between content and audience

- No to vanity metrics
      more followers doesn’t necessarily mean more engagement

- Realtime Information
      be aware of the constantly changing conversation


- Bridges vs. “Influencers”
      just because we’re connected doesn’t mean information will flow


- Building up the Right Network
      trust, resonance, interest
Results

• @TheEconomist saw 5X referral
  traffic, 290% increase in clicks per tweet

• @LynyrdSkynyrd saw a 57% increase in
  RTs and gained 90K new Facebook fans
  in 16 weeks
SocialFlow – Current Results


The average increase for
SocialFlow ReTweets rose by 944%
for 56 clients.
 Out of 8,200 tweets:
 ReTweet numbers went from from
 11 RTs/100 to 150RTs/100 tweets sent!
Thank You


                                         Jennifer
Megan Smith            Gilad Lotan      MacDonald
Account Strategist       VP of R&D    Director of Engagement
   SocialFlow            SocialFlow         Engage121
@mightymegasaur           @gilgul        @jennimacdonald

It's all about Timing; Best Practices for Optimizing your Social Media Publishing

Editor's Notes

  • #3 Born out of our blog series with Engage 121 - http://blog.socialflow.com/post/7120245229/top-8-best-practices-for-optimizing-your-social-media-publishing-series-presented-by-socialflow-and-engage-121Our first webinar covered content strategy and optimization – now we will focus purely on the timing aspect of optimization.
  • #4 My name is Gilad Lotan and I'm the VP of Research and Development at a New York City startup called SocialFlow. SocialFlow is an optimization service, helping media companies, brands and effectively anyone with a networked digital audience make better decisions about what content to publish and when - say the right thing at the right time. I'm here to talk to you about my work on digital audiences with a focus on network analysis and information flows. I look at social networks, and model an understanding on how and why information flows. What gets certain pieces of data to propagate, while the majority dies very fast.
  • #5 There are a number of ways which we attempt to answer these issues. I will not go into the tool for lack of time. But what we do is:Rank attentionResonance PredictionGraphing engagement over timeRealtime TrendsTrends over time
  • #6 In an environment where the threshold to publishing and consuming content nears zero, attention has become the bottleneck. One cannot demand attention anymore, or expect to have it at certain times of the day. We all need to understand the preferences and behavior of our respective audiences, and adapt our own behavior in order to attract the attention of users.
  • #7 information flows through people. Networks of people who decide at any given point in time what interests them, and what they choose to repost to their subsequent networks. In order for messages to propagate, people along the way must pay attention: notice them at the right time and pass them onwards. Data helps us paint a picture of our audiences, in effect see their digital silhouettes. - what do they talk about? - when are they active? - what do they say when they reference me? - who else to they care about? - how are they interconnected?The more data we have, the better we see, the better decisions we can make when talking to invisible audiences.As we do that, the better we can asses the value of a piece of content given an audience.
  • #8 We're used to static models: given a TV channel + show that's on + the demographic information about the likely audience for that show, there was a dollar value that would be given to ads that would run during the commercial breaks. The value for this TV spot is based on historic information collected over very long periods of time. The value we assign to the estimated level of attention that a piece of content will receive is based on models built over time, mostly based on historical data.
  • #9 Within social network spaces, the equation is very different. In this 140 character attention economy, true value lies in understanding how information flows - how people manage what they choose to give attention to. We're not broadcasting anymore, and cannot asses "value" of targeted group just based on static information. Things are dynamic and networked, with qualities such as: topicality, timing, influence and trust heavily affecting the spread of messages.
  • #10 In order to asses dynamics of an event as it happens, we need to know what the baseline regular patterns look like. This way we can track whats out of the ordinary, and get a better sense for how unique or important an event might be. Effectively giving us the ability to normalize or data - standardize our calculations across the board, so that we can better compare results. Important so that we can capture deviations from the normDiurnal patterns – Lo and behold: Humanity isfairly consistent!
  • #11 Obvious: if I’m targeting a US audience I’d behave different than when targeting an Indonesian crowd!
  • #13 We model what’s normal
  • #14 When we dive into that spike, we can see a discreet pattern emerge. Sports games tend to look exactly the same (+- differences in volume). Initial excitement is represented as the smaller spike to the left. And excitement builds up towards the end of the game (massive spike). By mining these types of shapes over time, we have the ability to identify an event as it is happening without knowing in advance – for example music concerts, holidays and breaking news.Certain events draw certain types of curves, certain levels of participation.
  • #15 People come together around events. In this case:MarchaAntiEPN – in blue – weekend protest that brought 90k people out to the streets across MexicoTonyawards – note the spikes that happen every time an award is announcedTrue blood – fan excitement buildup towards the TV screening.
  • #16 Once we identify events, is dive into the actual data shared during the event. Mapping them helps us get a sense for the conversation that’s emerging.Hashtags have emerged as a way for people to gather around topics or events. Way to map our what’s central around a topic – and shifting relationships between topicsLots of snarkWay for candidates to interact with fans/followers
  • #17 Sheds a light on people’s perception of the candidates.- Mitt romney: #gayrights, #lgbt, #jesus, #flipflop, #jobs, #economy- Newt Gingrich: #palestine, #OWS, #immigration, #abortion (he famously said – “Stop whining, take a bath and get a job!”Equal: #republican, #dems, #economics, #amnestyWe see this data in realtime, and how it changes over time…Co-occurence
  • #19 Or they can come together around media outlets:In this case we clearly see the diurnal pattern which suggests a substantially higher level of usage around the US timezones. But we also see that Al-Jazeera’s audience has a much wider curve, due to the geographic distribution of its audience. Additionally we see all audiences spike when breaking news occurs.
  • #20 We can see how it evolves over time – different clusters emerge as the day advances
  • #23 We can also see how they’re interconnected
  • #24 Giving a face to our audience: 1) topics 2) connectionsPre-existing clusters within the audience – can assume where they are from
  • #26 Media Outlets gained great value from breaking the news: much more attention focused on them. Now its rare that news has not leaked out to Twitter first.How does this change the ecosystem?
  • #27 There was much speculation on why the presidential announcement had to take place on sunday night. Some were on the Gaddafi side, and others, Bin Laden. Interesting about this story – You wouldn’t consider keithurbahn an influencer based on his profile – not many followers
  • #28 Media Outlets gained great value from breaking the news: much more attention focused on them. Now its rare that news has not leaked out to Twitter first.How does this change the ecosystem?
  • #29 What you see here is the node representing Keith Urbahn along with all of the retweets he generated, along with Brian Stelter from the NYTimes, and the responses he generated. Before May 1st, not even the smartest of machine learning algorithms could have predicted Keith Urbahn's likelihood to spread information on this topic, or his potential to spark an incredibly viral information flow. While politicos "in the know" certainly knew him or of him, his previous interactions and size and nature of his social graph did little to reflect his potential to generate thousands of people's willingness to trust within a matter of minutes.
  • #30 flow
  • #31 Studying and understanding how information spreads as networks intersect is key to determining what type of content has the potential to do well.Understanding where your network intersects with other networks – especially as information spreads – New audiences that we can reach.This is a visualization of the Washington Post breaking the story that Zimmerman would stand trial for the Trayvon Martin murder.Nodes in Blue are the users who saw the information b/c Breaking News reposted WAPO’s article.----- Meeting Notes (6/11/12 13:47) -----studying and understanding how information spreads as networks intersect is key to determining what type of content has the potential to "succeed"
  • #32 Here’s an example – this visualization shows how a hashtag spreads across a network of users, starting from the yellow dot on the left.We can get a sense
  • #33 Here’s a different arrangement.Tipping point is clear.
  • #34 Another way to view the participation – the dots represent a user, and their size represents the level of “influence” they’ve had within this retweet thread.
  • #35 Key points: Looking at data different ways teaches us different things about what it represents By adding social graph data, we can extract important details about the group of followers
  • #37 There are a number of ways which we attempt to answer these issues. I will not go into the tool for lack of time. But what we do is:Rank attentionResonance PredictionGraphing engagement over timeRealtime TrendsTrends over time
  • #38 We’re constantly monitoring
  • #40 Answer?… its complicated!… or use SocialFlow !
  • #43 Thank You