More Related Content Similar to Dickinson market report 1 q 2013 Similar to Dickinson market report 1 q 2013 (20) More from Jeff Bulman (7) 1. Q1-2013
133,000
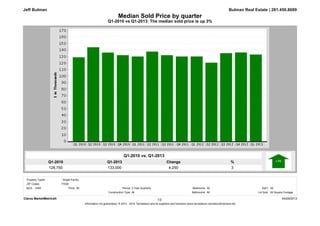
Q1-2010
128,750
%
3
Change
4,250
Q1-2010 vs Q1-2013: The median sold price is up 3%
Median Sold Price by quarter
Bulman Real Estate | 281.450.8689
Q1-2010 vs. Q1-2013
Jeff Bulman
Clarus MarketMetrics® 04/29/2013
Information not guaranteed. © 2013 - 2014 Terradatum and its suppliers and licensors (www.terradatum.com/about/licensors.td).
1/2
MLS: HAR Bedrooms:
All
All
Construction Type:
All3 Year Quarterly SqFt:
Bathrooms: Lot Size:All All Square Footage
Period:All
ZIP Codes:
Property Types: : Single-Family
77539
Price:
2. Median Sold Price by quarter
Q1-2010 vs Q1-2013: The median sold price is up 3%
Bulman Real Estate | 281.450.8689Jeff Bulman
Sold Median Price Units Avg DOMTime Period
Q1 2013 133,000 105 86
Q4 2012 136,200 104 86
Q3 2012 135,000 137 82
Q2 2012 120,450 116 101
Q1 2012 130,000 102 88
Q4 2011 129,900 100 101
Q3 2011 132,000 107 88
Q2 2011 137,500 124 101
Q1 2011 129,900 88 101
Q4 2010 132,000 85 111
Q3 2010 135,990 97 103
Q2 2010 144,100 134 79
Q1 2010 128,750 64 80
Clarus MarketMetrics® 04/29/2013
Information not guaranteed. © 2013 - 2014 Terradatum and its suppliers and licensors (www.terradatum.com/about/licensors.td).
22/
3. Q1-2013
105
Q1-2010
64
%
64
Change
41
Q1-2010 vs Q1-2013: The number of Sold properties is up 64%
Sold Properties by quarter
Bulman Real Estate | 281.450.8689
Q1-2010 vs. Q1-2013
Jeff Bulman
Clarus MarketMetrics® 04/29/2013
Information not guaranteed. © 2013 - 2014 Terradatum and its suppliers and licensors (www.terradatum.com/about/licensors.td).
1/2
MLS: HAR Bedrooms:
All
All
Construction Type:
All3 Year Quarterly SqFt:
Bathrooms: Lot Size:All All Square Footage
Period:All
ZIP Codes:
Property Types: : Single-Family
77539
Price:
4. Sold Properties by quarter
Q1-2010 vs Q1-2013: The number of Sold properties is up 64%
Bulman Real Estate | 281.450.8689Jeff Bulman
Time Period
Full Market
Units Median Price Avg DOM
Bank Properties
Units % Bank Median Price
Non-Bank Properties
Units % Non-Bank Median Price
Q1 2013 133,000105 86 24 22.9 105,000 81 77.1 138,500
Q4 2012 136,200104 86 27 26.0 97,000 77 74.0 144,900
Q3 2012 135,000137 82 38 27.7 85,850 99 72.3 146,500
Q2 2012 120,450116 101 34 29.3 80,099 82 70.7 134,950
Q1 2012 130,000102 88 29 28.4 98,500 73 71.6 139,900
Q4 2011 129,900100 101 28 28.0 78,475 72 72.0 141,644
Q3 2011 132,000107 88 29 27.1 75,600 78 72.9 138,500
Q2 2011 137,500124 101 33 26.6 75,000 91 73.4 145,000
Q1 2011 129,90088 101 16 18.2 94,500 72 81.8 131,750
Q4 2010 132,00085 111 30 35.3 105,500 55 64.7 140,000
Q3 2010 135,99097 103 23 23.7 80,000 74 76.3 149,400
Q2 2010 144,100134 79 35 26.1 115,900 99 73.9 154,900
Q1 2010 128,75064 80 25 39.1 108,900 39 60.9 136,000
Clarus MarketMetrics® 04/29/2013
Information not guaranteed. © 2013 - 2014 Terradatum and its suppliers and licensors (www.terradatum.com/about/licensors.td).
22/
5. Q1-2010 vs Q1-2013: The number of for sale properties is down -18% and the number of sold properties is up 64%
Bulman Real Estate | 281.450.8689
Q1-2010 vs. Q1-2013
530 -18
Jeff Bulman
432
Q1-2013
Supply & Demand by quarter
ChangeQ1-2010 %
-98
Q1-2010 Q1-2013 %
64 64
Q1-2010 vs. Q1-2013
105
Change
41
Clarus MarketMetrics® 04/29/2013
Information not guaranteed. © 2013 - 2014 Terradatum and its suppliers and licensors (www.terradatum.com/about/licensors.td).
1/2
MLS: HAR Bedrooms:
All
All
Construction Type:
All3 Year Quarterly SqFt:
Bathrooms: Lot Size:All All Square Footage
Period:All
ZIP Codes:
Property Types: : Single-Family
77539
Price:
6. Supply & Demand by quarter
Q1-2010 vs Q1-2013: The number of for sale properties is down -18% and the number of sold properties is up 64%
Jeff Bulman Bulman Real Estate | 281.450.8689
For Sale Sold
# Properties
Avg DOM Avg DOM
# Properties
Time Period
Q1 2013 115 86432 105
Q4 2012 126 86406 104
Q3 2012 112 82471 137
Q2 2012 117 101496 116
Q1 2012 130 88501 102
Q4 2011 149 101496 100
Q3 2011 130 88571 107
Q2 2011 121 101570 124
Q1 2011 133 101543 88
Q4 2010 139 111541 85
Q3 2010 125 103636 97
Q2 2010 119 79617 134
Q1 2010 118 80530 64
Clarus MarketMetrics® 04/29/2013
Information not guaranteed. © 2013 - 2014 Terradatum and its suppliers and licensors (www.terradatum.com/about/licensors.td).
22/
7. Q1-2013
81
Q1-2010
83
%
-3
Change
-2
Q1-2010 vs Q1-2013: The average days on market is down -3%
The Average Days on Market by quarter
Bulman Real Estate | 281.450.8689
Q1-2010 vs. Q1-2013
Jeff Bulman
77539
All 3 Year Quarterly
ZIP Codes:
Period:Price:
Property Types: : Single-Family
04/29/20131/2Clarus MarketMetrics®
All Square Footage
Bedrooms: All AllSqFt:
All Lot Size:Bathrooms:AllConstruction Type:
MLS: HAR
8. The Average Days on Market by quarter
Q1-2010 vs Q1-2013: The average days on market is down -3%
Bulman Real Estate | 281.450.8689Jeff Bulman
# UC UnitsAvg DOMTime Period
Q1 2013 13581
Q4 2012 9593
Q3 2012 12975
Q2 2012 12395
Q1 2012 12596
Q4 2011 97102
Q3 2011 10994
Q2 2011 11092
Q1 2011 108103
Q4 2010 76106
Q3 2010 92114
Q2 2010 12380
Q1 2010 9483
Clarus MarketMetrics® 2/2 04/29/2013
Information not guaranteed. © 2013 - 2014 Terradatum and its suppliers and licensors (www.terradatum.com/about/licensors.td).