8447779800, Low rate Call girls in Saket Delhi NCR
August 2013 Housing Sales Statistics
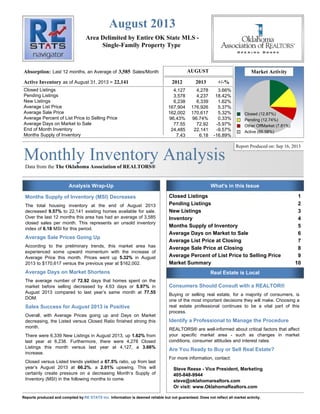
1. Monthly Inventory AnalysisData from the The Oklahoma Association of REALTORS®
Area Delimited by Entire OK State MLS -
Single-Family Property Type
August 2013
Report Produced on: Sep 16, 2013
Absorption:
Active Inventory
3,585
22,141
AUGUST Market Activity
2012 2013 +/-%
Last 12 months, an Average of Sales/Month
as of August 31, 2013 =
Closed Listings
Pending Listings
New Listings
Average List Price
Average Sale Price
Average Percent of List Price to Selling Price
Average Days on Market to Sale
End of Month Inventory
Months Supply of Inventory
Closed Listings 1
Pending Listings 2
New Listings 3
Inventory 4
Months Supply of Inventory 5
Average Days on Market to Sale 6
Average List Price at Closing 7
Average Sale Price at Closing 8
Average Percent of List Price to Selling Price 9
Market Summary 10
4,127 4,278 3.66%
3,578 4,237 18.42%
6,238 6,339 1.62%
167,904 176,926 5.37%
162,002 170,617 5.32%
96.43% 96.74% 0.33%
77.55 72.92 -5.97%
24,485 22,141 -9.57%
7.43 6.18 -16.89%
Analysis Wrap-Up What's in this Issue
Real Estate is Local
Closed (12.87%)
Pending (12.74%)
Other OffMarket (7.81%)
Active (66.58%)
Months Supply of Inventory (MSI) Decreases
The total housing inventory at the end of August 2013
decreased 9.57% to 22,141 existing homes available for sale.
Over the last 12 months this area has had an average of 3,585
closed sales per month. This represents an unsold inventory
index of 6.18 MSI for this period.
Average Sale Prices Going Up
According to the preliminary trends, this market area has
experienced some upward momentum with the increase of
Average Price this month. Prices went up 5.32% in August
2013 to $170,617 versus the previous year at $162,002.
Average Days on Market Shortens
The average number of 72.92 days that homes spent on the
market before selling decreased by 4.63 days or 5.97% in
August 2013 compared to last year’s same month at 77.55
DOM.
Sales Success for August 2013 is Positive
Overall, with Average Prices going up and Days on Market
decreasing, the Listed versus Closed Ratio finished strong this
month.
There were 6,339 New Listings in August 2013, up 1.62% from
last year at 6,238. Furthermore, there were 4,278 Closed
Listings this month versus last year at 4,127, a 3.66%
increase.
Closed versus Listed trends yielded a 67.5% ratio, up from last
year’s August 2013 at 66.2%, a 2.01% upswing. This will
certainly create pressure on a decreasing Month’s Supply of
Inventory (MSI) in the following months to come.
Consumers Should Consult with a REALTOR®
Buying or selling real estate, for a majority of consumers, is
one of the most important decisions they will make. Choosing a
real estate professional continues to be a vital part of this
process.
Identify a Professional to Manage the Procedure
REALTORS® are well-informed about critical factors that affect
your specific market area - such as changes in market
conditions, consumer attitudes and interest rates.
Are You Ready to Buy or Sell Real Estate?
For more information, contact:
Steve Reese - Vice President, Marketing
405-848-9944
steve@oklahomarealtors.com
Or visit: www.OklahomaRealtors.com
Reports produced and compiled by Information is deemed reliable but not guaranteed. Does not reflect all market activity.RE STATS Inc.
2. Monthly Inventory Analysis
The Oklahoma Association of
REALTORS®
August 2013
ClosedListings
Closed Listings
ReadytoBuyorSellRealEstate?
ContactanexperiencedREALTOR
Data from the
Area Delimited by Entire OK State MLS - Single-Family Property Type
Closed Sales as of Sep 14, 2013
Report Produced on: Sep 16, 2013
AUGUST YEAR TO DATE (YTD)
5 YEAR MARKET ACTIVITY TRENDS 5yr AUG AVG = 3,653 3 MONTHS
CLOSED LISTINGS & BEDROOMS DISTRIBUTION BY PRICE
High
Low
Jul 2013 = 4,605
Jan 2010 = 1,718
Closed Listingsthis
month at
above the 5 yr AUG
average of
4,278,
3,653
J
U
N
J
U
L
A
U
G
Distribution of Closed Listings by Price Range % AVDOM 2 Beds 3 Beds 4 Beds 5 Beds+
2009
3,428
2010
2,964
2011
3,466
2012
4,127
2013
4,278
1 Year
2 Year
+3.66%
+23.43%
2009
25,109
2010
24,575
2011
23,766
2012
27,978
2013
30,065
1 Year
2 Year
+7.46%
+26.50%
4,091
4,605
12.56%
4,278
-7.10%
411 9.61% 79.4 185 198 24 4
$50,000
and less
353 8.25% 88.7 108 213 30 2
$50,001
$75,000
452 10.57% 79.1 106 297 46 3
$75,001
$100,000
1,062 24.82% 64.8 172 742 140 8
$100,001
$150,000
850 19.87% 66.5 116 497 226 11
$150,001
$200,000
631 14.75% 69.0 90 254 270 17
$200,001
$275,000
519 12.13% 83.7 42 136 279 62
$275,001
and up
5,000
4,000
3,000
2,000
1,000
0
Jun 2009 Dec 2009Jun 2010 Dec 2010Jun 2011 Dec 2011Jun 2012 Dec 2012Jun 2013
Total Closed Units:
Total Closed Volume:
Average Closed Price:
4,278
729,899,704
$170,617
72.9 819
101.59M
$124,046
2337
339.69M
$145,352
1015
243.32M
$239,720
107
45.30M
$423,390
pp. 1Reports produced and compiled by Information is deemed reliable but not guaranteed. Does not reflect all market activity.RE STATS Inc.
Steve Reese 405-848-9944 steve@oklahomarealtors.com
3. Monthly Inventory Analysis
The Oklahoma Association of
REALTORS®
August 2013
PendingListings
Pending Listings
ReadytoBuyorSellRealEstate?
ContactanexperiencedREALTOR
Data from the
Area Delimited by Entire OK State MLS - Single-Family Property Type
Pending Listings as of Sep 14, 2013
Report Produced on: Sep 16, 2013
AUGUST YEAR TO DATE (YTD)
5 YEAR MARKET ACTIVITY TRENDS 5yr AUG AVG = 3,544 3 MONTHS
PENDING LISTINGS & BEDROOMS DISTRIBUTION BY PRICE
High
Low
Apr 2010 = 4,935
Dec 2009 = 2,021
Pending Listingsthis
month at
above the 5 yr AUG
average of
4,237,
3,544
J
U
N
J
U
L
A
U
G
Distribution of Pending Listings by Price Range % AVDOM 2 Beds 3 Beds 4 Beds 5 Beds+
2009
3,672
2010
2,852
2011
3,383
2012
3,578
2013
4,237
1 Year
2 Year
+18.42%
+25.24%
2009
27,111
2010
25,366
2011
25,152
2012
29,622
2013
32,430
1 Year
2 Year
+9.48%
+28.94%
4,280
4,204
-1.78%
4,237
0.78%
148 3.49% 81.8 72 65 8 3
$25,000
and less
711 16.78% 80.3 267 395 41 8
$25,001
$75,000
471 11.12% 75.9 116 318 36 1
$75,001
$100,000
1,040 24.55% 62.5 181 731 120 8
$100,001
$150,000
823 19.42% 63.3 112 491 210 10
$150,001
$200,000
525 12.39% 69.4 69 192 241 23
$200,001
$275,000
519 12.25% 75.2 50 131 274 64
$275,001
and up
5,000
4,000
3,000
2,000
1,000
0
Jun 2009 Dec 2009Jun 2010 Dec 2010Jun 2011 Dec 2011Jun 2012 Dec 2012Jun 2013
Total Pending Units:
Total Pending Volume:
Average Listing Price:
4,237
705,434,472
$167,792
82.2 867
105.34M
$121,500
2323
326.34M
$140,483
930
226.17M
$243,191
117
47.58M
$406,704
pp. 2Reports produced and compiled by Information is deemed reliable but not guaranteed. Does not reflect all market activity.RE STATS Inc.
Steve Reese 405-848-9944 steve@oklahomarealtors.com
4. Monthly Inventory Analysis
The Oklahoma Association of
REALTORS®
August 2013
NewListings
New Listings
ReadytoBuyorSellRealEstate?
ContactanexperiencedREALTOR
Data from the
Area Delimited by Entire OK State MLS - Single-Family Property Type
New Listings as of Sep 14, 2013
Report Produced on: Sep 16, 2013
AUGUST YEAR TO DATE (YTD)
5 YEAR MARKET ACTIVITY TRENDS 5yr AUG AVG = 6,042 3 MONTHS
NEW LISTINGS & BEDROOMS DISTRIBUTION BY PRICE
High
Low
Apr 2010 = 7,792
Dec 2012 = 3,696
New Listings this
month at
above the 5 yr AUG
average of
6,339,
6,042
J
U
N
J
U
L
A
U
G
Distribution of New Listings by Price Range % 2 Beds 3 Beds 4 Beds 5 Beds+
2009
5,729
2010
6,024
2011
5,882
2012
6,238
2013
6,339
1 Year
2 Year
+1.62%
+7.77%
2009
46,357
2010
49,402
2011
48,582
2012
51,090
2013
52,122
1 Year
2 Year
+2.02%
+7.29%
6,755
7,132
5.58%
6,339
-11.12%
612 9.65% 280 279 50 3
$50,000
and less
592 9.34% 219 329 42 2
$50,001
$75,000
750 11.83% 195 488 59 8
$75,001
$100,000
1,497 23.62% 270 1,027 186 14
$100,001
$150,000
1,427 22.51% 218 776 408 25
$150,001
$225,000
766 12.08% 92 302 332 40
$225,001
$300,000
695 10.96% 49 163 361 122
$300,001
and up
8,000
7,000
6,000
5,000
4,000
3,000
2,000
1,000
0
Jun 2009 Dec 2009Jun 2010 Dec 2010Jun 2011 Dec 2011Jun 2012 Dec 2012Jun 2013
Total New Listed Units:
Total New Listed Volume:
Average New Listed Listing Price:
6,339
1,144,645,866
$190,017
1323
162.19M
$122,592
3364
504.09M
$149,847
1438
372.18M
$258,818
214
106.19M
$496,208
pp. 3Reports produced and compiled by Information is deemed reliable but not guaranteed. Does not reflect all market activity.RE STATS Inc.
Steve Reese 405-848-9944 steve@oklahomarealtors.com
5. Monthly Inventory Analysis
The Oklahoma Association of
REALTORS®
August 2013
ActiveInventory
Active Inventory
ReadytoBuyorSellRealEstate?
ContactanexperiencedREALTOR
Data from the
Area Delimited by Entire OK State MLS - Single-Family Property Type
Active Inventory as of Sep 14, 2013
Report Produced on: Sep 16, 2013
END OF AUGUST ACTIVE DURING AUGUST
5 YEAR MARKET ACTIVITY TRENDS 5yr AUG AVG = 24,208 3 MONTHS
INVENTORY & BEDROOMS DISTRIBUTION BY PRICE
High
Low
Jul 2011 = 26,756
Dec 2009 = 19,798
Inventory this
month at
below the 5 yr AUG
average of
22,141,
24,208
J
U
N
J
U
L
A
U
G
Distribution of Inventory by Price Range % AVDOM 2 Beds 3 Beds 4 Beds 5 Beds+
2009
21,916
2010
25,895
2011
26,616
2012
24,470
2013
22,141
1 Year
2 Year
-9.52%
-16.81%
2009
27,980
2010
31,165
2011
32,600
2012
30,610
2013
28,977
1 Year
2 Year
-5.33%
-11.11%
22,139
22,646
2.29%
22,141
-2.23%
2,001 9.04% 115.0 1,021 845 125 10
$50,000
and less
2,230 10.07% 115.5 873 1,200 137 20
$50,001
$75,000
2,730 12.33% 108.0 754 1,730 218 28
$75,001
$100,000
6,751 30.49% 97.9 1,269 4,281 1,100 101
$100,001
$175,000
2,713 12.25% 99.2 447 1,308 889 69
$175,001
$225,000
3,264 14.74% 105.4 465 1,112 1,438 249
$225,001
$350,000
2,452 11.07% 119.8 241 501 1,142 568
$350,001
and up
30,000
20,000
10,000
0
Jun 2009 Dec 2009Jun 2010 Dec 2010Jun 2011 Dec 2011Jun 2012 Dec 2012Jun 2013
Total Active Inventory by Units:
Total Active Inventory by Volume:
Average Active Inventory Listing Price:
22,141
4,411,609,803
$199,251
106.1 5,070
701.68M
$138,398
10,977
1.71B
$155,545
5,049
1.44B
$286,144
1,045
557.77M
$533,752
pp. 4Reports produced and compiled by Information is deemed reliable but not guaranteed. Does not reflect all market activity.RE STATS Inc.
Steve Reese 405-848-9944 steve@oklahomarealtors.com
6. Monthly Inventory Analysis
The Oklahoma Association of
REALTORS®
August 2013
MonthsSupply
Months Supply of Inventory
ReadytoBuyorSellRealEstate?
ContactanexperiencedREALTOR
Data from the
Area Delimited by Entire OK State MLS - Single-Family Property Type
Active Inventory as of Sep 14, 2013
Report Produced on: Sep 16, 2013
MSI FOR AUGUST INDICATORS FOR AUGUST 2013
5 YEAR MARKET ACTIVITY TRENDS 5yr AUG AVG = 7.7 3 MONTHS
MONTHS SUPPLY & BEDROOMS DISTRIBUTION BY PRICE
High
Low
Jun 2011 = 9.7
Feb 2013 = 6.0
Months Supply this
month at
below the 5 yr AUG
average of
6.2,
7.7
J
U
N
J
U
L
A
U
G
Distribution of Active Inventory by Price Range and MSI % MSI 2 Beds 3 Beds 4 Beds 5 Beds+
2009
7.2
2010
8.3
2011
9.4
2012
7.4
2013
6.2
1 Year
2 Year
-16.84%
-34.61%
Inventory
22,141
End of
Month
Active
Inventory
Closed
43,014
Closed
Last
12
Months
Absorption
3,585
Average
Closed per
Month over
12 Months
MSI
6.2
Months
Supply
of
Inventory
MSI %
16.189%
Percent
Months
Supply of
Inventory
6.3
6.3
0.76%
6.2
-2.57%
2,001 9.04% 4.7 5.6 4.1 4.6 3.2
$50,000
and less
2,848 12.86% 7.3 9.1 6.6 5.4 8.2
$50,001
$80,000
2,903 13.11% 6.4 7.0 6.2 6.5 11.2
$80,001
$110,000
5,589 25.24% 5.2 5.9 4.8 5.4 12.6
$110,001
$170,000
3,659 16.53% 5.7 7.0 5.4 5.4 6.5
$170,001
$240,000
2,906 13.12% 7.1 8.7 7.4 6.2 9.3
$240,001
$370,000
2,235 10.09% 12.7 16.3 13.2 10.8 16.4
$370,001
and up
10
9
8
7
6
5
4
3
2
1
0
Jun 2009 Dec 2009 Jun 2010 Dec 2010 Jun 2011 Dec 2011 Jun 2012 Dec 2012 Jun 2013
MSI:
Total Active Inventory: 22,141
6.2 7.0
5,070
5.6
10,977
6.3
5,049
11.5
1,045
pp. 5Reports produced and compiled by Information is deemed reliable but not guaranteed. Does not reflect all market activity.RE STATS Inc.
Steve Reese 405-848-9944 steve@oklahomarealtors.com
7. Monthly Inventory Analysis
The Oklahoma Association of
REALTORS®
August 2013
AverageDaysonMarket
Average Days on Market to Sale
ReadytoBuyorSellRealEstate?
ContactanexperiencedREALTOR
Data from the
Area Delimited by Entire OK State MLS - Single-Family Property Type
Closed Sales as of Sep 14, 2013
Report Produced on: Sep 16, 2013
AUGUST YEAR TO DATE (YTD)
5 YEAR MARKET ACTIVITY TRENDS 5yr AUG AVG = 77 3 MONTHS
AVERAGE DOM OF CLOSED SALES & BEDROOMS DISTRIBUTION BY PRICE
High
Low
Mar 2011 = 98
Jul 2013 = 69
Average DOM this
month at
below the 5 yr AUG
average of
73,
77
J
U
N
J
U
L
A
U
G
Distribution of Average Days on Market to Sale by Price Range % AVDOM 2 Beds 3 Beds 4 Beds 5 Beds+
2009
76
2010
79
2011
82
2012
78
2013
73
1 Year
2 Year
-5.97%
-10.84%
2009
85
2010
78
2011
89
2012
83
2013
76
1 Year
2 Year
-9.30%
-15.38%
69
69
-0.31%
73
5.54%
411 9.61% 79.4 88.2 72.6 71.0 59.0
$50,000
and less
353 8.25% 88.7 99.8 79.2 98.3 367.5
$50,001
$75,000
452 10.57% 79.1 91.2 75.4 77.2 44.7
$75,001
$100,000
1,062 24.82% 64.8 80.2 62.0 61.6 43.6
$100,001
$150,000
850 19.87% 66.5 79.6 62.3 68.2 80.9
$150,001
$200,000
631 14.75% 69.0 80.3 65.8 68.5 65.8
$200,001
$275,000
519 12.13% 83.7 160.4 74.3 79.5 71.0
$275,001
and up
100
90
80
70
60
50
40
30
20
10
0
Jun 2009 Dec 2009 Jun 2010 Dec 2010 Jun 2011 Dec 2011 Jun 2012 Dec 2012 Jun 2013
Average Closed DOM:
Total Closed Units:
Total Closed Volume:
72.9
4,278
729,899,704
90.0
819
101.59M
67.4
2337
339.69M
71.8
1015
243.32M
73.5
107
45.30M
pp. 6Reports produced and compiled by Information is deemed reliable but not guaranteed. Does not reflect all market activity.RE STATS Inc.
Steve Reese 405-848-9944 steve@oklahomarealtors.com
8. Monthly Inventory Analysis
The Oklahoma Association of
REALTORS®
August 2013
AverageListPrice
Average List Price at Closing
ReadytoBuyorSellRealEstate?
ContactanexperiencedREALTOR
Data from the
Area Delimited by Entire OK State MLS - Single-Family Property Type
Closed Sales as of Sep 14, 2013
Report Produced on: Sep 16, 2013
AUGUST YEAR TO DATE (YTD)
5 YEAR MARKET ACTIVITY TRENDS 5yr AUG AVG = 163K 3 MONTHS
AVERAGE LIST PRICE OF CLOSED SALES & BEDROOMS DISTRIBUTION BY PRICE
High
Low
Aug 2013 = 176,926
Jan 2010 = 139,110
Average LPrice this
month at
above the 5 yr AUG
average of
176,926,
162,945
J
U
N
J
U
L
A
U
G
Distribution of Average List Price at Closing by Price Range % AVL$ 2 Beds 3 Beds 4 Beds 5 Beds+
2009
154,051
2010
156,075
2011
159,769
2012
167,904
2013
176,926
1 Year
2 Year
+5.37%
+10.74%
2009
150,492
2010
151,349
2011
155,942
2012
159,370
2013
169,674
1 Year
2 Year
+6.47%
+8.81%
174,752
176,580
1.05%
176,926
0.20%
378 8.84% 32,819 32,318 37,160 36,473 50,725
$50,000
and less
344 8.04% 64,982 68,207 67,704 68,260 78,500
$50,001
$75,000
438 10.24% 88,816 92,108 91,905 91,702 95,500
$75,001
$100,000
1,059 24.75% 128,588 131,837 130,087 135,388 130,588
$100,001
$150,000
871 20.36% 174,363 179,213 175,894 179,141 182,782
$150,001
$200,000
633 14.80% 234,779 240,955 235,993 241,371 238,841
$200,001
$275,000
555 12.97% 444,269 425,071 414,931 423,360 705,739
$275,001
and up
200,000
100,000
0
Jun 2009Dec 2009Jun 2010Dec 2010Jun 2011Dec 2011Jun 2012Dec 2012Jun 2013
Average List Price:
Total Closed Units:
Total List Volume:
$176,926
4,278
756,890,463
$129,563
819
106.11M
$149,504
2337
349.39M
$246,176
1015
249.87M
$481,475
107
51.52M
pp. 7Reports produced and compiled by Information is deemed reliable but not guaranteed. Does not reflect all market activity.RE STATS Inc.
Steve Reese 405-848-9944 steve@oklahomarealtors.com
9. Monthly Inventory Analysis
The Oklahoma Association of
REALTORS®
August 2013
AverageSoldPrice
Average Sold Price at Closing
ReadytoBuyorSellRealEstate?
ContactanexperiencedREALTOR
Data from the
Area Delimited by Entire OK State MLS - Single-Family Property Type
Closed Sales as of Sep 14, 2013
Report Produced on: Sep 16, 2013
AUGUST YEAR TO DATE (YTD)
5 YEAR MARKET ACTIVITY TRENDS 5yr AUG AVG = 157K 3 MONTHS
AVERAGE SOLD PRICE OF CLOSED SALES & BEDROOMS DISTRIBUTION BY PRICE
High
Low
Jul 2013 = 171,531
Jan 2010 = 133,468
Average SPrice this
month at
above the 5 yr AUG
average of
170,617,
157,020
J
U
N
J
U
L
A
U
G
Distribution of Average Sold Price at Closing by Price Range % AVS$ 2 Beds 3 Beds 4 Beds 5 Beds+
2009
148,524
2010
150,097
2011
153,859
2012
162,002
2013
170,617
1 Year
2 Year
+5.32%
+10.89%
2009
145,122
2010
145,917
2011
149,819
2012
153,712
2013
164,268
1 Year
2 Year
+6.87%
+9.64%
170,040
171,531
0.88%
170,617
-0.53%
411 9.61% 31,281 28,701 33,230 33,534 40,647
$50,000
and less
353 8.25% 64,300 64,220 64,374 63,622 71,000
$50,001
$75,000
452 10.57% 88,048 87,563 88,142 88,501 88,967
$75,001
$100,000
1,062 24.82% 127,757 127,604 127,013 131,892 127,675
$100,001
$150,000
850 19.87% 173,617 173,760 172,776 175,095 179,705
$150,001
$200,000
631 14.75% 234,108 234,801 231,395 236,605 231,335
$200,001
$275,000
519 12.13% 430,777 400,714 399,491 410,796 609,684
$275,001
and up
200,000
100,000
0
Jun 2009Dec 2009Jun 2010Dec 2010Jun 2011Dec 2011Jun 2012Dec 2012Jun 2013
Average Closed Price:
Total Closed Units:
Total Closed Volume:
$170,617
4,278
729,899,704
$124,046
819
101.59M
$145,352
2337
339.69M
$239,720
1015
243.32M
$423,390
107
45.30M
pp. 8Reports produced and compiled by Information is deemed reliable but not guaranteed. Does not reflect all market activity.RE STATS Inc.
Steve Reese 405-848-9944 steve@oklahomarealtors.com
10. Monthly Inventory Analysis
The Oklahoma Association of
REALTORS®
August 2013
AverageList/SellPrice
Average Percent of List Price to Selling Price
ReadytoBuyorSellRealEstate?
ContactanexperiencedREALTOR
Data from the
Area Delimited by Entire OK State MLS - Single-Family Property Type
Closed Sales as of Sep 14, 2013
Report Produced on: Sep 16, 2013
AUGUST YEAR TO DATE (YTD)
5 YEAR MARKET ACTIVITY TRENDS 5yr AUG AVG=96.37% 3 MONTHS
AVERAGE L/S% OF CLOSED SALES & BEDROOMS DISTRIBUTION BY PRICE
High
Low
Jun 2013 = 96.99%
Jan 2011 = 95.22%
Average List/Sell this
month at
above the 5 yr AUG
average of
96.74%,
96.37%
J
U
N
J
U
L
A
U
G
Distribution of $avgmed L/S % by Price Range % AVL/S% 2 Beds 3 Beds 4 Beds 5 Beds+
2009
96.88%
2010
95.59%
2011
96.20%
2012
96.43%
2013
96.74%
1 Year
2 Year
+0.33%
+0.57%
2009
96.31%
2010
96.26%
2011
95.83%
2012
96.28%
2013
96.70%
1 Year
2 Year
+0.43%
+0.91%
96.99%
96.96%
-0.02%
96.74%
-0.23%
411 9.61% 91.22% 89.86% 92.40% 93.42% 82.41%
$50,000
and less
353 8.25% 95.25% 94.73% 95.71% 94.20% 90.63%
$50,001
$75,000
452 10.57% 96.31% 95.71% 96.38% 97.39% 94.15%
$75,001
$100,000
1,062 24.82% 97.68% 96.97% 97.85% 97.63% 98.07%
$100,001
$150,000
850 19.87% 98.05% 97.17% 98.33% 97.86% 98.32%
$150,001
$200,000
631 14.75% 98.02% 97.53% 98.14% 98.12% 97.00%
$200,001
$275,000
519 12.13% 96.92% 94.93% 97.48% 97.62% 93.91%
$275,001
and up
97
96
95
Jun 2009 Dec 2009 Jun 2010 Dec 2010 Jun 2011 Dec 2011 Jun 2012 Dec 2012 Jun 2013
Average List/Sell Ratio:
Total Closed Units:
Total Closed Volume:
96.70%
4,278
729,899,704
94.89%
819
101.59M
97.12%
2337
339.69M
97.60%
1015
243.32M
94.68%
107
45.30M
pp. 9Reports produced and compiled by Information is deemed reliable but not guaranteed. Does not reflect all market activity.RE STATS Inc.
Steve Reese 405-848-9944 steve@oklahomarealtors.com
11. Monthly Inventory Analysis
The Oklahoma Association of
REALTORS®
August 2013
Market Summary
Data from the
Area Delimited by Entire OK State MLS - Single-Family Property Type
Inventory as of Sep 14, 2013
Report Produced on: Sep 16, 2013
Inventory Inventory Market Activity Market Activity
New Listings Closed Sales
Pending Sales
Other Off Market
Active Inventory
Start Inventory
Total Inventory
Units
Volume
6,339 = 21.87%
22,652
28,991
$5,648,723,056
4,278 = 12.87%
4,237 = 12.74%
2,597 = 7.81%
22,141 = 66.58%
Absorption:
Active Inventory
3,585
22,141
AUGUST Year To Date
2012 2013 +/-% 2012 2013 +/-%
Last 12 months, an Average of Sales/Month
as of August 31, 2013 =
Closed Sales
Pending Sales
New Listings
Average List Price
Average Sale Price
Average Percent of List Price to Selling Price
Average Days on Market to Sale
Monthly Inventory
Months Supply of Inventory
4,127 4,278 3.66%
3,578 4,237 18.42%
6,238 6,339 1.62%
167,904 176,926 5.37%
162,002 170,617 5.32%
96.43% 96.74% 0.33%
77.55 72.92 -5.97%
24,485 22,141 -9.57%
7.43 6.18 -16.89%
27,978 30,065 7.46%
29,622 32,430 9.48%
51,090 52,122 2.02%
159,370 169,674 6.47%
153,712 164,268 6.87%
96.28% 96.70% 0.43%
83.30 75.56 -9.30%
24,485 22,141 -9.57%
7.43 6.18 -16.89%
New Listings Pending Listings List Price Sale Price
Active Inventory Monthly Supply of Inventory % of List to Sale Price Days on Market to Sale
2012
2013
2012
2013
2012
2013
2012
2013
AUGUST MARKET AVERAGE PRICES
INVENTORY AVERAGE L/S% & DOM
6,238
3,578
6,339
+1.62%
4,237
+18.42%
167,904
162,002
176,926
+5.37%
170,617
+5.32%
24,485 7.43
22,141
-9.57%
6.18
-16.89%
96.43%
77.5596.74%
+0.33%
72.92
-5.97%
pp. 10Reports produced and compiled by Information is deemed reliable but not guaranteed. Does not reflect all market activity.RE STATS Inc.
Steve Reese 405-848-9944 steve@oklahomarealtors.com