Seabrook Texas Homes Market Report - 1st Quarter 2013
•
0 likes•182 views

A report on single family home sales activity in Seabrook, Texas for the first quarter of 2013.

Recommended
Recommended
More Related Content
What's hot
What's hot (20)
Viewers also liked
Viewers also liked (10)
Similar to Seabrook Texas Homes Market Report - 1st Quarter 2013
Similar to Seabrook Texas Homes Market Report - 1st Quarter 2013 (20)
Recently uploaded
Recently uploaded (20)
Seabrook Texas Homes Market Report - 1st Quarter 2013
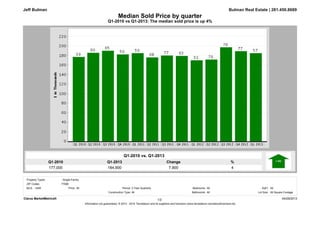
- 1. Q1-2013 184,900 Q1-2010 177,000 % 4 Change 7,900 Q1-2010 vs Q1-2013: The median sold price is up 4% Median Sold Price by quarter Bulman Real Estate | 281.450.8689 Q1-2010 vs. Q1-2013 Jeff Bulman Clarus MarketMetrics® 04/29/2013 Information not guaranteed. © 2013 - 2014 Terradatum and its suppliers and licensors (www.terradatum.com/about/licensors.td). 1/2 MLS: HAR Bedrooms: All All Construction Type: All3 Year Quarterly SqFt: Bathrooms: Lot Size:All All Square Footage Period:All ZIP Codes: Property Types: : Single-Family 77586 Price:
- 2. Median Sold Price by quarter Q1-2010 vs Q1-2013: The median sold price is up 4% Bulman Real Estate | 281.450.8689Jeff Bulman Sold Median Price Units Avg DOMTime Period Q1 2013 184,900 57 59 Q4 2012 189,000 77 76 Q3 2012 197,250 78 79 Q2 2012 171,493 70 86 Q1 2012 170,000 52 83 Q4 2011 179,000 63 81 Q3 2011 180,000 77 88 Q2 2011 176,000 68 86 Q1 2011 185,000 50 90 Q4 2010 182,250 50 91 Q3 2010 190,000 65 97 Q2 2010 185,700 60 66 Q1 2010 177,000 39 89 Clarus MarketMetrics® 04/29/2013 Information not guaranteed. © 2013 - 2014 Terradatum and its suppliers and licensors (www.terradatum.com/about/licensors.td). 22/
- 3. Q1-2013 57 Q1-2010 39 % 46 Change 18 Q1-2010 vs Q1-2013: The number of Sold properties is up 46% Sold Properties by quarter Bulman Real Estate | 281.450.8689 Q1-2010 vs. Q1-2013 Jeff Bulman Clarus MarketMetrics® 04/29/2013 Information not guaranteed. © 2013 - 2014 Terradatum and its suppliers and licensors (www.terradatum.com/about/licensors.td). 1/2 MLS: HAR Bedrooms: All All Construction Type: All3 Year Quarterly SqFt: Bathrooms: Lot Size:All All Square Footage Period:All ZIP Codes: Property Types: : Single-Family 77586 Price:
- 4. Sold Properties by quarter Q1-2010 vs Q1-2013: The number of Sold properties is up 46% Bulman Real Estate | 281.450.8689Jeff Bulman Time Period Full Market Units Median Price Avg DOM Bank Properties Units % Bank Median Price Non-Bank Properties Units % Non-Bank Median Price Q1 2013 184,90057 59 6 10.5 132,250 51 89.5 192,000 Q4 2012 189,00077 76 9 11.7 157,200 68 88.3 192,593 Q3 2012 197,25078 79 13 16.7 97,500 65 83.3 202,210 Q2 2012 171,49370 86 12 17.1 81,550 58 82.9 186,450 Q1 2012 170,00052 83 13 25.0 135,000 39 75.0 175,000 Q4 2011 179,00063 81 8 12.7 130,215 55 87.3 187,000 Q3 2011 180,00077 88 11 14.3 145,000 66 85.7 180,931 Q2 2011 176,00068 86 10 14.7 141,000 58 85.3 185,450 Q1 2011 185,00050 90 5 10.0 125,000 45 90.0 199,900 Q4 2010 182,25050 91 7 14.0 164,400 43 86.0 183,820 Q3 2010 190,00065 97 4 6.2 557,500 61 93.8 187,513 Q2 2010 185,70060 66 13 21.7 167,000 47 78.3 188,000 Q1 2010 177,00039 89 6 15.4 120,000 33 84.6 182,647 Clarus MarketMetrics® 04/29/2013 Information not guaranteed. © 2013 - 2014 Terradatum and its suppliers and licensors (www.terradatum.com/about/licensors.td). 22/
- 5. Q1-2010 vs Q1-2013: The number of for sale properties is down -22% and the number of sold properties is up 46% Bulman Real Estate | 281.450.8689 Q1-2010 vs. Q1-2013 300 -22 Jeff Bulman 234 Q1-2013 Supply & Demand by quarter ChangeQ1-2010 % -66 Q1-2010 Q1-2013 % 39 46 Q1-2010 vs. Q1-2013 57 Change 18 Clarus MarketMetrics® 04/29/2013 Information not guaranteed. © 2013 - 2014 Terradatum and its suppliers and licensors (www.terradatum.com/about/licensors.td). 1/2 MLS: HAR Bedrooms: All All Construction Type: All3 Year Quarterly SqFt: Bathrooms: Lot Size:All All Square Footage Period:All ZIP Codes: Property Types: : Single-Family 77586 Price:
- 6. Supply & Demand by quarter Q1-2010 vs Q1-2013: The number of for sale properties is down -22% and the number of sold properties is up 46% Jeff Bulman Bulman Real Estate | 281.450.8689 For Sale Sold # Properties Avg DOM Avg DOM # Properties Time Period Q1 2013 105 59234 57 Q4 2012 116 76218 77 Q3 2012 104 79262 78 Q2 2012 119 86259 70 Q1 2012 141 83251 52 Q4 2011 136 81278 63 Q3 2011 123 88314 77 Q2 2011 114 86360 68 Q1 2011 122 90328 50 Q4 2010 135 91299 50 Q3 2010 122 97349 65 Q2 2010 111 66368 60 Q1 2010 118 89300 39 Clarus MarketMetrics® 04/29/2013 Information not guaranteed. © 2013 - 2014 Terradatum and its suppliers and licensors (www.terradatum.com/about/licensors.td). 22/
- 7. Q1-2013 64 Q1-2010 83 % -23 Change -19 Q1-2010 vs Q1-2013: The average days on market is down -23% The Average Days on Market by quarter Bulman Real Estate | 281.450.8689 Q1-2010 vs. Q1-2013 Jeff Bulman 77586 All 3 Year Quarterly ZIP Codes: Period:Price: Property Types: : Single-Family 04/29/20131/2Clarus MarketMetrics® All Square Footage Bedrooms: All AllSqFt: All Lot Size:Bathrooms:AllConstruction Type: MLS: HAR
- 8. The Average Days on Market by quarter Q1-2010 vs Q1-2013: The average days on market is down -23% Bulman Real Estate | 281.450.8689Jeff Bulman # UC UnitsAvg DOMTime Period Q1 2013 7664 Q4 2012 6271 Q3 2012 8074 Q2 2012 8087 Q1 2012 6090 Q4 2011 5481 Q3 2011 6286 Q2 2011 7777 Q1 2011 65101 Q4 2010 4597 Q3 2010 6381 Q2 2010 6381 Q1 2010 4883 Clarus MarketMetrics® 2/2 04/29/2013 Information not guaranteed. © 2013 - 2014 Terradatum and its suppliers and licensors (www.terradatum.com/about/licensors.td).