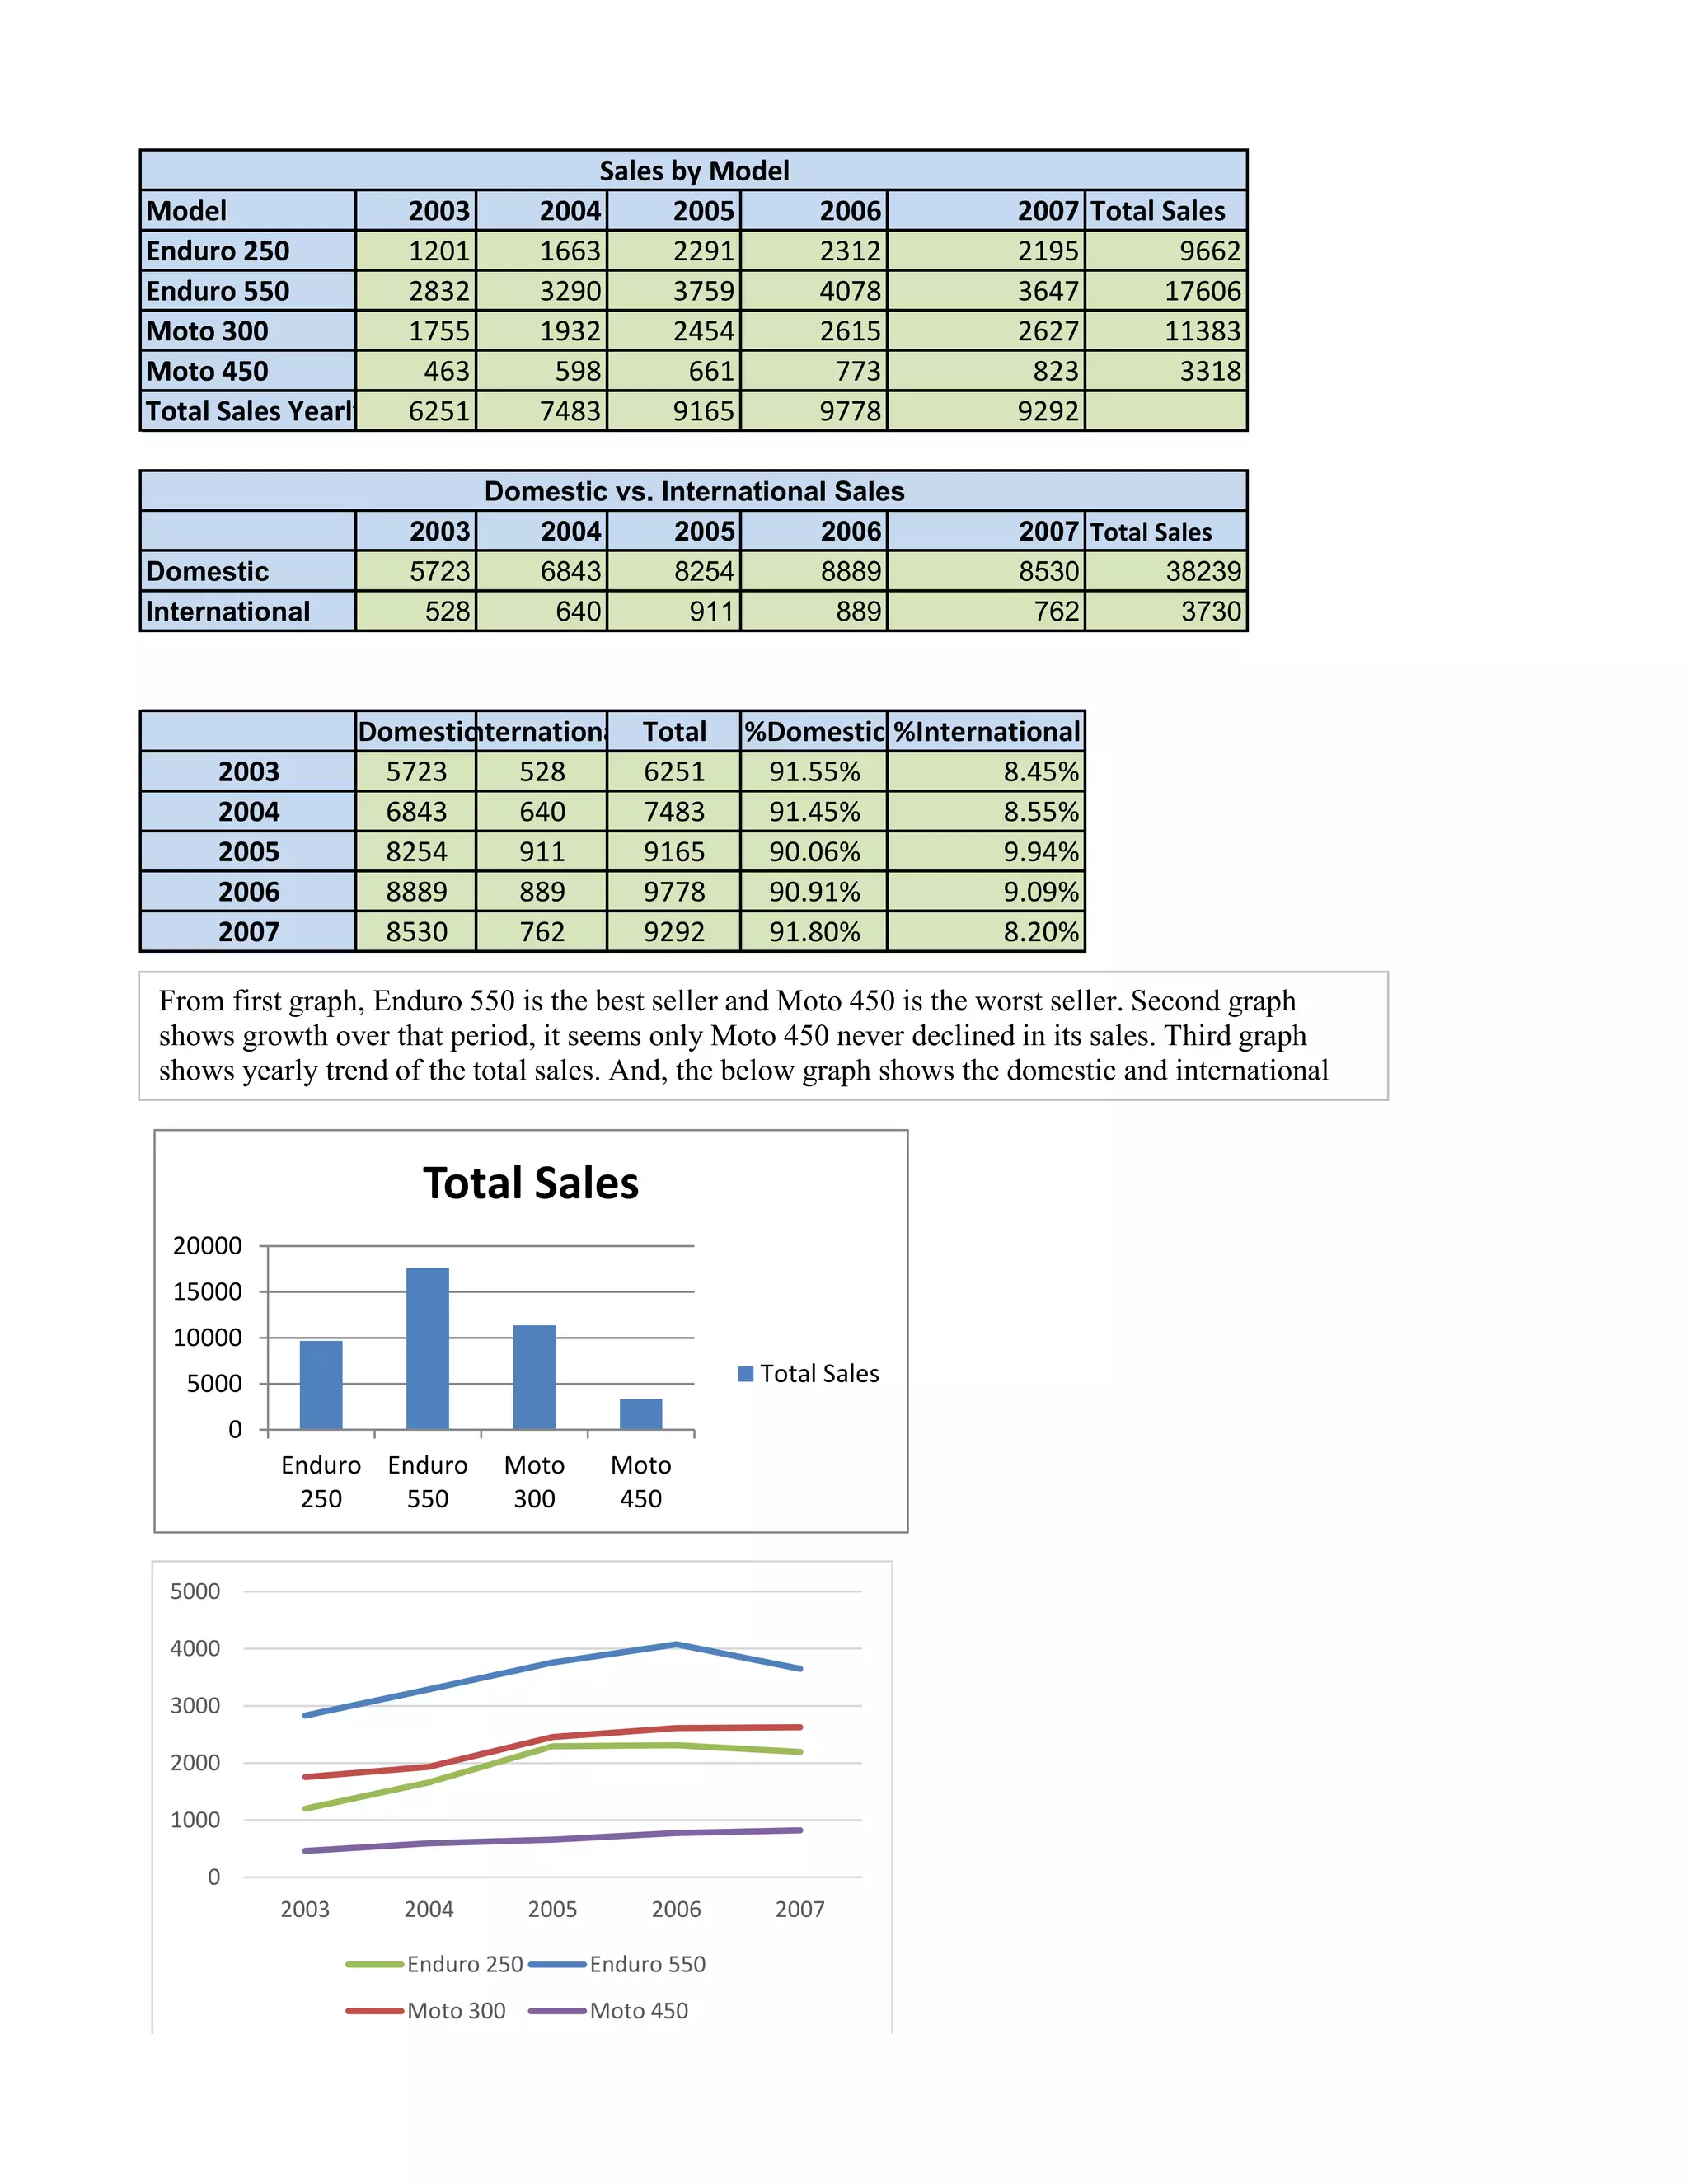
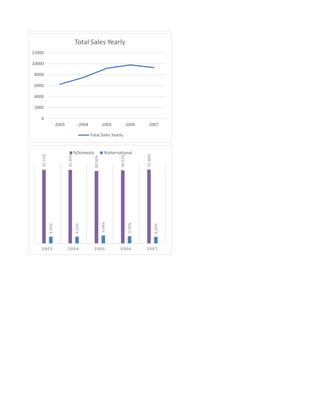
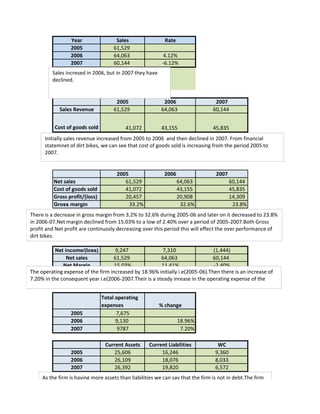
Model 2003 2004 2005 2006 2007 Total Sales
Enduro 250 1201 1663 2291 2312 2195 9662
Enduro 550 2832 3290 3759 4078 3647 17606
Moto 300 1755 1932 2454 2615 2627 11383
Moto 450 463 598 661 773 823 3318
Total Sales Yearly 6251 7483 9165 9778 9292
2003 2004 2005 2006 2007 Total Sales
Domestic 5723 6843 8254 8889 8530 38239
International 528 640 911 889 762 3730
DomesticInternational Total %Domestic %International
2003 5723 528 6251 91.55% 8.45%
2004 6843 640 7483 91.45% 8.55%
2005 8254 911 9165 90.06% 9.94%
2006 8889 889 9778 90.91% 9.09%
2007 8530 762 9292 91.80% 8.20%
Sales by Model
Domestic vs. International Sales
0
5000
10000
15000
20000
Enduro
250
Enduro
550
Moto
300
Moto
450
Total Sales
Total Sales
0
1000
2000
3000
4000
5000
2003 2004 2005 2006 2007
Enduro 250 Enduro 550
Moto 300 Moto 450
From first graph, Enduro 550 is the best seller and Moto 450 is the worst seller. Second graph
shows growth over that period, it seems only Moto 450 never declined in its sales. Third graph
shows yearly trend of the total sales. And, the below graph shows the domestic and international
Moto 300 Moto 450
91.55%
91.45%
90.06%
90.91%
91.80%
8.45%
8.55%
9.94%
9.09%
8.20%
2003 2004 2005 2006 2007
%Domestic %International
0
2000
4000
6000
8000
10000
12000
2003 2004 2005 2006 2007
Total Sales Yearly
Total Sales Yearly
Year Sales Rate
2005 61,529
2006 64,063 4.12%
2007 60,144 -6.12%
2005 2006 2007
Sales Revenue 61,529 64,063 60,144
Cost of goods sold 41,072 43,155 45,835
2005 2006 2007
Net sales 61,529 64,063 60,144
Cost of goods sold 41,072 43,155 45,835
Gross profit/(loss) 20,457 20,908 14,309
Gross margin 33.2% 32.6% 23.8%
Net income/(loss) 9,247 7,310 (1,444)
Net sales 61,529 64,063 60,144
Net Margin 15.03% 11.41% -2.40%
Total operating
expenses % change
2005 7,675
2006 9,130 18.96%
2007 9787 7.20%
Current Assets Current Liabilities WC
2005 25,606 16,246 9,360
2006 26,109 18,076 8,033
2007 26,392 19,820 6,572
Sales incresed in 2006, but in 2007 they have
declined.
Initially sales revenue increased from 2005 to 2006 and then declined in 2007. From financial
statemnet of dirt bikes, we can see that cost of goods sold is increasing from the period 2005 to
2007.
There is a decrease in gross margin from 3.2% to 32.6% during 2005-06 and later on it decreased to 23.8%
in 2006-07.Net margin declined from 15.03% to a low of 2.40% over a period of 2005-2007.Both Gross
profit and Net profit are continuosly decreasing over this period this will effect the over performance of
dirt bikes.
The operating expense of the firm increased by 18.96% initially i.e(2005-06).Then there is an increase of
7.20% in the consequent year i.e(2006-2007.Their is a steady inrease in the operating expense of the
As the firm is having more assets than liabilities we can say that the firm is not in debt.The firm
is able to manage the working capital requirements to invest in development of new products
As the firm is having more assets than liabilities we can say that the firm is not in debt.The firm
is able to manage the working capital requirements to invest in development of new products
and also to adopt new information system .

Chapter 2 Runing Case Assignment: Analyzing Financial Performance

  • 1.
    Model 2003 20042005 2006 2007 Total Sales Enduro 250 1201 1663 2291 2312 2195 9662 Enduro 550 2832 3290 3759 4078 3647 17606 Moto 300 1755 1932 2454 2615 2627 11383 Moto 450 463 598 661 773 823 3318 Total Sales Yearly 6251 7483 9165 9778 9292 2003 2004 2005 2006 2007 Total Sales Domestic 5723 6843 8254 8889 8530 38239 International 528 640 911 889 762 3730 DomesticInternational Total %Domestic %International 2003 5723 528 6251 91.55% 8.45% 2004 6843 640 7483 91.45% 8.55% 2005 8254 911 9165 90.06% 9.94% 2006 8889 889 9778 90.91% 9.09% 2007 8530 762 9292 91.80% 8.20% Sales by Model Domestic vs. International Sales 0 5000 10000 15000 20000 Enduro 250 Enduro 550 Moto 300 Moto 450 Total Sales Total Sales 0 1000 2000 3000 4000 5000 2003 2004 2005 2006 2007 Enduro 250 Enduro 550 Moto 300 Moto 450 From first graph, Enduro 550 is the best seller and Moto 450 is the worst seller. Second graph shows growth over that period, it seems only Moto 450 never declined in its sales. Third graph shows yearly trend of the total sales. And, the below graph shows the domestic and international
  • 2.
    Moto 300 Moto450 91.55% 91.45% 90.06% 90.91% 91.80% 8.45% 8.55% 9.94% 9.09% 8.20% 2003 2004 2005 2006 2007 %Domestic %International 0 2000 4000 6000 8000 10000 12000 2003 2004 2005 2006 2007 Total Sales Yearly Total Sales Yearly
  • 3.
    Year Sales Rate 200561,529 2006 64,063 4.12% 2007 60,144 -6.12% 2005 2006 2007 Sales Revenue 61,529 64,063 60,144 Cost of goods sold 41,072 43,155 45,835 2005 2006 2007 Net sales 61,529 64,063 60,144 Cost of goods sold 41,072 43,155 45,835 Gross profit/(loss) 20,457 20,908 14,309 Gross margin 33.2% 32.6% 23.8% Net income/(loss) 9,247 7,310 (1,444) Net sales 61,529 64,063 60,144 Net Margin 15.03% 11.41% -2.40% Total operating expenses % change 2005 7,675 2006 9,130 18.96% 2007 9787 7.20% Current Assets Current Liabilities WC 2005 25,606 16,246 9,360 2006 26,109 18,076 8,033 2007 26,392 19,820 6,572 Sales incresed in 2006, but in 2007 they have declined. Initially sales revenue increased from 2005 to 2006 and then declined in 2007. From financial statemnet of dirt bikes, we can see that cost of goods sold is increasing from the period 2005 to 2007. There is a decrease in gross margin from 3.2% to 32.6% during 2005-06 and later on it decreased to 23.8% in 2006-07.Net margin declined from 15.03% to a low of 2.40% over a period of 2005-2007.Both Gross profit and Net profit are continuosly decreasing over this period this will effect the over performance of dirt bikes. The operating expense of the firm increased by 18.96% initially i.e(2005-06).Then there is an increase of 7.20% in the consequent year i.e(2006-2007.Their is a steady inrease in the operating expense of the As the firm is having more assets than liabilities we can say that the firm is not in debt.The firm is able to manage the working capital requirements to invest in development of new products
  • 4.
    As the firmis having more assets than liabilities we can say that the firm is not in debt.The firm is able to manage the working capital requirements to invest in development of new products and also to adopt new information system .