SlideShare a Scribd company logo
1 of 17
/
1. 60% of transactions have been contributed by 4 areas M, HS, RA, W.
2. Commercial Properties are sold more while residential properties paid
more taxes and condo fee. For Areas FP,NW and SH , it took higher
number of days for sale closure.
3. Downtown is cheaper compared to Suburbs! Areas E and K are most
expensive while AH, AG and FP are closer to Median
4. Price has a weak linear relation with size of rooms, bath, bed but
depends primarily on location!
5. Price oscillates between peaks and valleys within a narrow band. But
there was a bubble in Nov 1990 which got burst in Apr 1991
.
/
Area with the maximum transactions get lesser price than the first quoted price.
75% of the transactions are coming from top 6 locations.
Residential
HS has 26% transactions in total, on an average properties were sold on lesser price than quoted. E is the most
favourable area for property sold on higher price than quoted. Other areas are selling at par to their first quoted price.
Commercial
M has the highest transactions ~27%. On an average in areas M,RA,W,CP properties were sold on lesser price than
quoted. E is the most favorable area for property sold on higher price than quoted. Remaining areas are sold almost at
par to their first quoted price, contributing to only ~10% transactions.
Click on the arrow to see Which area is favorable for family and Office
Area Price per Sq feet Gain/loss No of trans
M 20,620.10 -3111029
HS 18,432.88 -1819918
RA 7,198.46 -788900
W 6,007.91 -1598600
AH 7,134.85 -50917
E 8,777.38 1246650
CP 2,712.41 -762800
K 4,091.07 -448237
N 2,239.27 -1311000
Sale Price and Gain/loss by Area
100%
M
HS E
RA
W
AH
18M
16M
9M
7M
6M
5M
Res/Comm: Multipl…
C
R
PS 2,083.54 -309000
RS 2,369.44 -410600
AG 1,720.28 -78000
455
SH 754.71 -500900
NW 683.84 -185900
/
K
CP
N
RS
AG
PS
NW1M C1M
SH1M
FP0M
1.6%
4M
3M
2M
2M
2M
2M
No of transactions C 462.35 -208000
FP 326.49 24100
No of transactions and % by Area
No of transactions %
Area PS RS
0
50
100
M HS RA W AH
24
68
53
44
61
E CP K N
87
84
75
84
94
94
/
20,620.10 326.49
/
Price per Sq feet max per Area Price per Sq feet min per Area
Avg Price/sqft, No of transactions and No of transactions by Area
Gain/loss -0.69M
1.0M
0.5M
0.0M
-0.5M
/
-1.0M
Every year taxation is increasing, you can see bubbles rising every year. Median of Average Price per Sq.ft. is less than it's Mean value. Res/Com… Year Every alternate year
after 1991, number of transactions forms valleys. Indicating Average Price per square feet is concentrated to C Select all Due to higher taxation in the year 1993, number property
transactions few areas with highest rates.
decreased drastically in 1994.
Meaning, sales is totally dependent on type of area. R 1990
Nevertheless, there is still one more charge 'Condo fee'. Whether it is a City or Suburbs or Downtown with little effect 1991
To see Condo fee effects on sales click on the arrow. of taxation on Time or year to buy. 1992
1993
/
1994
188 164
Average of Price per Sq … Median of Price per Sq f…
/
/
155
Median of Condo
…
1
Median of # of
Bath
2
Median of # of
Bed
5
Median of # of Ro…
37.9K
/
500
/
0 1.5K
0K 5K 10K 15K 20K 25K 30K 35K
Condo Fee
Average of # of Rooms and No of transactions by Area
Average of # of Bath and No of transactions by Area
Average of # of Bed and No of transactions by Area
Area
/
/
/
Area
/
AG
AH C
CP
E FP
HS
K M
N
NW
PS
RA
RS
SH
W
RC
C R
/
Sale Price average per Area and Pareto by Area
15M
Area
Area Sale Price average per Area sales grand total rank2 Running total2 Pareto
M 17552500 7,79,05,878.00 1 1,75,52,500.00 22.53
HS 15514082 7,79,05,878.00 2 3,30,66,582.00 42.44
E 9459750 7,79,05,878.00 3 4,25,26,332.00 54.59
RA 6575400 7,79,05,878.00 4 4,91,01,732.00 63.03
W 6134200 7,79,05,878.00 5 5,52,35,932.00 70.90
AH 5448083 7,79,05,878.00 6 6,06,84,015.00 77.89
K 4239063 7,79,05,878.00 7 6,49,23,078.00 83.34
CP 2640500 7,79,05,878.00 8 6,75,63,578.00 86.72
N 2368900 7,79,05,878.00 9 6,99,32,478.00 89.77
RS 2124400 7,79,05,878.00 10 7,20,56,878.00 92.49
AG 1871500 7,79,05,878.00 11 7,39,28,378.00 94.89
PS 1871000 7,79,05,878.00 12 7,57,99,378.00 97.30
NW 804000 7,79,05,878.00 13 7,66,03,378.00 98.33
C 510000 7,79,05,878.00 14 7,71,13,378.00 98.98
SH 503500 7,79,05,878.00 15 7,76,16,878.00 99.63
FP 289000 7,79,05,878.00 16 7,79,05,878.00 100.00
7,79,05,878.00 17 7,79,05,878.00 100.00
/
).
% of total sales is contributed solely by Top 3 Areas (as per sales price
50
M, HS, E, contributing total 425 K.
Median Sales Price is which indicates, 50% of properties are priced less than
and other 50% are charged more than specified value.
Median of Total Sales is less than Mean Sales price, confirming, heavy weight areas with
more number of properties with higher price are concentrated to 4 to 6 Areas only.
If you want to see area wise analysis, select one or multiple areas, to see its full analysis
here. Or Select it in the table above.
All
Average of Sale Price
For more answers or additional
Try one of these to get started
top bbrs by gain/loss
top rc by sales grand total
what is the avg price/sqft by bbr
Ask a question about your data
Cover Page

More Related Content

Similar to Analysis of Property Sale Trends by Location and Key Factors

Indian Spectrum Auctions : Design Issues & Way Forward
Indian Spectrum Auctions : Design Issues & Way ForwardIndian Spectrum Auctions : Design Issues & Way Forward
Indian Spectrum Auctions : Design Issues & Way ForwardParag Kar
 
2017 Q1 San Francisco Condo Report By SHERRY JUNEJA
2017 Q1 San Francisco Condo Report By SHERRY JUNEJA2017 Q1 San Francisco Condo Report By SHERRY JUNEJA
2017 Q1 San Francisco Condo Report By SHERRY JUNEJASherry Juneja
 
Stevenson Ranch real estate market summary two year history November 2014
Stevenson Ranch real estate market summary two year history November 2014Stevenson Ranch real estate market summary two year history November 2014
Stevenson Ranch real estate market summary two year history November 2014Connor T. MacIVOR
 
January 2023 Okanagan Statistics with charts and graphs
January 2023 Okanagan Statistics with charts and graphsJanuary 2023 Okanagan Statistics with charts and graphs
January 2023 Okanagan Statistics with charts and graphsVickyAulakh1
 
Okanagan Monthly Statistics - December 2022
Okanagan Monthly Statistics - December 2022Okanagan Monthly Statistics - December 2022
Okanagan Monthly Statistics - December 2022VickyAulakh1
 
YorBox UK model
YorBox UK modelYorBox UK model
YorBox UK modelYorBox
 
Central Okanagan Statistics November 2021
Central Okanagan Statistics November 2021 Central Okanagan Statistics November 2021
Central Okanagan Statistics November 2021 VickyAulakh1
 
Sherwood Forest Subdivision Baton Rouge Home Sales Q3 2011 vs Q3 2014
Sherwood Forest Subdivision Baton Rouge Home Sales Q3 2011 vs Q3 2014Sherwood Forest Subdivision Baton Rouge Home Sales Q3 2011 vs Q3 2014
Sherwood Forest Subdivision Baton Rouge Home Sales Q3 2011 vs Q3 2014Bill Cobb, Appraiser
 
Paragon plantation Capital Brokers
Paragon plantation   Capital BrokersParagon plantation   Capital Brokers
Paragon plantation Capital BrokersCapitalBrokers
 
Weekly market update week ending 2017 february 12
Weekly market update week ending 2017 february 12Weekly market update week ending 2017 february 12
Weekly market update week ending 2017 february 12Gigi Noble
 
Okanagan Stats June 2022
Okanagan Stats June 2022Okanagan Stats June 2022
Okanagan Stats June 2022Vicky Aulakh
 

Similar to Analysis of Property Sale Trends by Location and Key Factors (11)

Indian Spectrum Auctions : Design Issues & Way Forward
Indian Spectrum Auctions : Design Issues & Way ForwardIndian Spectrum Auctions : Design Issues & Way Forward
Indian Spectrum Auctions : Design Issues & Way Forward
 
2017 Q1 San Francisco Condo Report By SHERRY JUNEJA
2017 Q1 San Francisco Condo Report By SHERRY JUNEJA2017 Q1 San Francisco Condo Report By SHERRY JUNEJA
2017 Q1 San Francisco Condo Report By SHERRY JUNEJA
 
Stevenson Ranch real estate market summary two year history November 2014
Stevenson Ranch real estate market summary two year history November 2014Stevenson Ranch real estate market summary two year history November 2014
Stevenson Ranch real estate market summary two year history November 2014
 
January 2023 Okanagan Statistics with charts and graphs
January 2023 Okanagan Statistics with charts and graphsJanuary 2023 Okanagan Statistics with charts and graphs
January 2023 Okanagan Statistics with charts and graphs
 
Okanagan Monthly Statistics - December 2022
Okanagan Monthly Statistics - December 2022Okanagan Monthly Statistics - December 2022
Okanagan Monthly Statistics - December 2022
 
YorBox UK model
YorBox UK modelYorBox UK model
YorBox UK model
 
Central Okanagan Statistics November 2021
Central Okanagan Statistics November 2021 Central Okanagan Statistics November 2021
Central Okanagan Statistics November 2021
 
Sherwood Forest Subdivision Baton Rouge Home Sales Q3 2011 vs Q3 2014
Sherwood Forest Subdivision Baton Rouge Home Sales Q3 2011 vs Q3 2014Sherwood Forest Subdivision Baton Rouge Home Sales Q3 2011 vs Q3 2014
Sherwood Forest Subdivision Baton Rouge Home Sales Q3 2011 vs Q3 2014
 
Paragon plantation Capital Brokers
Paragon plantation   Capital BrokersParagon plantation   Capital Brokers
Paragon plantation Capital Brokers
 
Weekly market update week ending 2017 february 12
Weekly market update week ending 2017 february 12Weekly market update week ending 2017 february 12
Weekly market update week ending 2017 february 12
 
Okanagan Stats June 2022
Okanagan Stats June 2022Okanagan Stats June 2022
Okanagan Stats June 2022
 

More from Shruti Nigam (CWM, AFP) (11)

Morph transition 1.pptx
Morph transition 1.pptxMorph transition 1.pptx
Morph transition 1.pptx
 
Morph transition 2.pptx
Morph transition 2.pptxMorph transition 2.pptx
Morph transition 2.pptx
 
Statistics.pdf
Statistics.pdfStatistics.pdf
Statistics.pdf
 
Business forecasting project border
Business forecasting project borderBusiness forecasting project border
Business forecasting project border
 
Actionable results to enhance Employee satisfaction score analysis via Tableau
Actionable results to enhance Employee satisfaction score analysis via TableauActionable results to enhance Employee satisfaction score analysis via Tableau
Actionable results to enhance Employee satisfaction score analysis via Tableau
 
Data visualization intro2
Data visualization intro2Data visualization intro2
Data visualization intro2
 
Data visualization intro
Data visualization introData visualization intro
Data visualization intro
 
Finanacial institutions nature and role
Finanacial institutions nature and roleFinanacial institutions nature and role
Finanacial institutions nature and role
 
Mutual funds
Mutual fundsMutual funds
Mutual funds
 
Fs unit-i nbfc
Fs unit-i nbfcFs unit-i nbfc
Fs unit-i nbfc
 
NBFC MBA I SEMESTER
NBFC MBA I SEMESTERNBFC MBA I SEMESTER
NBFC MBA I SEMESTER
 

Recently uploaded

dokumen.tips_chapter-4-transient-heat-conduction-mehmet-kanoglu.ppt
dokumen.tips_chapter-4-transient-heat-conduction-mehmet-kanoglu.pptdokumen.tips_chapter-4-transient-heat-conduction-mehmet-kanoglu.ppt
dokumen.tips_chapter-4-transient-heat-conduction-mehmet-kanoglu.pptSonatrach
 
Call Us ➥97111√47426🤳Call Girls in Aerocity (Delhi NCR)
Call Us ➥97111√47426🤳Call Girls in Aerocity (Delhi NCR)Call Us ➥97111√47426🤳Call Girls in Aerocity (Delhi NCR)
Call Us ➥97111√47426🤳Call Girls in Aerocity (Delhi NCR)jennyeacort
 
Beautiful Sapna Vip Call Girls Hauz Khas 9711199012 Call /Whatsapps
Beautiful Sapna Vip  Call Girls Hauz Khas 9711199012 Call /WhatsappsBeautiful Sapna Vip  Call Girls Hauz Khas 9711199012 Call /Whatsapps
Beautiful Sapna Vip Call Girls Hauz Khas 9711199012 Call /Whatsappssapnasaifi408
 
代办国外大学文凭《原版美国UCLA文凭证书》加州大学洛杉矶分校毕业证制作成绩单修改
代办国外大学文凭《原版美国UCLA文凭证书》加州大学洛杉矶分校毕业证制作成绩单修改代办国外大学文凭《原版美国UCLA文凭证书》加州大学洛杉矶分校毕业证制作成绩单修改
代办国外大学文凭《原版美国UCLA文凭证书》加州大学洛杉矶分校毕业证制作成绩单修改atducpo
 
Customer Service Analytics - Make Sense of All Your Data.pptx
Customer Service Analytics - Make Sense of All Your Data.pptxCustomer Service Analytics - Make Sense of All Your Data.pptx
Customer Service Analytics - Make Sense of All Your Data.pptxEmmanuel Dauda
 
Call Girls In Dwarka 9654467111 Escorts Service
Call Girls In Dwarka 9654467111 Escorts ServiceCall Girls In Dwarka 9654467111 Escorts Service
Call Girls In Dwarka 9654467111 Escorts ServiceSapana Sha
 
GA4 Without Cookies [Measure Camp AMS]
GA4 Without Cookies [Measure Camp AMS]GA4 Without Cookies [Measure Camp AMS]
GA4 Without Cookies [Measure Camp AMS]📊 Markus Baersch
 
Industrialised data - the key to AI success.pdf
Industrialised data - the key to AI success.pdfIndustrialised data - the key to AI success.pdf
Industrialised data - the key to AI success.pdfLars Albertsson
 
꧁❤ Greater Noida Call Girls Delhi ❤꧂ 9711199171 ☎️ Hard And Sexy Vip Call
꧁❤ Greater Noida Call Girls Delhi ❤꧂ 9711199171 ☎️ Hard And Sexy Vip Call꧁❤ Greater Noida Call Girls Delhi ❤꧂ 9711199171 ☎️ Hard And Sexy Vip Call
꧁❤ Greater Noida Call Girls Delhi ❤꧂ 9711199171 ☎️ Hard And Sexy Vip Callshivangimorya083
 
Kantar AI Summit- Under Embargo till Wednesday, 24th April 2024, 4 PM, IST.pdf
Kantar AI Summit- Under Embargo till Wednesday, 24th April 2024, 4 PM, IST.pdfKantar AI Summit- Under Embargo till Wednesday, 24th April 2024, 4 PM, IST.pdf
Kantar AI Summit- Under Embargo till Wednesday, 24th April 2024, 4 PM, IST.pdfSocial Samosa
 
From idea to production in a day – Leveraging Azure ML and Streamlit to build...
From idea to production in a day – Leveraging Azure ML and Streamlit to build...From idea to production in a day – Leveraging Azure ML and Streamlit to build...
From idea to production in a day – Leveraging Azure ML and Streamlit to build...Florian Roscheck
 
Data Science Jobs and Salaries Analysis.pptx
Data Science Jobs and Salaries Analysis.pptxData Science Jobs and Salaries Analysis.pptx
Data Science Jobs and Salaries Analysis.pptxFurkanTasci3
 
Call Girls In Mahipalpur O9654467111 Escorts Service
Call Girls In Mahipalpur O9654467111  Escorts ServiceCall Girls In Mahipalpur O9654467111  Escorts Service
Call Girls In Mahipalpur O9654467111 Escorts ServiceSapana Sha
 
Schema on read is obsolete. Welcome metaprogramming..pdf
Schema on read is obsolete. Welcome metaprogramming..pdfSchema on read is obsolete. Welcome metaprogramming..pdf
Schema on read is obsolete. Welcome metaprogramming..pdfLars Albertsson
 
High Class Call Girls Noida Sector 39 Aarushi 🔝8264348440🔝 Independent Escort...
High Class Call Girls Noida Sector 39 Aarushi 🔝8264348440🔝 Independent Escort...High Class Call Girls Noida Sector 39 Aarushi 🔝8264348440🔝 Independent Escort...
High Class Call Girls Noida Sector 39 Aarushi 🔝8264348440🔝 Independent Escort...soniya singh
 
INTERNSHIP ON PURBASHA COMPOSITE TEX LTD
INTERNSHIP ON PURBASHA COMPOSITE TEX LTDINTERNSHIP ON PURBASHA COMPOSITE TEX LTD
INTERNSHIP ON PURBASHA COMPOSITE TEX LTDRafezzaman
 
(PARI) Call Girls Wanowrie ( 7001035870 ) HI-Fi Pune Escorts Service
(PARI) Call Girls Wanowrie ( 7001035870 ) HI-Fi Pune Escorts Service(PARI) Call Girls Wanowrie ( 7001035870 ) HI-Fi Pune Escorts Service
(PARI) Call Girls Wanowrie ( 7001035870 ) HI-Fi Pune Escorts Serviceranjana rawat
 
RadioAdProWritingCinderellabyButleri.pdf
RadioAdProWritingCinderellabyButleri.pdfRadioAdProWritingCinderellabyButleri.pdf
RadioAdProWritingCinderellabyButleri.pdfgstagge
 

Recently uploaded (20)

꧁❤ Aerocity Call Girls Service Aerocity Delhi ❤꧂ 9999965857 ☎️ Hard And Sexy ...
꧁❤ Aerocity Call Girls Service Aerocity Delhi ❤꧂ 9999965857 ☎️ Hard And Sexy ...꧁❤ Aerocity Call Girls Service Aerocity Delhi ❤꧂ 9999965857 ☎️ Hard And Sexy ...
꧁❤ Aerocity Call Girls Service Aerocity Delhi ❤꧂ 9999965857 ☎️ Hard And Sexy ...
 
dokumen.tips_chapter-4-transient-heat-conduction-mehmet-kanoglu.ppt
dokumen.tips_chapter-4-transient-heat-conduction-mehmet-kanoglu.pptdokumen.tips_chapter-4-transient-heat-conduction-mehmet-kanoglu.ppt
dokumen.tips_chapter-4-transient-heat-conduction-mehmet-kanoglu.ppt
 
Call Us ➥97111√47426🤳Call Girls in Aerocity (Delhi NCR)
Call Us ➥97111√47426🤳Call Girls in Aerocity (Delhi NCR)Call Us ➥97111√47426🤳Call Girls in Aerocity (Delhi NCR)
Call Us ➥97111√47426🤳Call Girls in Aerocity (Delhi NCR)
 
Beautiful Sapna Vip Call Girls Hauz Khas 9711199012 Call /Whatsapps
Beautiful Sapna Vip  Call Girls Hauz Khas 9711199012 Call /WhatsappsBeautiful Sapna Vip  Call Girls Hauz Khas 9711199012 Call /Whatsapps
Beautiful Sapna Vip Call Girls Hauz Khas 9711199012 Call /Whatsapps
 
代办国外大学文凭《原版美国UCLA文凭证书》加州大学洛杉矶分校毕业证制作成绩单修改
代办国外大学文凭《原版美国UCLA文凭证书》加州大学洛杉矶分校毕业证制作成绩单修改代办国外大学文凭《原版美国UCLA文凭证书》加州大学洛杉矶分校毕业证制作成绩单修改
代办国外大学文凭《原版美国UCLA文凭证书》加州大学洛杉矶分校毕业证制作成绩单修改
 
Customer Service Analytics - Make Sense of All Your Data.pptx
Customer Service Analytics - Make Sense of All Your Data.pptxCustomer Service Analytics - Make Sense of All Your Data.pptx
Customer Service Analytics - Make Sense of All Your Data.pptx
 
Call Girls In Dwarka 9654467111 Escorts Service
Call Girls In Dwarka 9654467111 Escorts ServiceCall Girls In Dwarka 9654467111 Escorts Service
Call Girls In Dwarka 9654467111 Escorts Service
 
GA4 Without Cookies [Measure Camp AMS]
GA4 Without Cookies [Measure Camp AMS]GA4 Without Cookies [Measure Camp AMS]
GA4 Without Cookies [Measure Camp AMS]
 
Industrialised data - the key to AI success.pdf
Industrialised data - the key to AI success.pdfIndustrialised data - the key to AI success.pdf
Industrialised data - the key to AI success.pdf
 
꧁❤ Greater Noida Call Girls Delhi ❤꧂ 9711199171 ☎️ Hard And Sexy Vip Call
꧁❤ Greater Noida Call Girls Delhi ❤꧂ 9711199171 ☎️ Hard And Sexy Vip Call꧁❤ Greater Noida Call Girls Delhi ❤꧂ 9711199171 ☎️ Hard And Sexy Vip Call
꧁❤ Greater Noida Call Girls Delhi ❤꧂ 9711199171 ☎️ Hard And Sexy Vip Call
 
Kantar AI Summit- Under Embargo till Wednesday, 24th April 2024, 4 PM, IST.pdf
Kantar AI Summit- Under Embargo till Wednesday, 24th April 2024, 4 PM, IST.pdfKantar AI Summit- Under Embargo till Wednesday, 24th April 2024, 4 PM, IST.pdf
Kantar AI Summit- Under Embargo till Wednesday, 24th April 2024, 4 PM, IST.pdf
 
From idea to production in a day – Leveraging Azure ML and Streamlit to build...
From idea to production in a day – Leveraging Azure ML and Streamlit to build...From idea to production in a day – Leveraging Azure ML and Streamlit to build...
From idea to production in a day – Leveraging Azure ML and Streamlit to build...
 
Deep Generative Learning for All - The Gen AI Hype (Spring 2024)
Deep Generative Learning for All - The Gen AI Hype (Spring 2024)Deep Generative Learning for All - The Gen AI Hype (Spring 2024)
Deep Generative Learning for All - The Gen AI Hype (Spring 2024)
 
Data Science Jobs and Salaries Analysis.pptx
Data Science Jobs and Salaries Analysis.pptxData Science Jobs and Salaries Analysis.pptx
Data Science Jobs and Salaries Analysis.pptx
 
Call Girls In Mahipalpur O9654467111 Escorts Service
Call Girls In Mahipalpur O9654467111  Escorts ServiceCall Girls In Mahipalpur O9654467111  Escorts Service
Call Girls In Mahipalpur O9654467111 Escorts Service
 
Schema on read is obsolete. Welcome metaprogramming..pdf
Schema on read is obsolete. Welcome metaprogramming..pdfSchema on read is obsolete. Welcome metaprogramming..pdf
Schema on read is obsolete. Welcome metaprogramming..pdf
 
High Class Call Girls Noida Sector 39 Aarushi 🔝8264348440🔝 Independent Escort...
High Class Call Girls Noida Sector 39 Aarushi 🔝8264348440🔝 Independent Escort...High Class Call Girls Noida Sector 39 Aarushi 🔝8264348440🔝 Independent Escort...
High Class Call Girls Noida Sector 39 Aarushi 🔝8264348440🔝 Independent Escort...
 
INTERNSHIP ON PURBASHA COMPOSITE TEX LTD
INTERNSHIP ON PURBASHA COMPOSITE TEX LTDINTERNSHIP ON PURBASHA COMPOSITE TEX LTD
INTERNSHIP ON PURBASHA COMPOSITE TEX LTD
 
(PARI) Call Girls Wanowrie ( 7001035870 ) HI-Fi Pune Escorts Service
(PARI) Call Girls Wanowrie ( 7001035870 ) HI-Fi Pune Escorts Service(PARI) Call Girls Wanowrie ( 7001035870 ) HI-Fi Pune Escorts Service
(PARI) Call Girls Wanowrie ( 7001035870 ) HI-Fi Pune Escorts Service
 
RadioAdProWritingCinderellabyButleri.pdf
RadioAdProWritingCinderellabyButleri.pdfRadioAdProWritingCinderellabyButleri.pdf
RadioAdProWritingCinderellabyButleri.pdf
 

Analysis of Property Sale Trends by Location and Key Factors

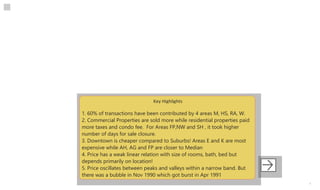
  • 1. / 1. 60% of transactions have been contributed by 4 areas M, HS, RA, W. 2. Commercial Properties are sold more while residential properties paid more taxes and condo fee. For Areas FP,NW and SH , it took higher number of days for sale closure. 3. Downtown is cheaper compared to Suburbs! Areas E and K are most expensive while AH, AG and FP are closer to Median 4. Price has a weak linear relation with size of rooms, bath, bed but depends primarily on location! 5. Price oscillates between peaks and valleys within a narrow band. But there was a bubble in Nov 1990 which got burst in Apr 1991 .
  • 2. / Area with the maximum transactions get lesser price than the first quoted price. 75% of the transactions are coming from top 6 locations. Residential HS has 26% transactions in total, on an average properties were sold on lesser price than quoted. E is the most favourable area for property sold on higher price than quoted. Other areas are selling at par to their first quoted price. Commercial M has the highest transactions ~27%. On an average in areas M,RA,W,CP properties were sold on lesser price than quoted. E is the most favorable area for property sold on higher price than quoted. Remaining areas are sold almost at par to their first quoted price, contributing to only ~10% transactions. Click on the arrow to see Which area is favorable for family and Office Area Price per Sq feet Gain/loss No of trans M 20,620.10 -3111029 HS 18,432.88 -1819918 RA 7,198.46 -788900 W 6,007.91 -1598600 AH 7,134.85 -50917 E 8,777.38 1246650 CP 2,712.41 -762800 K 4,091.07 -448237 N 2,239.27 -1311000 Sale Price and Gain/loss by Area 100% M HS E RA W AH 18M 16M 9M 7M 6M 5M Res/Comm: Multipl… C R PS 2,083.54 -309000 RS 2,369.44 -410600 AG 1,720.28 -78000 455 SH 754.71 -500900 NW 683.84 -185900
  • 3. / K CP N RS AG PS NW1M C1M SH1M FP0M 1.6% 4M 3M 2M 2M 2M 2M No of transactions C 462.35 -208000 FP 326.49 24100 No of transactions and % by Area No of transactions % Area PS RS 0 50 100 M HS RA W AH 24 68 53 44 61 E CP K N 87 84 75 84 94 94
  • 5. / Price per Sq feet max per Area Price per Sq feet min per Area Avg Price/sqft, No of transactions and No of transactions by Area Gain/loss -0.69M 1.0M 0.5M 0.0M -0.5M
  • 6. / -1.0M Every year taxation is increasing, you can see bubbles rising every year. Median of Average Price per Sq.ft. is less than it's Mean value. Res/Com… Year Every alternate year after 1991, number of transactions forms valleys. Indicating Average Price per square feet is concentrated to C Select all Due to higher taxation in the year 1993, number property transactions few areas with highest rates. decreased drastically in 1994. Meaning, sales is totally dependent on type of area. R 1990 Nevertheless, there is still one more charge 'Condo fee'. Whether it is a City or Suburbs or Downtown with little effect 1991 To see Condo fee effects on sales click on the arrow. of taxation on Time or year to buy. 1992 1993
  • 7. / 1994 188 164 Average of Price per Sq … Median of Price per Sq f…
  • 8. /
  • 9. / 155 Median of Condo … 1 Median of # of Bath 2 Median of # of Bed 5 Median of # of Ro… 37.9K
  • 10. / 500
  • 11. / 0 1.5K 0K 5K 10K 15K 20K 25K 30K 35K Condo Fee Average of # of Rooms and No of transactions by Area Average of # of Bath and No of transactions by Area Average of # of Bed and No of transactions by Area Area
  • 12. /
  • 13. /
  • 15. / AG AH C CP E FP HS K M N NW PS RA RS SH W RC C R
  • 16. / Sale Price average per Area and Pareto by Area 15M Area Area Sale Price average per Area sales grand total rank2 Running total2 Pareto M 17552500 7,79,05,878.00 1 1,75,52,500.00 22.53 HS 15514082 7,79,05,878.00 2 3,30,66,582.00 42.44 E 9459750 7,79,05,878.00 3 4,25,26,332.00 54.59 RA 6575400 7,79,05,878.00 4 4,91,01,732.00 63.03 W 6134200 7,79,05,878.00 5 5,52,35,932.00 70.90 AH 5448083 7,79,05,878.00 6 6,06,84,015.00 77.89 K 4239063 7,79,05,878.00 7 6,49,23,078.00 83.34 CP 2640500 7,79,05,878.00 8 6,75,63,578.00 86.72 N 2368900 7,79,05,878.00 9 6,99,32,478.00 89.77 RS 2124400 7,79,05,878.00 10 7,20,56,878.00 92.49 AG 1871500 7,79,05,878.00 11 7,39,28,378.00 94.89 PS 1871000 7,79,05,878.00 12 7,57,99,378.00 97.30 NW 804000 7,79,05,878.00 13 7,66,03,378.00 98.33 C 510000 7,79,05,878.00 14 7,71,13,378.00 98.98 SH 503500 7,79,05,878.00 15 7,76,16,878.00 99.63 FP 289000 7,79,05,878.00 16 7,79,05,878.00 100.00 7,79,05,878.00 17 7,79,05,878.00 100.00
  • 17. / ). % of total sales is contributed solely by Top 3 Areas (as per sales price 50 M, HS, E, contributing total 425 K. Median Sales Price is which indicates, 50% of properties are priced less than and other 50% are charged more than specified value. Median of Total Sales is less than Mean Sales price, confirming, heavy weight areas with more number of properties with higher price are concentrated to 4 to 6 Areas only. If you want to see area wise analysis, select one or multiple areas, to see its full analysis here. Or Select it in the table above. All Average of Sale Price For more answers or additional Try one of these to get started top bbrs by gain/loss top rc by sales grand total what is the avg price/sqft by bbr Ask a question about your data Cover Page