
Recommended
Recommended
More Related Content
Similar to you are given a data set of cost function data. The data is based .docx
Similar to you are given a data set of cost function data. The data is based .docx (20)
More from jeffevans62972
More from jeffevans62972 (20)
Recently uploaded
Recently uploaded (20)
you are given a data set of cost function data. The data is based .docx
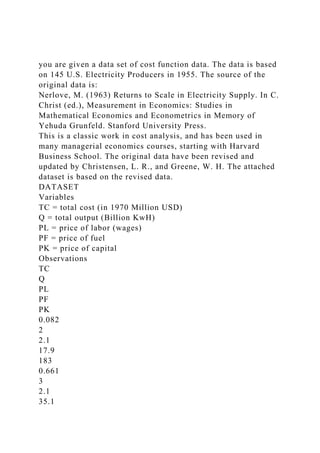
- 1. you are given a data set of cost function data. The data is based on 145 U.S. Electricity Producers in 1955. The source of the original data is: Nerlove, M. (1963) Returns to Scale in Electricity Supply. In C. Christ (ed.), Measurement in Economics: Studies in Mathematical Economics and Econometrics in Memory of Yehuda Grunfeld. Stanford University Press. This is a classic work in cost analysis, and has been used in many managerial economics courses, starting with Harvard Business School. The original data have been revised and updated by Christensen, L. R., and Greene, W. H. The attached dataset is based on the revised data. DATASET Variables TC = total cost (in 1970 Million USD) Q = total output (Billion KwH) PL = price of labor (wages) PF = price of fuel PK = price of capital Observations TC Q PL PF PK 0.082 2 2.1 17.9 183 0.661 3 2.1 35.1
- 21. 33.5 190 69.878 9484 2.1 24.4 165 44.894 9956 1.7 28.8 203 67.12 11477 2.2 26.5 151 73.05 11796 2.1 28.6 148 139.422 14359 2.3 33.5 212 119.939 16719 2.3 23.6 162 Cut the data set and paste it into Excel. Then, in Excel, obtain the logarithmic transformation of all the variables using the Excel function: =LOG( . ), i.e., logTC = log(total cost)
- 22. logQ = log(total output) logPL = log(price of labor) logPF = log(price of fuel) logPK = log(price of capital) Run the following regression using the Excel add-in Data Analysis: logTC= whereis an error term, and the variables and their logarithmic transformations are defined above. Read the Background material, run the multiple regression outlined above and then write a 3- to 4-page report (and attach the Excel printout) answering the following questions: · What is the R-square of the regression? What does it mean? · What is the elasticity of TC with respect to Q? Test the significance of · What is the elasticity of TC with respect to PL? Test the significance of · What is the elasticity of TC with respect to PF? Test the significance of · What is the elasticity of TC with respect to PK? Test the significance of · Can you forecast (predict) what happens to TC if PL doubles (keeping everything else constant)? · Looking at the ANOVA table, can you conclude the independent variables jointly affect the average housing price? See the ANOVA note in Module 2 SLP. · Do you find any anomaly in the results? That is, is there any result that does not make sense to you? · How would inclusion of modern generation mix (Coal, Nuclear, Natural Gas) change the specification of the demand for electricity? INFO620: Enterprise Database Systems – Labs Page | 1
- 23. Name: _________________________________________ Date: __________________ Week 4 – Lab #3: Chapter 8 Grade: 3% of Class Grade For lab assignments you must use an actual database – Database systems such as Oracle, MS SQL, DB2, or Access are all acceptable if they can handle the capability to handle these questions. Do the exercises in the actual database then copy and paste the results or an image of the results here in the respective question part. ER Diagrams and Schemas can be created with MS Visio templates. Refer to your Lab Manual located under Resources > Assignments folder. I. Page 281 Lab Exercise #8.28 all sections [1% point] II. Page 281 Lab Exercise #8.31 [1% point] III. Page 281 Lab Exercise #8.32 [1% point] American Public University System Kageorgis