Statistics Review (0.0)
•Download as DOCX, PDF•
0 likes•2,828 views

Review worksheet covering IB Biology content in Statistics (Topic 1 from the 2009 syllabus)

Recommended
More Related Content
Viewers also liked
Viewers also liked (20)
Similar to Statistics Review (0.0)
Similar to Statistics Review (0.0) (20)
More from Jacob Cedarbaum
More from Jacob Cedarbaum (18)
Recently uploaded
Recently uploaded (20)
Statistics Review (0.0)
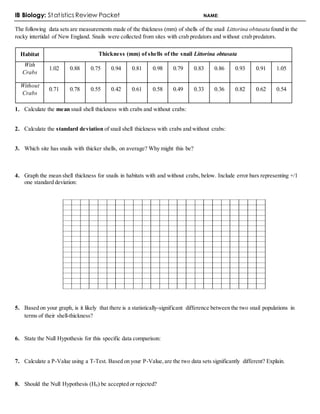
- 1. IB Biology: Statistics Review Packet NAME: The following data sets are measurements made of the thickness (mm) of shells of the snail Littorina obtusata found in the rocky intertidal of New England. Snails were collected from sites with crab predators and without crab predators. 1. Calculate the mean snail shell thickness with crabs and without crabs: 2. Calculate the standard deviation of snail shell thickness with crabs and without crabs: 3. Which site has snails with thicker shells, on average? Why might this be? 4. Graph the mean shell thickness for snails in habitats with and without crabs, below. Include error bars representing +/1 one standard deviation: 5. Based on your graph, is it likely that there is a statistically-significant difference between the two snail populations in terms of their shell-thickness? 6. State the Null Hypothesis for this specific data comparison: 7. Calculate a P-Value using a T-Test. Based on your P-Value,are the two data sets significantly different? Explain. 8. Should the Null Hypothesis (H0) be accepted or rejected? Habitat Thickness (mm) of shells of the snail Littorina obtusata With Crabs 1.02 0.88 0.75 0.94 0.81 0.98 0.79 0.83 0.86 0.93 0.91 1.05 Without Crabs 0.71 0.78 0.55 0.42 0.61 0.58 0.49 0.33 0.36 0.82 0.62 0.54
- 2. 9. On the same set of axes below, draw (A) a curve with a large mean, a large standard deviation, and a low frequency,and (B) a curve with a low mean, a low standard deviation, and a high frequency: 10. Draw a normal distribution curve below and label the mean, as well as the areas under the curve were 68% and 95% of the data points fall: 11. Complete the table below by filling in the missing graphs and correlation types: R2 = 0.023 R2 = -0.345 R2 = 0.899 R2 = -0.165 R2 = -0.933 12. What type of test indicates whether there is a relationship between two variables? 13. What type of correlation is shown in the scatterplot to the right? 14. Describe is the general trend/ relationship between the two variables in the scatterplot: 15. Evaluate the claim, based solely on this graph, that having a higher GPA leads students to watch fewer weekly hours of TV:
- 3. Answer the following questions based on the graph, right: 16. Which tree type shows the greatest variability in its data? How do you know? 17. The mean growth of which two types of tree might possibly be significantly different from one another? 18. Which tree type had the smallest standard deviation in its data set? How do you know? 19. Define the following terms: a. Mean: b. Standard Deviation: 20. A weight loss program is evaluating its effectiveness using statistical analysis of data from recent clients. The table to the right shows ‘before’ and ‘after’ weights of 15 program participants. Calculate the means and standard deviations for both data groups: BEFORE AFTER Mean Standard Deviation 21. Is this data Pooled/Paired or Unpooled/Unpaired? 22. Perform a T-Test and record your P-value below. Evaluate the effectiveness of this weight loss program in light of your calculated P-value: 23. Medical scientists have long known of a strong positive correlation between smoking and lung cancer. Is this relationship enough to prove that smoking causes lung cancer? If not, what would be sufficient proof? 24. How do you feel about your understanding of statistics? 1 2 3 4 5 6 7 8 9 10 AWFUL ALRIGHT AMAZING