SlideShare a Scribd company logo
1 of 18
Case Processing Summary 
N % 
Cases Valid 50 100.0 
Excluded( 
a) 
0 .0 
Total 50 100.0 
a Listwise deletion based on all variables in the procedure. 
Reliability Statistics 
Cronbach's 
Alpha N of Items 
.905 21 
The Cronbach Alpha value of our model is 0.905 which tells us that our questionnaire is reliable. 
Model Summary(b) 
Model R R Square 
Adjusted R 
Square 
Std. Error of 
the Estimate Durbin-Watson 
1 .843(a) .711 .685 .59797 2.271 
a Predictors: (Constant), AA4, AA2, AA1, AA3 Table 1 
b Dependent Variable: DV 
Table 1 is the model summary table providing us the summary of regression statistics the value of R2. This 
shows the magnitude of relationship between the independent and the dependent variables. The above 
value of R2 i.e. 0.711 shows that 71.1% variation in dependent variable can be ascribed to the set of 
independent variables. The value of R2 lies between 0-1. Higher values of R2 shows stronger impact of IVs 
on DV and vice versa. 
ANOVA(b) 
Model 
Sum of 
Squares Df Mean Square F Sig. 
1 Regression 39.589 4 9.897 27.679 .000(a) 
Residual 16.091 45 .358 
Total 55.680 49 
a Predictors: (Constant), AA4, AA2, AA1, AA3 Table 2 
b Dependent Variable: DV 
Table 2 the ANOVA table provides us with the F statistics. The significance value 0.000 tells us that we can 
apply regression on our model. If this value were to be more than 0.05 to it would have shown that 
regression could not be applied to our model
Coefficients(a) 
Model 
Unstandardized 
Coefficients 
Standardized 
Coefficients 
B Std. Error Beta T Sig. 
1 (Constant) .080 .568 .141 .888 
AA1 .504 .168 .347 3.000 .004 
AA2 -.301 .107 -.227 -2.818 .007 
AA3 .197 .173 .148 1.136 .262 
AA4 .529 .131 .456 4.051 .000 
a Dependent Variable: DV Table 3 
Table 3 is the coefficient table providing us the values for beta coefficients and t-statistics. The 
Beta coefficients of constant is .080 revealing the value of dependant variable keeping all the IVs 
are equal to 0 but the t-statistics for this value is .888(p > 0.05) which means that the constant 
value is insignificant. 
The quality of advertisements (AA1) has a positive relationship with effectiveness of ad 
campaigns (DV) as shown by the positive beta sign. The beta value shows the variation in 
effectiveness of ad campaigns (DV) caused by quality of advertisements (AA1). The beta value of 
quality advertisements is 0.504that tells us that a 1 degree change in quality of advertisements 
(AA1) will bring a 50.4% change in the effectiveness of ad campaigns (DV). The t value of this 
beta coefficient is 3.000 (p < 0.05) which means that the relationship between quality of 
advertisements and the effectiveness of ad campaigns is significant. 
The competitors (AA2) have an inverse relationship with effectiveness of ad campaigns (DV) as 
shown by the negative beta sign. The beta value of competitors is -0.301 that tells us that a 1 
degree change in quality of advertisements (AA1) will bring a 30.1% negative change in the 
effectiveness of ad campaigns (DV). The t value of this beta coefficient is -2.818 (p < 0.05) which 
means that the relationship between quality of advertisements and the effectiveness of ad 
campaigns is significant. This negative value represents that as the competition increases the 
effectiveness of ad campaigns diminishes.
The pricing and promotion (AA3) has a positive relationship with effectiveness of ad campaigns 
(DV) as shown by the positive beta sign. The beta value of pricing and promotion (AA3) is 0.197 
that tells us that a 1 degree change in quality of advertisements (AA1) will bring a 19.7% change 
in the effectiveness of ad campaigns (DV). The t value of this beta coefficient is 4.051 (p < 0.05) 
which means that the relationship between Research and the effectiveness of ad campaigns is 
significant. 
The Research (AA4) has a positive relationship with effectiveness of ad campaigns (DV) as shown 
by the positive beta sign. The beta value of Research (AA4) is 0.529 that tells us that a 1 degree 
change in quality of advertisements (AA1) will bring a 52.9% change in the effectiveness of ad 
campaigns (DV). The t value of this beta coefficient is 1.136 (p < 0.05) which means that the 
relationship between pricing and promotion and the effectiveness of ad campaigns is 
insignificant.
Correlations 
AA1 AA2 AA3 AA4 DV 
AA1 Pearson Correlation 1 
Sig. (1-tailed) 
AA2 Pearson Correlation .059 1 
Sig. (1-tailed) .342 
AA3 Pearson Correlation .710(**) .086 1 
Sig. (1-tailed) .000 .276 
AA4 Pearson Correlation .578(**) .112 .688(**) 1 
Sig. (1-tailed) .000 .218 .000 
DV Pearson Correlation .702(**) -.143 .688(**) .732(**) 1 
Sig. (1-tailed) .000 .161 .000 .000 
** Correlation is significant at the 0.01 level (1-tailed). 
 The relationship of Quality of Advertisement (AA1) and Competitors (AA2) is insignificant 
as shown by the significance value .342. 
 The relationship of Quality of Advertisement (AA1) and Pricing and Promotion (AA3) is 
significant as shown by the significance value 0.000. Hence a 1% change in Quality of 
Advertisement (AA1) will cause a 71% change in the variable Pricing and Promotion 
(AA3). 
 The relationship of Quality of Advertisement (AA1) and Research (AA4) is significant as 
shown by the significance value 0.000. Hence a 1% change in Quality of Advertisement 
(AA1) will cause a 57.8% change in the variable Research (AA4). 
 The relationship of Quality of Advertisement (AA1) and Effectiveness of Ad Campaigns 
(DV) is significant as shown by the significance value 0.000. Hence a 1% change in Quality 
of Advertisement (AA1) will cause a 70.2% change in the variable Effectiveness of Ad 
Campaigns (DV). 
 The relationship of Competitors (AA2) and Pricing and Promotion (AA3) is insignificant as 
is shown by the significance value .276. 
 The relationship of Competitors (AA2) and Research (AA4) is insignificant as is shown by 
the significance value .218. 
 The relationship of Competitors (AA2) and Effectiveness of Ad Campaigns (DV) is 
insignificant as is shown by the significance value .161.
 The relationship of Pricing and Promotion (AA3) and Research (AA4) is significant as 
shown by the significance value 0.000. Hence a 1% change in Pricing and Promotion 
(AA3) will cause a 68.8% change in the variable Research (AA4). 
 The relationship of Pricing and Promotion (AA3) and Effectiveness of Ad Campaigns (DV) 
is significant as shown by the significance value 0.000. Hence a 1% change in Pricing and 
Promotion (AA3) will cause a 68.8% change in the variable Effectiveness of Ad Campaigns 
(DV). 
 The relationship of Research (AA4) and Effectiveness of Ad Campaigns (DV) is significant 
as shown by the significance value 0.000. Hence a 1% change in Research (AA4) will cause 
a 73.2% change in the variable Effectiveness of Ad Campaigns (DV). 
Descriptive Statistics 
N Minimum Maximum Mean Std. Deviation 
AA1 50 1.00 4.75 3.3100 .73290 
AA2 50 2.25 5.00 3.9750 .80377 
AA3 50 1.00 4.75 3.2150 .79861 
AA4 50 1.00 4.50 3.2050 .91848 
DV 50 1.00 5.00 2.8800 1.06599 
Valid N (listwise) 50 
The descriptive stats reveal that the ad campaigns of Warid are ineffective. The mean value of 
the dependent variable is less than 3 which signify that majority of the people in the survey 
were in disagreement of the effectiveness of ad campaigns of Warid. If this value were to be 
more than 3 then it would have meant that the ad campaigns of Warid are effective.
Conclusion 
After analyzing all the results and findings I would like to conclude this chapter by saying that all 
the independent variables except for pricing and promotion impact the dependent variable. The 
hypothesis of pricing and promotion has been found to be null i.e. any change in pricing and 
promotion will have no effect on the effectiveness of ad campaigns. 
Also after analysis we also came to found out that competition has an inverse relationship with 
the dependent variable i.e. an increase in competition will lead to reduced effectiveness of ad 
campaigns and vice versa. The rest of the variables (quality of advertisement and research) have 
a direct relationship with the dependent variable i.e. and increase in any of these will increase the 
effectiveness of ad campaigns and vice versa.
Pie Charts of Items
A marketing study on Warid and its Ad performance

More Related Content

Similar to A marketing study on Warid and its Ad performance

Stat_AMBA_600_Problem Set3
Stat_AMBA_600_Problem Set3Stat_AMBA_600_Problem Set3
Stat_AMBA_600_Problem Set3Tyler Anton
 
Tutorial 8 Solutions.docx
Tutorial 8 Solutions.docxTutorial 8 Solutions.docx
Tutorial 8 Solutions.docxLinhLeThiThuy4
 
Pain Procedure Valuation as a Competitive Strategy
Pain Procedure Valuation as a Competitive StrategyPain Procedure Valuation as a Competitive Strategy
Pain Procedure Valuation as a Competitive StrategyJAMES B. MACON, M.D.
 
Journal ArticleSales and Dealership Size as a Pred.docx
Journal ArticleSales and Dealership Size as a Pred.docxJournal ArticleSales and Dealership Size as a Pred.docx
Journal ArticleSales and Dealership Size as a Pred.docxcroysierkathey
 
Project Week 71. Both graphs shows a.docx
Project Week 71. Both graphs shows a.docxProject Week 71. Both graphs shows a.docx
Project Week 71. Both graphs shows a.docxwkyra78
 
PREDICTION OF FUTURE RATINGS OF COMPANIES, THOSE ARE RATED BY BROKER FIRMS
PREDICTION OF FUTURE RATINGS OF COMPANIES, THOSE ARE RATED BY BROKER FIRMSPREDICTION OF FUTURE RATINGS OF COMPANIES, THOSE ARE RATED BY BROKER FIRMS
PREDICTION OF FUTURE RATINGS OF COMPANIES, THOSE ARE RATED BY BROKER FIRMSAlgoix Technologies LLP
 
Using the data below, I need answers to the following questionsa).pdf
Using the data below, I need answers to the following questionsa).pdfUsing the data below, I need answers to the following questionsa).pdf
Using the data below, I need answers to the following questionsa).pdfanandastores
 
What Is Generalized Linear Regression with Gaussian Distribution And How Can ...
What Is Generalized Linear Regression with Gaussian Distribution And How Can ...What Is Generalized Linear Regression with Gaussian Distribution And How Can ...
What Is Generalized Linear Regression with Gaussian Distribution And How Can ...Smarten Augmented Analytics
 
Marketing Engineering Notes
Marketing Engineering NotesMarketing Engineering Notes
Marketing Engineering NotesFelipe Affonso
 
Multiple Linear Regression.pptx
Multiple Linear Regression.pptxMultiple Linear Regression.pptx
Multiple Linear Regression.pptxBHUSHANKPATEL
 
What is Multiple Linear Regression and How Can it be Helpful for Business Ana...
What is Multiple Linear Regression and How Can it be Helpful for Business Ana...What is Multiple Linear Regression and How Can it be Helpful for Business Ana...
What is Multiple Linear Regression and How Can it be Helpful for Business Ana...Smarten Augmented Analytics
 
elasticityThe ratio of the percentagechange in a depende.docx
elasticityThe ratio of the percentagechange in a depende.docxelasticityThe ratio of the percentagechange in a depende.docx
elasticityThe ratio of the percentagechange in a depende.docxSALU18
 
Statistics for Data Analytics
Statistics for Data AnalyticsStatistics for Data Analytics
Statistics for Data AnalyticsTushar Dalvi
 
Correspondence analysis(step by step)
Correspondence analysis(step by step)Correspondence analysis(step by step)
Correspondence analysis(step by step)Nguyen Van Chuc
 

Similar to A marketing study on Warid and its Ad performance (20)

Stat_AMBA_600_Problem Set3
Stat_AMBA_600_Problem Set3Stat_AMBA_600_Problem Set3
Stat_AMBA_600_Problem Set3
 
Tutorial 8 Solutions.docx
Tutorial 8 Solutions.docxTutorial 8 Solutions.docx
Tutorial 8 Solutions.docx
 
Pain Procedure Valuation as a Competitive Strategy
Pain Procedure Valuation as a Competitive StrategyPain Procedure Valuation as a Competitive Strategy
Pain Procedure Valuation as a Competitive Strategy
 
Journal ArticleSales and Dealership Size as a Pred.docx
Journal ArticleSales and Dealership Size as a Pred.docxJournal ArticleSales and Dealership Size as a Pred.docx
Journal ArticleSales and Dealership Size as a Pred.docx
 
Project Week 71. Both graphs shows a.docx
Project Week 71. Both graphs shows a.docxProject Week 71. Both graphs shows a.docx
Project Week 71. Both graphs shows a.docx
 
PREDICTION OF FUTURE RATINGS OF COMPANIES, THOSE ARE RATED BY BROKER FIRMS
PREDICTION OF FUTURE RATINGS OF COMPANIES, THOSE ARE RATED BY BROKER FIRMSPREDICTION OF FUTURE RATINGS OF COMPANIES, THOSE ARE RATED BY BROKER FIRMS
PREDICTION OF FUTURE RATINGS OF COMPANIES, THOSE ARE RATED BY BROKER FIRMS
 
Using the data below, I need answers to the following questionsa).pdf
Using the data below, I need answers to the following questionsa).pdfUsing the data below, I need answers to the following questionsa).pdf
Using the data below, I need answers to the following questionsa).pdf
 
What Is Generalized Linear Regression with Gaussian Distribution And How Can ...
What Is Generalized Linear Regression with Gaussian Distribution And How Can ...What Is Generalized Linear Regression with Gaussian Distribution And How Can ...
What Is Generalized Linear Regression with Gaussian Distribution And How Can ...
 
Marketing Engineering Notes
Marketing Engineering NotesMarketing Engineering Notes
Marketing Engineering Notes
 
Multiple Linear Regression.pptx
Multiple Linear Regression.pptxMultiple Linear Regression.pptx
Multiple Linear Regression.pptx
 
What is Multiple Linear Regression and How Can it be Helpful for Business Ana...
What is Multiple Linear Regression and How Can it be Helpful for Business Ana...What is Multiple Linear Regression and How Can it be Helpful for Business Ana...
What is Multiple Linear Regression and How Can it be Helpful for Business Ana...
 
elasticityThe ratio of the percentagechange in a depende.docx
elasticityThe ratio of the percentagechange in a depende.docxelasticityThe ratio of the percentagechange in a depende.docx
elasticityThe ratio of the percentagechange in a depende.docx
 
Statistics for Data Analytics
Statistics for Data AnalyticsStatistics for Data Analytics
Statistics for Data Analytics
 
Notes part ii
Notes   part iiNotes   part ii
Notes part ii
 
Final report mkt
Final report mktFinal report mkt
Final report mkt
 
Assignment 1
Assignment 1Assignment 1
Assignment 1
 
Final.Version
Final.VersionFinal.Version
Final.Version
 
Demand Estimation
Demand EstimationDemand Estimation
Demand Estimation
 
Correspondence analysis(step by step)
Correspondence analysis(step by step)Correspondence analysis(step by step)
Correspondence analysis(step by step)
 
Multiple Regression
Multiple RegressionMultiple Regression
Multiple Regression
 

More from jaze223

Training Need Analysis
Training Need AnalysisTraining Need Analysis
Training Need Analysisjaze223
 
Norway Country Profile
Norway Country ProfileNorway Country Profile
Norway Country Profilejaze223
 
A study on the working practices at Apple inc---'Byte into Apple'
A study on the working practices at Apple inc---'Byte into Apple'A study on the working practices at Apple inc---'Byte into Apple'
A study on the working practices at Apple inc---'Byte into Apple'jaze223
 
Rebranding Naurus---- Organization based in Pakistan
Rebranding Naurus---- Organization based in PakistanRebranding Naurus---- Organization based in Pakistan
Rebranding Naurus---- Organization based in Pakistanjaze223
 
Sources Of Law
Sources Of LawSources Of Law
Sources Of Lawjaze223
 
Poverty In Pakistan
Poverty In PakistanPoverty In Pakistan
Poverty In Pakistanjaze223
 

More from jaze223 (6)

Training Need Analysis
Training Need AnalysisTraining Need Analysis
Training Need Analysis
 
Norway Country Profile
Norway Country ProfileNorway Country Profile
Norway Country Profile
 
A study on the working practices at Apple inc---'Byte into Apple'
A study on the working practices at Apple inc---'Byte into Apple'A study on the working practices at Apple inc---'Byte into Apple'
A study on the working practices at Apple inc---'Byte into Apple'
 
Rebranding Naurus---- Organization based in Pakistan
Rebranding Naurus---- Organization based in PakistanRebranding Naurus---- Organization based in Pakistan
Rebranding Naurus---- Organization based in Pakistan
 
Sources Of Law
Sources Of LawSources Of Law
Sources Of Law
 
Poverty In Pakistan
Poverty In PakistanPoverty In Pakistan
Poverty In Pakistan
 

Recently uploaded

भारत-रोम व्यापार.pptx, Indo-Roman Trade,
भारत-रोम व्यापार.pptx, Indo-Roman Trade,भारत-रोम व्यापार.pptx, Indo-Roman Trade,
भारत-रोम व्यापार.pptx, Indo-Roman Trade,Virag Sontakke
 
internship ppt on smartinternz platform as salesforce developer
internship ppt on smartinternz platform as salesforce developerinternship ppt on smartinternz platform as salesforce developer
internship ppt on smartinternz platform as salesforce developerunnathinaik
 
call girls in Kamla Market (DELHI) 🔝 >༒9953330565🔝 genuine Escort Service 🔝✔️✔️
call girls in Kamla Market (DELHI) 🔝 >༒9953330565🔝 genuine Escort Service 🔝✔️✔️call girls in Kamla Market (DELHI) 🔝 >༒9953330565🔝 genuine Escort Service 🔝✔️✔️
call girls in Kamla Market (DELHI) 🔝 >༒9953330565🔝 genuine Escort Service 🔝✔️✔️9953056974 Low Rate Call Girls In Saket, Delhi NCR
 
Pharmacognosy Flower 3. Compositae 2023.pdf
Pharmacognosy Flower 3. Compositae 2023.pdfPharmacognosy Flower 3. Compositae 2023.pdf
Pharmacognosy Flower 3. Compositae 2023.pdfMahmoud M. Sallam
 
Painted Grey Ware.pptx, PGW Culture of India
Painted Grey Ware.pptx, PGW Culture of IndiaPainted Grey Ware.pptx, PGW Culture of India
Painted Grey Ware.pptx, PGW Culture of IndiaVirag Sontakke
 
The Most Excellent Way | 1 Corinthians 13
The Most Excellent Way | 1 Corinthians 13The Most Excellent Way | 1 Corinthians 13
The Most Excellent Way | 1 Corinthians 13Steve Thomason
 
ENGLISH5 QUARTER4 MODULE1 WEEK1-3 How Visual and Multimedia Elements.pptx
ENGLISH5 QUARTER4 MODULE1 WEEK1-3 How Visual and Multimedia Elements.pptxENGLISH5 QUARTER4 MODULE1 WEEK1-3 How Visual and Multimedia Elements.pptx
ENGLISH5 QUARTER4 MODULE1 WEEK1-3 How Visual and Multimedia Elements.pptxAnaBeatriceAblay2
 
Crayon Activity Handout For the Crayon A
Crayon Activity Handout For the Crayon ACrayon Activity Handout For the Crayon A
Crayon Activity Handout For the Crayon AUnboundStockton
 
Organic Name Reactions for the students and aspirants of Chemistry12th.pptx
Organic Name Reactions  for the students and aspirants of Chemistry12th.pptxOrganic Name Reactions  for the students and aspirants of Chemistry12th.pptx
Organic Name Reactions for the students and aspirants of Chemistry12th.pptxVS Mahajan Coaching Centre
 
Introduction to AI in Higher Education_draft.pptx
Introduction to AI in Higher Education_draft.pptxIntroduction to AI in Higher Education_draft.pptx
Introduction to AI in Higher Education_draft.pptxpboyjonauth
 
Hybridoma Technology ( Production , Purification , and Application )
Hybridoma Technology  ( Production , Purification , and Application  ) Hybridoma Technology  ( Production , Purification , and Application  )
Hybridoma Technology ( Production , Purification , and Application ) Sakshi Ghasle
 
“Oh GOSH! Reflecting on Hackteria's Collaborative Practices in a Global Do-It...
“Oh GOSH! Reflecting on Hackteria's Collaborative Practices in a Global Do-It...“Oh GOSH! Reflecting on Hackteria's Collaborative Practices in a Global Do-It...
“Oh GOSH! Reflecting on Hackteria's Collaborative Practices in a Global Do-It...Marc Dusseiller Dusjagr
 
Introduction to ArtificiaI Intelligence in Higher Education
Introduction to ArtificiaI Intelligence in Higher EducationIntroduction to ArtificiaI Intelligence in Higher Education
Introduction to ArtificiaI Intelligence in Higher Educationpboyjonauth
 
Proudly South Africa powerpoint Thorisha.pptx
Proudly South Africa powerpoint Thorisha.pptxProudly South Africa powerpoint Thorisha.pptx
Proudly South Africa powerpoint Thorisha.pptxthorishapillay1
 
How to Make a Pirate ship Primary Education.pptx
How to Make a Pirate ship Primary Education.pptxHow to Make a Pirate ship Primary Education.pptx
How to Make a Pirate ship Primary Education.pptxmanuelaromero2013
 
ECONOMIC CONTEXT - LONG FORM TV DRAMA - PPT
ECONOMIC CONTEXT - LONG FORM TV DRAMA - PPTECONOMIC CONTEXT - LONG FORM TV DRAMA - PPT
ECONOMIC CONTEXT - LONG FORM TV DRAMA - PPTiammrhaywood
 
Alper Gobel In Media Res Media Component
Alper Gobel In Media Res Media ComponentAlper Gobel In Media Res Media Component
Alper Gobel In Media Res Media ComponentInMediaRes1
 
SOCIAL AND HISTORICAL CONTEXT - LFTVD.pptx
SOCIAL AND HISTORICAL CONTEXT - LFTVD.pptxSOCIAL AND HISTORICAL CONTEXT - LFTVD.pptx
SOCIAL AND HISTORICAL CONTEXT - LFTVD.pptxiammrhaywood
 

Recently uploaded (20)

भारत-रोम व्यापार.pptx, Indo-Roman Trade,
भारत-रोम व्यापार.pptx, Indo-Roman Trade,भारत-रोम व्यापार.pptx, Indo-Roman Trade,
भारत-रोम व्यापार.pptx, Indo-Roman Trade,
 
internship ppt on smartinternz platform as salesforce developer
internship ppt on smartinternz platform as salesforce developerinternship ppt on smartinternz platform as salesforce developer
internship ppt on smartinternz platform as salesforce developer
 
Staff of Color (SOC) Retention Efforts DDSD
Staff of Color (SOC) Retention Efforts DDSDStaff of Color (SOC) Retention Efforts DDSD
Staff of Color (SOC) Retention Efforts DDSD
 
call girls in Kamla Market (DELHI) 🔝 >༒9953330565🔝 genuine Escort Service 🔝✔️✔️
call girls in Kamla Market (DELHI) 🔝 >༒9953330565🔝 genuine Escort Service 🔝✔️✔️call girls in Kamla Market (DELHI) 🔝 >༒9953330565🔝 genuine Escort Service 🔝✔️✔️
call girls in Kamla Market (DELHI) 🔝 >༒9953330565🔝 genuine Escort Service 🔝✔️✔️
 
Pharmacognosy Flower 3. Compositae 2023.pdf
Pharmacognosy Flower 3. Compositae 2023.pdfPharmacognosy Flower 3. Compositae 2023.pdf
Pharmacognosy Flower 3. Compositae 2023.pdf
 
Painted Grey Ware.pptx, PGW Culture of India
Painted Grey Ware.pptx, PGW Culture of IndiaPainted Grey Ware.pptx, PGW Culture of India
Painted Grey Ware.pptx, PGW Culture of India
 
The Most Excellent Way | 1 Corinthians 13
The Most Excellent Way | 1 Corinthians 13The Most Excellent Way | 1 Corinthians 13
The Most Excellent Way | 1 Corinthians 13
 
TataKelola dan KamSiber Kecerdasan Buatan v022.pdf
TataKelola dan KamSiber Kecerdasan Buatan v022.pdfTataKelola dan KamSiber Kecerdasan Buatan v022.pdf
TataKelola dan KamSiber Kecerdasan Buatan v022.pdf
 
ENGLISH5 QUARTER4 MODULE1 WEEK1-3 How Visual and Multimedia Elements.pptx
ENGLISH5 QUARTER4 MODULE1 WEEK1-3 How Visual and Multimedia Elements.pptxENGLISH5 QUARTER4 MODULE1 WEEK1-3 How Visual and Multimedia Elements.pptx
ENGLISH5 QUARTER4 MODULE1 WEEK1-3 How Visual and Multimedia Elements.pptx
 
Crayon Activity Handout For the Crayon A
Crayon Activity Handout For the Crayon ACrayon Activity Handout For the Crayon A
Crayon Activity Handout For the Crayon A
 
Organic Name Reactions for the students and aspirants of Chemistry12th.pptx
Organic Name Reactions  for the students and aspirants of Chemistry12th.pptxOrganic Name Reactions  for the students and aspirants of Chemistry12th.pptx
Organic Name Reactions for the students and aspirants of Chemistry12th.pptx
 
Introduction to AI in Higher Education_draft.pptx
Introduction to AI in Higher Education_draft.pptxIntroduction to AI in Higher Education_draft.pptx
Introduction to AI in Higher Education_draft.pptx
 
Hybridoma Technology ( Production , Purification , and Application )
Hybridoma Technology  ( Production , Purification , and Application  ) Hybridoma Technology  ( Production , Purification , and Application  )
Hybridoma Technology ( Production , Purification , and Application )
 
“Oh GOSH! Reflecting on Hackteria's Collaborative Practices in a Global Do-It...
“Oh GOSH! Reflecting on Hackteria's Collaborative Practices in a Global Do-It...“Oh GOSH! Reflecting on Hackteria's Collaborative Practices in a Global Do-It...
“Oh GOSH! Reflecting on Hackteria's Collaborative Practices in a Global Do-It...
 
Introduction to ArtificiaI Intelligence in Higher Education
Introduction to ArtificiaI Intelligence in Higher EducationIntroduction to ArtificiaI Intelligence in Higher Education
Introduction to ArtificiaI Intelligence in Higher Education
 
Proudly South Africa powerpoint Thorisha.pptx
Proudly South Africa powerpoint Thorisha.pptxProudly South Africa powerpoint Thorisha.pptx
Proudly South Africa powerpoint Thorisha.pptx
 
How to Make a Pirate ship Primary Education.pptx
How to Make a Pirate ship Primary Education.pptxHow to Make a Pirate ship Primary Education.pptx
How to Make a Pirate ship Primary Education.pptx
 
ECONOMIC CONTEXT - LONG FORM TV DRAMA - PPT
ECONOMIC CONTEXT - LONG FORM TV DRAMA - PPTECONOMIC CONTEXT - LONG FORM TV DRAMA - PPT
ECONOMIC CONTEXT - LONG FORM TV DRAMA - PPT
 
Alper Gobel In Media Res Media Component
Alper Gobel In Media Res Media ComponentAlper Gobel In Media Res Media Component
Alper Gobel In Media Res Media Component
 
SOCIAL AND HISTORICAL CONTEXT - LFTVD.pptx
SOCIAL AND HISTORICAL CONTEXT - LFTVD.pptxSOCIAL AND HISTORICAL CONTEXT - LFTVD.pptx
SOCIAL AND HISTORICAL CONTEXT - LFTVD.pptx
 

A marketing study on Warid and its Ad performance

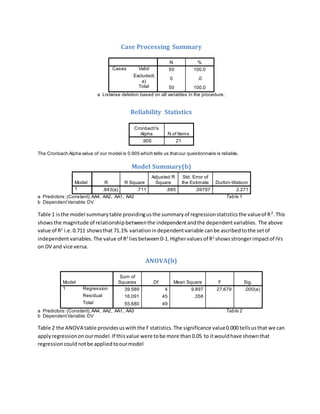
  • 1. Case Processing Summary N % Cases Valid 50 100.0 Excluded( a) 0 .0 Total 50 100.0 a Listwise deletion based on all variables in the procedure. Reliability Statistics Cronbach's Alpha N of Items .905 21 The Cronbach Alpha value of our model is 0.905 which tells us that our questionnaire is reliable. Model Summary(b) Model R R Square Adjusted R Square Std. Error of the Estimate Durbin-Watson 1 .843(a) .711 .685 .59797 2.271 a Predictors: (Constant), AA4, AA2, AA1, AA3 Table 1 b Dependent Variable: DV Table 1 is the model summary table providing us the summary of regression statistics the value of R2. This shows the magnitude of relationship between the independent and the dependent variables. The above value of R2 i.e. 0.711 shows that 71.1% variation in dependent variable can be ascribed to the set of independent variables. The value of R2 lies between 0-1. Higher values of R2 shows stronger impact of IVs on DV and vice versa. ANOVA(b) Model Sum of Squares Df Mean Square F Sig. 1 Regression 39.589 4 9.897 27.679 .000(a) Residual 16.091 45 .358 Total 55.680 49 a Predictors: (Constant), AA4, AA2, AA1, AA3 Table 2 b Dependent Variable: DV Table 2 the ANOVA table provides us with the F statistics. The significance value 0.000 tells us that we can apply regression on our model. If this value were to be more than 0.05 to it would have shown that regression could not be applied to our model
  • 2. Coefficients(a) Model Unstandardized Coefficients Standardized Coefficients B Std. Error Beta T Sig. 1 (Constant) .080 .568 .141 .888 AA1 .504 .168 .347 3.000 .004 AA2 -.301 .107 -.227 -2.818 .007 AA3 .197 .173 .148 1.136 .262 AA4 .529 .131 .456 4.051 .000 a Dependent Variable: DV Table 3 Table 3 is the coefficient table providing us the values for beta coefficients and t-statistics. The Beta coefficients of constant is .080 revealing the value of dependant variable keeping all the IVs are equal to 0 but the t-statistics for this value is .888(p > 0.05) which means that the constant value is insignificant. The quality of advertisements (AA1) has a positive relationship with effectiveness of ad campaigns (DV) as shown by the positive beta sign. The beta value shows the variation in effectiveness of ad campaigns (DV) caused by quality of advertisements (AA1). The beta value of quality advertisements is 0.504that tells us that a 1 degree change in quality of advertisements (AA1) will bring a 50.4% change in the effectiveness of ad campaigns (DV). The t value of this beta coefficient is 3.000 (p < 0.05) which means that the relationship between quality of advertisements and the effectiveness of ad campaigns is significant. The competitors (AA2) have an inverse relationship with effectiveness of ad campaigns (DV) as shown by the negative beta sign. The beta value of competitors is -0.301 that tells us that a 1 degree change in quality of advertisements (AA1) will bring a 30.1% negative change in the effectiveness of ad campaigns (DV). The t value of this beta coefficient is -2.818 (p < 0.05) which means that the relationship between quality of advertisements and the effectiveness of ad campaigns is significant. This negative value represents that as the competition increases the effectiveness of ad campaigns diminishes.
  • 3. The pricing and promotion (AA3) has a positive relationship with effectiveness of ad campaigns (DV) as shown by the positive beta sign. The beta value of pricing and promotion (AA3) is 0.197 that tells us that a 1 degree change in quality of advertisements (AA1) will bring a 19.7% change in the effectiveness of ad campaigns (DV). The t value of this beta coefficient is 4.051 (p < 0.05) which means that the relationship between Research and the effectiveness of ad campaigns is significant. The Research (AA4) has a positive relationship with effectiveness of ad campaigns (DV) as shown by the positive beta sign. The beta value of Research (AA4) is 0.529 that tells us that a 1 degree change in quality of advertisements (AA1) will bring a 52.9% change in the effectiveness of ad campaigns (DV). The t value of this beta coefficient is 1.136 (p < 0.05) which means that the relationship between pricing and promotion and the effectiveness of ad campaigns is insignificant.
  • 4. Correlations AA1 AA2 AA3 AA4 DV AA1 Pearson Correlation 1 Sig. (1-tailed) AA2 Pearson Correlation .059 1 Sig. (1-tailed) .342 AA3 Pearson Correlation .710(**) .086 1 Sig. (1-tailed) .000 .276 AA4 Pearson Correlation .578(**) .112 .688(**) 1 Sig. (1-tailed) .000 .218 .000 DV Pearson Correlation .702(**) -.143 .688(**) .732(**) 1 Sig. (1-tailed) .000 .161 .000 .000 ** Correlation is significant at the 0.01 level (1-tailed).  The relationship of Quality of Advertisement (AA1) and Competitors (AA2) is insignificant as shown by the significance value .342.  The relationship of Quality of Advertisement (AA1) and Pricing and Promotion (AA3) is significant as shown by the significance value 0.000. Hence a 1% change in Quality of Advertisement (AA1) will cause a 71% change in the variable Pricing and Promotion (AA3).  The relationship of Quality of Advertisement (AA1) and Research (AA4) is significant as shown by the significance value 0.000. Hence a 1% change in Quality of Advertisement (AA1) will cause a 57.8% change in the variable Research (AA4).  The relationship of Quality of Advertisement (AA1) and Effectiveness of Ad Campaigns (DV) is significant as shown by the significance value 0.000. Hence a 1% change in Quality of Advertisement (AA1) will cause a 70.2% change in the variable Effectiveness of Ad Campaigns (DV).  The relationship of Competitors (AA2) and Pricing and Promotion (AA3) is insignificant as is shown by the significance value .276.  The relationship of Competitors (AA2) and Research (AA4) is insignificant as is shown by the significance value .218.  The relationship of Competitors (AA2) and Effectiveness of Ad Campaigns (DV) is insignificant as is shown by the significance value .161.
  • 5.  The relationship of Pricing and Promotion (AA3) and Research (AA4) is significant as shown by the significance value 0.000. Hence a 1% change in Pricing and Promotion (AA3) will cause a 68.8% change in the variable Research (AA4).  The relationship of Pricing and Promotion (AA3) and Effectiveness of Ad Campaigns (DV) is significant as shown by the significance value 0.000. Hence a 1% change in Pricing and Promotion (AA3) will cause a 68.8% change in the variable Effectiveness of Ad Campaigns (DV).  The relationship of Research (AA4) and Effectiveness of Ad Campaigns (DV) is significant as shown by the significance value 0.000. Hence a 1% change in Research (AA4) will cause a 73.2% change in the variable Effectiveness of Ad Campaigns (DV). Descriptive Statistics N Minimum Maximum Mean Std. Deviation AA1 50 1.00 4.75 3.3100 .73290 AA2 50 2.25 5.00 3.9750 .80377 AA3 50 1.00 4.75 3.2150 .79861 AA4 50 1.00 4.50 3.2050 .91848 DV 50 1.00 5.00 2.8800 1.06599 Valid N (listwise) 50 The descriptive stats reveal that the ad campaigns of Warid are ineffective. The mean value of the dependent variable is less than 3 which signify that majority of the people in the survey were in disagreement of the effectiveness of ad campaigns of Warid. If this value were to be more than 3 then it would have meant that the ad campaigns of Warid are effective.
  • 6. Conclusion After analyzing all the results and findings I would like to conclude this chapter by saying that all the independent variables except for pricing and promotion impact the dependent variable. The hypothesis of pricing and promotion has been found to be null i.e. any change in pricing and promotion will have no effect on the effectiveness of ad campaigns. Also after analysis we also came to found out that competition has an inverse relationship with the dependent variable i.e. an increase in competition will lead to reduced effectiveness of ad campaigns and vice versa. The rest of the variables (quality of advertisement and research) have a direct relationship with the dependent variable i.e. and increase in any of these will increase the effectiveness of ad campaigns and vice versa.