
Recommended
Recommended
More Related Content
Similar to DSCI-303Operations Management1Sessions 15 & 16.docx
Similar to DSCI-303Operations Management1Sessions 15 & 16.docx (20)
More from jacksnathalie
More from jacksnathalie (20)
Recently uploaded
Recently uploaded (20)
DSCI-303Operations Management1Sessions 15 & 16.docx
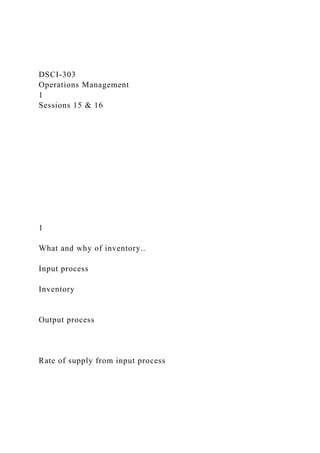
- 1. DSCI-303 Operations Management 1 Sessions 15 & 16 1 What and why of inventory.. Input process Inventory Output process Rate of supply from input process
- 2. Rate of demand from output process Inventory 2 2 Inventory helps.. Maintain independence of operations Meet variation in product demand Allow flexibility in production scheduling Provide a safeguard for variation in raw material delivery time Take advantage of economic purchase-order size 3 4
- 3. Inventory considerations.. Inventory = stacks of money sitting on forklifts, on shelves, and in trucks and planes while in transit For many businesses, inventory is the largest asset on the balance sheet at any given time Inventory is often not very liquid It may be a good idea to try to get the inventory down as far as possible 4 Inventory affects ROA (Return on Assets) 5 Return on Assets Profit Total assets Working capital + Fixed assets = = Ability to supply from stock Obsolescence, damage, loss Cost of funding inventory Storage costs Ordering costs Amount you owe suppliers Amount customers owe you
- 4. e.g. Automotive parts distributor e.g. Local retail store Single-stage inventory system Suppliers Suppliers Stock Sales operation Central depot
- 5. Distribution Local distribution point Sales operation Two-stage inventory system Single-stage, two-stage, multi-stage inventory systems 6 e.g. Television manufacturer Suppliers Input stock Stage 1 WIP Stage 2 WIP
- 6. Stage 3 Finished goods stock Multi-stage inventory system 6 A multi-echelon inventory system Yarn producers
- 7. Cloth manufacturers Garment manufacturers Regional warehouses
- 8. Retail stores 7 7 Inventory Models The single-period model Used when we are making a one-time purchase of an item Multi-period models Fixed-order quantity model Used when we want to maintain an item “in-stock,” and when we restock, a certain number of units must be ordered Fixed–time period model The item is ordered at certain intervals of time 8
- 9. The Single-Period Inventory Model Consider the problem of deciding how many newspapers to order for a news stand Too few papers: run out of stock, lose associated profit Too many papers: have left over inventory, lose the amount paid on the left over papers Probability of over/under-stock is different for each order quantity Numbers involved drive the final order quantity.. 9 The Multi-Period Models Fixed–order quantity model Also called the Economic Order Quantity model / Q-model Event triggered (stock falling below certain level) Fixed–time period model Also called the periodic system / periodic review system / fixed-order interval system / P-model Time triggered
- 10. 10 The Multi-Period Models - comparison 11 EOQ model: Inventory over time Time Instantaneous deliveries of Q per period Q D Inventory level Steady and predictable demand (D)
- 11. Slope = demand rate (D) = Average inventory Q 2 Order quantity = Q 12 12 EOQ model: The re-order point
- 12. 400 300 200 100 Inventory level 0 0 1 2 3 4 5 6 7 8 Re-order level Re-order point Time Demand (D) = 100 items per week Order lead time
- 13. 13 13 EOQ model: Two alternatives.. Time Inventory level Plan A Q = 400 Demand (D) = 1000 items per year Average inventory for plan A = 200 Average inventory for plan B = 50 0.1 yr 0.4 yr 100
- 14. 400 Plan B Q = 100 14
- 15. 14 EOQ Model: Inventory Costs Holding (or carrying) costs Costs for storage, handling, insurance, and so on Ordering costs Costs of placing an order Setup (or production change) costs Costs for arranging specific equipment setups, and so on Shortage costs Costs of running out 15 5 400 350 300
- 16. 250 200 150 100 50 400 350 300 250 200 150 100 50 Order quantity Costs Economic order quantity (EOQ) Total costs Holding costs Order costs
- 17. EOQ Model: Economic Order Quantity 16 16 EOQ Model Assumptions Demand for the product is constant and uniform throughout the period Lead time (time from ordering to receipt) is constant Price per unit of product is constant Inventory holding cost is based on average inventory Ordering or setup costs are constant All demands for the product will be satisfied 17
- 18. EOQ Model: The formula 18 12 EOQ Model: Example 19 We wish to find the economic order quantity and the reorder point given annual demand of 1,000 units, ordering cost of $5 per order, holding costs of $1.25 per unit per year, a lead time of 5 days and per unit cost of $12.50. EOQ Model: Example
- 19. 20 We wish to find the economic order quantity and the reorder point given annual demand of 1,000 units, ordering cost of $5 per order, holding costs of $1.25 per unit per year, a lead time of 5 days and per unit cost of $12.50. EOQ changes when true costs are considered.. Original holding costs Original total costs Revised holding costs Order quantity Costs
- 20. Original EOQ Revised EOQ Revised order costs Revised total costs Original order costs 21 21 Safety stock(s) – when demand / lead-time is uncertain
- 21. Inventory level S Q Time t1 t2 d1 d2 Re-order level (ROL) Distribution of lead-time usage ?
- 22. 22 22 The probability distributions for order lead time and demand rate combine to give the lead-time usage distribution 0.4 0.3 0.2 0.1 0 110 120 130 140 Probability Demand rate
- 26. Class C items Class B items Class A items Pareto curve for stocked items Percentage of types of items Percentage of value of items 24 24 Homework 2 is due by 6 pm on Oct 31 Questions? 26
- 27. 26 H DS Q opt 2 inventory of unit per cost storage and holding Annual H time Lead L pointP Reorder
- 34. + + = + + = + + = = = = = = = = = = H Q S Q D DC TC units H DS Q opt DSCI 303 Session 01 - Sep 03.pptx DSCI-303
- 35. Operations Management Session 01 1 Why should anyone study Operations Management? Transformation of inputs into output/s is at the core of every business Important for even non-OM executives across functional areas Every business activity is a process, and OM provides a framework to understand, analyze, and improve business processes What kind of job / business are you targeting at the end of your studies? Let’s take some examples.. OM can help in every instance! What knowledge, skills, and tools can help you succeed in that? Breadth of knowledge Ability to systematically analyze a business problem and present the findings Ability to work with a diverse set of people Ability to see the big picture (i.e. how the business makes money!)
- 36. http://www.youtube.com/watch?v=DS9TqkGR2t0 Why are we here ????????? 2 How a firm creates value and makes money: How effective Ops Mgmt. is a key to maximizing revenue and minimizing costs Process analysis: Process mapping, process design, management, control, and improvements How to manage products and services: Similarities and differences What will we learn??? 3
- 37. The course is explicitly designed to cover each of these! Interactive lectures will introduce the main topics Real-life examples will help us relate to these concepts There will be pre-announced quizzes along the way Class participation will: Improve everyone’s learning Improve your course grade Homework assignments will: Test your ability to apply the course concepts on your own How will we achieve this ??? 4 Group project will get you to: Hone your ability to work in teams, and prepare a professional report Present your collective findings to a managerial audience Finally, a comprehensive final exam will give you an opportunity to showcase all your knowledge and skills acquired or augmented during the course! How will we achieve this ??? 5
- 38. In-class Quizzes: Pre-announced on Blackboard, administered in-class No make-up quizzes offered Individual effort only Each quiz carries 20 points 6 Quizzes in total, only best 5 scores will be retained Collectively, the quizzes drive 10% of the final grade Let’s take a closer look! 6 Homework Assignments: Pre-scheduled, available on Blackboard from the beginning! Submission only through Blackboard Individual effort only
- 39. Each assignment carries 150 points No late submissions, no make-up assignments 3 assignments in total, only best 2 scores will be retained Collectively, the homework assignments drive 30% of the final grade Let’s take a closer look! 7 Term (team) Project: Will require teams of 4 students each An announcement with instructions will be sent on Sep 15 Each team will analyze the assigned company’s business throughout the term Each team will need to submit two interim reports, and one final report No late submissions, no make-up project The term project carries 200 points, and drives 20% of the final grade Let’s take a closer look! 8
- 40. Term (team) Project Presentation (with optional video recording & debrief): Tied to the term project Will be scheduled for Dec 8, 9, 10, 11 Carries 100 points, and drives 10% of the final grade More details will be provided later on.. Let’s take a closer look! 9 Final Exam (optional, provided you act in time): Comprehensive! Open textbook / notes (non-electronic) Bring your own calculator/pen/pencils (BYOCPP) See the 1st page of course syllabus for the schedule Will be 2-hr long No alternate arrangements allowed except for students with a pre-certified disability Carries 200 points, and drives 20% of the final grade (unless
- 41. declared otherwise by submitting your choice before the deadline) Let’s take a closer look! 10 Class Attendance and Participation: Attendance: 2 points x 25 out of 27 sessions = 50 points = 5% of the final grade Participation: 0-5 points per session, 50 points max = 5% of the final grade Let’s take a closer look! 11
- 42. Let’s repeat.. 12 Do show up in every class, better yet – do come prepared! Do read the HWs before each class, write up your answers right after the class! Do remain courteous to your faculty & fellow students at all times. Do read the instructions in the syllabus and the assignments before starting. Do leverage (in a timely manner..) all opportunities to get feedback. Do choose your teammates wisely! Do check your submissions before AS WELL AS after submitting! Do follow “work hard, play hard” strategy! Do have FUN!
- 43. How to get an A: Some do’s 13 Don’t apologize for arriving late or leaving early! Just get on with it.. Don’t let your phone ring and don’t look at your phone / tablet / laptop.. Don’t pack up your things before I actually end the class! Don’t ever ask if you “missed anything important” during an absence! Don’t ask about ANYTHING without checking the syllabus first! Don’t plagiarize, else be prepared for the consequences.. Don’t get mad if you receive critical feedback. Don’t EVER ask for a better grade just because you have always had an A! Don’t complain about the workload saying “you know, this isn't the only class I'm taking”.. How to get an A: Some don’ts
- 44. 14 Now, let’s get to know one another! 15 Amit (that’s me..): Origin Continents Three lives Education Industries Current interests and hobbies 16
- 45. Now, it’s your turn: Cover the following quickly: Name, where you are from (State / Country) One interesting fact about you that almost no one knows.. The grade that you want to score in this course.. 17 Questions? 18
- 46. 18 Sr. Assessment Item Points Weight 1 Knowledge of Key Operations Concepts -class Quizzes (best 5 out of 6) 20 points x 5 = 100 points 10% 2 Application of Knowledge 150 points X 2 = 300 points 30% 200 points X 1 = 200 points 20% 200 points X 1 = 200 points 20% 3 Presentation of Work Presentation (1) 100 points X 1 = 100 points 10% 4 Class Attendance and Participation 2 points X 25 = 50 points 5% 0-5 points X 27 = 50 points 5% Total: 1000 points 100% * = Optional, provided you respond to a Blackboard assignment by the stated deadline. If so, your course grade will be based on the rest of the assessmen ts. If no response is received by the deadline, the final exam is mandatory. In this case, the final exam will count towards the course grade regardless of whether you actually show up for the final or not.
- 47. DSCI 303 Session 02 - Sep 08.pptx DSCI-303 Operations Management Session 02 1 What is Operations and Supply Chain Management? Operations and supply management (OSM): The design, operation, and improvement of the systems that create and deliver the firm’s primary products and services Concerned with the management of the entire system that produces a good or delivers a service 2 Operations: One Firm Customers
- 48. Input resources Output products and services Transformed resources Materials Information Customers Transforming resources Facilities Staff Design Planning and control Operation’s performance Operations strategy Improvement Operations management Operations strategy 3
- 49. “Dominant” Transformed Resource Material? Information? Customer? 4 Manufacturing Operations Mining companies Warehouses Postal services Container shipping line Trucking companies Grocery Store Automobile Plant Banks Airline Financial Analysis Theme Park News Service Theatre Telecom Spa Market Research Dentist Online Trading Gym Google Hotel Credit card company Skydiving
- 50. Products vs. Services Intangibility Inseparability Heterogeneity Perishability 5 5 Products – Services Continuum 6 6 Products with services or Services with products? Benefits?
- 51. Examples? Future? Servitization 7 Design: the processes for designing products and services through active collaboration between suppliers, customers, and the firm Planning: the processes needed to operate an existing supply chain / firm operations strategically Sourcing: the selection of suppliers that will deliver the goods and services needed to create and deliver the firm’s product Making: Where the major product is produced or the service is provided Delivering: carriers are picked to move products to warehouses and customers Returning: the processes for receiving worn-out, defective, and excess products back from customers Work Involved.. 8 Operations: Entire Supply Chain 9
- 52. The consultancy services market – % of worldwide revenues of 40 largest consultancy firms Marketing/sales 2 Operations and process management 31 Corporate strategy 17 IT strategy 17 Benefits/Actuarial 16 Organizational design 11 Financial 6 Operations management is fashionable! 10
- 53. 10 Flow between operations The level of the supply network The level of the operation Flow between processes The level of the process Flow between resources
- 54. Operations at Three Different Levels 11 11 Financial services An account management centre at a large retail bank Financial analyst advising a client at an investment bank Furniture manufacturing Mass production of kitchen units Craft production of reproduction ‘antique’ furniture
- 55. Hotels Value-for-money hotel Lobby of an international luxury hotel Differences within Sectors vs. between Sectors 12 12 Variation in demand High Low Visibility High Low Variety High Low High
- 56. Volume Low High What affects Operations? The 4 Vs 13 13 High Implications Low repetition Each staff member performs more of each task Less systemization High unit costs Implications High repeatability Specialization Capital intensive Low unit costs Volume Low High
- 57. What affects Operations? The implications of high and low Volume in operations and processes 14 14 High Implications Flexible Complex Match customer needs High unit costs Implications Well defined Routine Standardized Regular Low unit costs Variety High Low The implications of high and low Variety in operations and processes What affects Operations?
- 58. 15 15 High Implications Changing capacity Anticipation Flexibility In touch with demand High unit costs Implications Stable Routine Predictable High utilization Low unit costs Variation in demand High Low The implications of high and low Variation in operations and processes What affects Operations? 16
- 59. 16 High Implications Short waiting tolerance Satisfaction governed by customer perception Customer contact skills needed Received variety is high High unit costs Implications Time lag between production and consumption Standardization Low contact skills High staff utilization Centralization Low unit costs Visibility High Low The implications of high and low Visibility in operations and processes What affects Operations? 17
- 60. 17 Questions? 18 DSCI 303 Session 03 - Sep 10.pptx DSCI-303 Operations Management Session 03 1
- 61. Operations can make or break a firm.. 2 Operations: Stakeholders Shareholders Directors / top management Staff Staff representative bodies Regulatory bodies Government Suppliers Lobby / interest groups Customers ‘Society’ 3 Triple Bottom Line Operations Performance Objectives 4
- 62. Competitive Dimensions Operations Performance Objectives Competitiveness Quality Being RIGHT Speed Being FAST Dependability Being ON TIME Cost Being PRODUCTIVE Being ABLE TO CHANGE Flexibility 5
- 63. All objectives may not be as important! Polar diagrams are used to indicate the relative importance of each performance objective to an operation or process. They can also be used to indicate the difference between different products and services produced by an operation or process. Cost Quality Flexibility Dependability Speed 6 6 Polar diagrams for a Taxi service vs. a Bus service (Shows the relative importance of each competitive dimension)
- 64. 7 This chart was created in MS-Excel using “Radar Chart” 7 Questions? 8 DSCI 303 Session 04 - Sep 15.pptx DSCI-303 Operations Management Session 04 1
- 65. Operations Strategy vs. Operations Management 2 What is strategy? Setting broad objectives that direct an enterprise towards its overall goal. Planning the path (in general rather than specific terms) that will achieve these goals. Stressing long-term rather than short-term objectives. Dealing with the total picture rather than stressing individual activities. Being detached from, and above, the confusion and distractions of day-to-day activities. 3 What is the role of the operations function?
- 66. Operations as implementer of strategy Operations implements strategy Strategy Operations Operations drives strategy Operations as driver of strategy Strategy Operations Operations supports strategy Operations as supporter of strategy Strategy Operations 4 4 Top-down perspective
- 67. What the business wants operations to do Operations resources perspective What operations resources can do What day-to-day experience suggests operations should do Bottom-up perspective Market requirement perspective What the market position requires operations to do Operations strategy The four perspectives on operations strategy 5 5 1 What you HAVE in terms of operations capabilities
- 68. What you NEED to ‘compete’ in the market Operations resources Market requirements What you WANT from your operations to help you ‘compete’ What you DO to maintain your capabilities and satisfy markets Strategic reconciliation Reconciling market requirements and operations resources 6 6 Operations strategy at Flextronics Operations strategic decisions
- 69. Industrial parks, with low cost but close locations and co-located suppliers Market requirements Low costs Responsiveness Flexibility Flextronics 7 Operations strategy at Southwest Operations strategic decisions Stripped down service One technology Cheap airport locations Fast turnround Market requirements Low prices Reliability Basic service
- 70. 8 Competitive Dimensions Operations Performance Objectives Competitiveness Quality Being RIGHT Speed Being FAST Dependability Being ON TIME Cost Being PRODUCTIVE Being ABLE TO CHANGE Flexibility 9
- 71. Order-winning, qualifying, and less important competitive factors Neutral +ve –ve Performance Competitive benefit Qualifying factors Order qualifiers: the basic criteria that permit the firms products to be considered as candidates for purchase by customers 10 10 Order-winning, qualifying, and less important competitive
- 72. factors Neutral +ve –ve Performance Competitive benefit Order-winning factors Order winners: the criteria that differentiates the products and services of one firm from another 11 11 Neutral
- 73. +ve –ve Performance Competitive benefit Less important factors Order-winning, qualifying, and less important competitive factors Less important factors: the criteria that customers hardly care about 12 12 Introduction Growth Maturity Decline Sales volume
- 74. Volume Customers Competitors Variety of product/ service design Slow growth in sales Innovators Few/none Customization or frequent design changes Rapid growth in sales volume Early adopters Increasing numbers Increasingly standardized Sales slow and level off Bulk of market Stable number Emerging dominant types Market needs largely met Laggards Declining numbers Possible move to commodity standardization The effects of the product / service life cycle Time 13 13 6
- 75. Introduction Growth Maturity Decline Sales volume The effects of the product / service life cycle (Continued) Time Likely order winners Likely qualifiers Dominant performance objectives Product/ service characteristics Quality range Flexibility quality Availability quality Price range Speed dependability quality Low price dependable supply
- 76. Quality range Cost dependability Low price Dependable supply Cost 14 14 6 Next time.. Quiz 1 Questions? 16
- 77. DSCI 303 Session 05 - Sep 17.pptx DSCI-303 Operations Management Session 05 1 Quiz 1
- 78. Product & Service Design Operations strategy Design Improvement Planning and control Process design Supply network design Layout and flow Process technology People, jobs and organization Product/service design Operations management 3
- 79. 3 Products, services and the processes which produce them all have to be designed. Decisions taken during the design of a product or service will have an impact on the decisions taken during the design of the process which produces those products or services and vice versa. Nature and purpose of the design activity 4 4 The design of products/services (WHAT) and… …the design of processes (HOW) Products and services should be designed in such a way that they can be created effectively. Product/service design has an impact on the process design and vice versa.
- 80. Processes should be designed so they can create all products and services which the operation is likely to introduce. 5 5 What is designed in a product or service? A concept the understanding of the nature, use and value of the service or product; A package the group of ‘component’ products and services that provide those benefits defined in the concept; A process the way in which the component products and services will be created and delivered. 6 6 The stages of product / service design
- 81. Concept generation Concept screening Preliminary design Evaluation and improvement Prototyping and final design 7 7 Concept generation Ideas from customers formally through Marketing activities Listening to customers – on a day-to-day basis Ideas from competitor activity – For example, reverse engineering Ideas from staff – Especially those who meet customers every day
- 82. Ideas from research and development Ideas from other stakeholders 8 8 Broad categories of evaluation criteria for assessing concepts Feasibility – How difficult is it? The criteria for screening concepts What investment both managerial and financial, will be needed? What return in terms of benefits to the operation will it give? What risks do we run if things go wrong? Acceptability – How worthwhile is it? Vulnerability – What could go wrong?
- 83. Overall evaluation of the concept Concept screening 9 9 Uncertainty regarding the final design Certainty regarding the final design TIME Reduction in number of possibilities along the way CONCEPT FINAL DESIGN SPECIFICATON Choice and evaluation ‘Screens’
- 84. Large number of design options One design
- 85. 10 10 Example – Square watermelons What market-related questions would you ask before producing square watermelons commercially? What finance-related questions would you ask before producing square watermelons commercially? What operations-related questions would you ask before producing square watermelons commercially? 11
- 86. 11 Designing Service Products Service products are very different Direct customer involvement introduces significant variability in the process Questions to address: How will this variability be addressed? What are the implications for operational cost and the customer service experience? 12 Questions? 13
- 87. Operation management2.zip DSCI 303 Session 06 - Sep 22.pptx DSCI-303 Operations Management Session 06 1 Designing processes There are different ‘process types’. Process types are defined by the volume and variety of ‘items’ they process. Process types go by different names depending on whether they produce products or services. 2
- 88. 2 High Volume Low High Variety Project Low Manufacturing process types Process tasks Process flow Diverse/ complex Repeated/ divided Intermittent Continuous Jobbing Batch / Cell Mass Contin-uous
- 89. 3 3 One-off, complex, large scale, high work content ‘products’ Specially made, every one customized Defined start and finish: time, quality and cost objectives Many different skills have to be coordinated. Project processes 4 4 Very small quantities: ‘one-offs’, or only a few required Specially made. High variety, low repetition. ‘Strangers’ every one customized
- 90. Skill requirements are usually very broad Skilled jobber, or team, complete whole product. Jobbing processes 5 5 Higher volumes and lower variety than for jobbing Standard products, repeating demand. But can make specials Specialized, narrower skills Set-ups (changeovers) at each stage of production. Batch Processes 6 6
- 91. Higher volumes than batch Standard, repeat products (‘runners’) No set-ups, or almost instantaneous ones. Low and/or narrow skills Mass (line) processes 7 7 Extremely high volumes and low variety: often single product Standard, repeat products (‘runners’) Highly capital-intensive and automated Few changeovers required Difficult and expensive to start and stop the process. Continuous processes 8
- 92. 8 Volume Low High Variety Low High Service process types Process tasks Process flow Diverse/ complex Repeated/ divided Intermittent Continuous Professional service Service shop Mass service 9
- 93. 9 Professional service High levels of customer (client) contact. Clients spend a considerable time in the service process. High levels of customization with service processes being highly adaptable. Contact staff are given high levels of discretion in servicing customers. People-based rather than equipment-based. 10 10 Medium levels of volumes of customers Medium, or mixed, levels of customer contact
- 94. Medium, or mixed, levels of customization Medium, or mixed, levels of staff discretion. Service shops 11 11 High levels of volumes of customers Low to medium levels of customer contact Low, or mixed, levels of customization Low, or mixed, levels of staff discretion. Mass service 12 12
- 95. All the options: 13 13 Variety Volume Deviating from the ‘natural’ diagonal.. None None The ‘natural’ line of fit of process to volume/variety characteristics Project Jobbing Batch Mass Continuous Manufacturing operations process types Professional
- 96. service Service shop Mass service Service operations process types More process flexibility than is needed so high cost Less process flexibility than is needed so high cost 14 14 9 Questions? 15
- 97. DSCI 303 Session 07 - Sep 24.pptx DSCI-303 Operations Management Session 07 1 Throughput (TH) = Work In Process (WIP) x Cycle Time (CT) Little’s law (a really quite useful law) Cycle time = 2 mins Throughput time = ? WIP = 10
- 98. Throughput time = 10 × 2 mins Throughput time = 20 mins 2 2 Throughput time and capacity utilization 0 20% 40% 60% 80% 100% Capacity utilization
- 99. Low X X X High utilization but long throughput times Low utilization but short throughput times Reduce process variability High 10 mins 30 mins Arrival frequency (demand) Processing time Utilization = 33.33 % Q = 0 Average length of queue X Utilization = 50 % Q = 0 20 mins X 10 mins Utilization = 100 % Q = 0
- 100. X Utilization = 100 % Q = infinity 9 mins X 5–15 mins 5–15 mins Arrival frequency (demand) Processing time Utilization = <100% % Q = >0 Process throughput time (or inventory) 3 3 Term Project What? How? When?
- 101. Where? 4 4 Homework 1 can be submitted on Blackboard from Sep 26 & is due by 6 pm on Oct 3 Questions? 6
- 102. DSCI 303 Session 08 - Sep 29.pptx DSCI-303 Operations Management Session 08 1 The relative positioning of transforming resources Layout design involves.. The allocation of tasks to transforming resources The flow of transformed resources 2
- 103. 2 Layout types: Fixed-position layout 3 3 Layout types: Functional layout 4 4 Layout types: Cell layout 5
- 104. 5 Layout types: Product layout 6 6 Regular flow more important Regular flow more feasible Layout types – impact of volume and variety Low Volume High High Variety Low Fixed-position layout Functional layout
- 105. Cell layout Product layout Flow becomes continuous Flow is intermittent 7 7 Service functional types Mass services Service shops Manufacturing functional types Continuous processes Mass processes Batch processes
- 106. Basic layout types Fixed-position layout Functional layout Cell layout Product layout Process and layout types.. Jobbing processes Professional services Project processes 8 8 Cost implications of layout types Volume Costs Use product
- 107. Use cell Use functional Use fixed-position Fixed-position Functional Cell Product 9 9 9 1 every 15 minutes
- 108. 15 15 15 15 1 every 15 minutes 30 30 30 30 Product Layout: ‘Long and thin’ versus ‘short and fat’ layouts
- 109. 1 every 15 minutes 60 60 60 60 Short -fat process Long-thin process A 60 minute task with a required cycle time of 15 minutes 10 10 Product Layout: ‘Long and thin’ versus ‘short and fat’ layouts 11 Advantages of long-thin processes
- 110. Controlled flow Simple materials handling Lower capital requirement (no duplication) Greater efficiency Higher space utilization Advantages of short-fat processes Higher mix flexibility Higher volume flexibility Greater robustness Less monotonous Higher ownership Long and short describes the number of stages Fat and thin describes the amount of work at each stage 11 Next time..
- 111. Quiz 2 12 Homework 1 is due by 6 pm on Oct 3 Questions? 14
- 112. DSCI 303 Session 09 - Oct 01.pptx DSCI-303 Operations Management Session 09 1 Quiz 2 Supply Chain Design: Key Questions What is a SUPPLY CHAIN? Why should an organization take a total supply network perspective? What is involved in configuring a supply network? What type of supply network is appropriate? Where should an operation be located? 3
- 113. 3 Customers.. Suppliers.. What is a Supply Chain? The Firm Supply…CHAIN..
- 114. 2nd tier.. 1st tier.. 1st tier.. 2nd tier.. Upstream.. Downstream.. 4 4 An example.. 5 Plastic homeware manufacturer First tier suppliers Packaging supplier Plastic stockist First tier customers
- 115. Wholesaler Second tier suppliers Ink supplier Cardboard company Chemical company Second tier customers Retailer Retailer Direct supply Information
- 116. 5 Why take a total supply network perspective? Looking at the whole supply chain allows a firm: To identify significant linkages / risks involved To focus on long-term issues To understand the sources of competitive advantages and disadvantages To decide on the extent of vertical integration 6 6 What is involved in configuring a Supply Chain? Decide on the extent of vertical integration Decide on the type of supply chain Decide on where to locate the business 7 7
- 117. Vertical integration Extent – Narrow process span Extent – Wide process span Direction – Upstream vertical integration Direction – Downstream vertical integration Wholesaler Raw material suppliers Component maker Assembly operation Retailer Balance — should excess capacity be used to supply other companies? 8
- 118. 8 Types of supply chain.. Demand Uncertainty Supply Uncertainty 9 9 Offshoring & outsourcing: related YET different.. 10 Outsourcing Domestic supplier delivers products and/or services Offshore outsourcing Overseas supplier delivers products and/or services Domestic operations Focal operation performs activities themselves Offshore operations Focal operation’s overseas operation delivers products and/or services
- 119. Location of operations Don’t own the assets Own the assets Domestic International 10 Deciding where to locate.. The operation Supply-side factors which vary to influence costs as location varies. For example: labor costs land costs energy costs transportation costs community factors Demand-side factors which vary to influence customer service/revenue as location varies. For example:
- 120. labor skills suitability of site Image convenience for customers 11 11 Supply chain planning and control First tier supplier
- 121. Second tier supplier First tier customer Second tier customer End customer Demand side Supply side Purchasing and supply management Physical distribution management Logistics Materials management Supply chain management
- 122. Information flow Physical flow 12 12 Homework 1 is due by 6 pm on Oct 3 Questions? 14
- 123. DSCI 303 Session 10 - Oct 06.pptx DSCI-303 Operations Management Session 10 1 Supply chain management .. Products and services New products and services Delivery information Payment request/Credit. ‘Downstream’ flow of products and services for customer Fulfilment ‘Upstream’ flow of customer Requirements Long-term plans and requirements Market research information
- 124. Individual orders Payment Demands for new products and services Flow between processes Consumer Flow between processes Flow between processes Operation 1
- 125. Operation 2 Operation 3 2 2 P&G finds that retail demand for diapers is very steady The orders placed by a firm (i.e., demand for upstream firms) should also be steady Low demand variation should imply low safety stock Is that what actually happens???? NO! Demand shows GREATER volatility for upstream firms! 3 The bullwhip effect: P&G DC Distributor Walmart Target Retailers Supplier Manufacturer Factory
- 126. 4 What actually happens? Weekly demand Weekly demand Weekly demand Weekly demand Weekly demand Bullwhip Effect: Demand and inventory variation is amplified as you go upstream in the supply chain P&G DC Distributor Walmart Target Retailers Supplier Manufacturer Factory
- 130. Orders 0 Time Retailer’s orders to Wholesaler Time Wholesaler’s orders to Distributor
- 131. Orders 0 Distributor’s orders to Manufacturer
- 133. Orders 0 Time Retailer Wholesaler Distributor Manufacturer The bullwhip effect: Demand variation increases in magnitude as we go upstream The more upstream we go, the more swings we encounter 5
- 135. 3 2 1 3rd LEVEL SUPPLIER 2nd LEVEL SUPPLIER 1st LEVEL SUPPLIER ORIGINAL EQUIPMENT MFG. DEMAND PERIOD Prodn. Stock Prodn. Stock Prodn. Stock Prodn. Stock 100 100 100 100 100 100 100 100 100 100 100 100 100
- 136. 3 2 1 ALL OPERATIONS HOLD ONE PERIOD’S STOCK 20 100 60 60 100 80 80 100 90 100 95 90 100 95 180 60 120 120 80 100 100 90 95
- 138. 95 95 95 95 95 95 95 The bullwhip effect: OEM 7 7 The bullwhip effect..
- 139. 6 5 4 3 2 1 3rd LEVEL SUPPLIER 2nd LEVEL SUPPLIER 1st LEVEL SUPPLIER ORIGINAL EQUIPMENT MFG. DEMAND PERIOD Prodn. Stock Prodn. Stock Prodn. Stock Prodn. Stock 100 100 100 100 100 100 100 100
- 140. 100 100 100 100 100 Name: DSCI 303: Quiz 3 Grading: 20 points (total) 1 point for completely filling both columns for each supply chain entity x 4 = 4 points 4 points for getting all numbers correct for each supply chain entity x 4 = 16 points On Oct 15! 8 8 9 The bullwhip effect - Causes Causes of bullwhip effect Demand forecast update Order batching Price fluctuation Order rationing and gaming
- 141. 10 The bullwhip effect - Remedy Improved communication across the supply chain Better forecast Consistent pricing Accurate, real-time sharing of demand data (ERP systems can help) Reduce delays (order processing delays as well as shipping delays) Term Project: 1st Interim Report is due by 6 pm on Oct 10
- 143. 100 125 150 175 200 135791113151719 0 25 50 75 100 125 150 175 200 135791113151719 0 25 50 75 100 125 150 175 200 135791113151719 Operation management 3.zip DSCI 303 Session 11 - Oct 08.pptx DSCI-303 Operations Management Session 11 1
- 144. Web-integrated enterprise resource planning (collaborative commerce, c-commerce) Enterprise resource planning (ERP) Manufacturing resource planning (MRPII) Increasing integration of information systems Increasing impact on the whole supply network The development of ERP Material requirements planning (MRP) 2 2 Material requirements planning Master production schedule
- 145. Customer orders Forecast demand Bill of materials Inventory records Purchase orders Materials plans Works orders Material Requirement Planning (MRP) schematic 3 3 The concept of MRP II Design Marketing Operations
- 146. Finance Central database 4 4 Integrated database ERP integrates several systems Purchasing and supply applications Operations applications Financial applications Strategic reporting applications Sales and marketing applications Delivery and logistics applications
- 147. Service applications HRM applications Senior management and stakeholders Employees Suppliers Customers Front-office staff Back-office staff Employees 5 5 ‘Partnership’ supply management
- 148. The character of internal operations activity Do nothing Do everything important Do everything Transactional – many suppliers Close – few suppliers Type of inter-firm contact Virtual spot trading Long-term virtual operation Vertically integrated operation Traditional supply management Supply chain relationships – by relationship 6 6 Business to Business (B2B) Most common, all but the last link in the supply chain E-commerce examples: EDI networks Business information exchanges. Business to Consumer (B2C)
- 149. Retail operations Catalogue operations, etc. E-commerce examples: Internet retailers Amazon.com, etc. Consumer to Business (C2B) Consumers ‘offer’, business responds E-commerce examples: Some airline ticket operators Priceline.com, etc. Supply chain relationships – by entities Trading ‘swap’ and auction transactions E-commerce examples: Specialist ‘collector’ sites Ebay.com, etc. Consumer to Consumer (C2C) Business Consumer To… Business Consumer From… 7
- 150. 7 Logistics-System Design Matrix Modes of transport 8 Term Project: 1st Interim Report is due by 6 pm on Oct 10 Next time (Wed).. Quiz 3 10
- 151. Questions? 11 DSCI 303 Session 12 - Oct 15.pptx DSCI-303 Operations Management Session 12 1 The bullwhip effect..
- 152. 6 5 4 3 2 1 3rd LEVEL SUPPLIER 2nd LEVEL SUPPLIER 1st LEVEL SUPPLIER ORIGINAL EQUIPMENT MFG. DEMAND PERIOD Prodn. Stock Prodn. Stock Prodn. Stock Prodn. Stock
- 153. 100 100 100 100 100 100 100 100 100 100 100 100 100 Name: DSCI 303: Quiz 3 Grading: 20 points (total) 1 point for completely filling both columns for each supply chain entity x 4 = 4 points 4 points for getting all numbers correct for each supply chain entity x 4 = 16 points Today is Oct 15! 2 Quiz 3
- 154. Operation or process Input Output Compare / replan Intervention Plans A simple model of planning and control Monitor 4
- 155. 4 Planning is deciding Control is what activities should take place in the operation when they should take place what resources should be allocated to them understanding what is actually happening in the operation deciding whether there is a significant deviation from what should be happening (if there is a deviation) changing resources in order to affect the operation’s activities. Planning and control (Continued) 5 5 Planning: P:D ratio 6 The P:D ratio of an operation indicates how long the customer has to wait for the service or product as compared with the total time to carry out all the activities to make the service or product
- 156. available to the customer Cust-omer Obtain resources Create Deliver Design P = D Design, resource, create and deliver to order Cust-omer Create Deliver Obtain resources Design D P Design, create and deliver to order Examples: advertising agency, construction project Examples: website development, custom furniture production Lower volume Higher variety Higher volume Lower variety
- 157. 4 Planning: P:D ratio 7 The P:D ratio of an operation indicates how long the customer has to wait for the service or product as compared with the total time to carry out all the activities to make the service or product available to the customer Cust-omer Cust-omer Lower volume Higher variety Higher volume Lower variety Create Deliver Obtain resources Choose D P
- 158. Create and deliver to order Examples: hair blow-dry bar, house builder with standard designs Deliver Obtain resources Choose D Create Create P Examples: internet retail fulfilment, assemble to order computers (e.g. Dell) Partially create and deliver to order 4 Planning: P:D ratio 8 The P:D ratio of an operation indicates how long the customer
- 159. has to wait for the service or product as compared with the total time to carry out all the activities to make the service or product available to the customer Cust-omer Cust-omer Lower volume Higher variety Higher volume Lower variety Deliver Obtain resources Choose D Create P Create to stock Examples: domestic appliance production Deliver Obtain resources Choose D
- 160. Create P Collect/choose from stock Examples: collect retailer (e.g. IKEA), vending machines 4 Process: any part of an organization that takes inputs and transforms them into outputs Cycle time: the average successive time between completions of successive units Utilization: the ratio of the time that a resource is actually activated relative to the time that it is available for use Process Analysis 9 4
- 161. Single-stage Process Stage 1 Stage 1 Stage 2 Stage 3 Multi-stage Process Types of processes: 10 4 Multi-stage process with buffer..
- 162. 11 Process flowcharting: the use of a diagram to present the major elements of a process The basic elements can include tasks or operations, flows of materials or customers, decision points, and storage areas or queues Process Flowcharting: 12 4 Gambling at a slot machine.. Gambling at a slot machine begins with someone inserting a silver dollar in the slot machine. The coin moves to the payout bucket (used for payout whenever someone wins a jackpot) if the payout bucket is not full. If it is full, the coin moves to the
- 163. winnings bucket. The player is obviously not aware of this coin movement. After inserting the coin, the gambler pulls the arm on the slot machine to play. If the player wins a prize, the slot machine activates the payout from the payout bucket, and then pays out the winnings. Then (regardless of the outcome – win or lose), the player decides whether to play again or not. If the player wants to play again, the process starts all over again. If not, the player quits. 13 (Imperfect) Process chart for a slot machine 14 Questions? 15
- 164. DSCI 303 Session 13 - Oct 20.pptx DSCI-303 Operations Management Session 13 1 Process flowcharting: the use of a diagram to present the major elements of a process The basic elements can include tasks or operations, flows of materials or customers, decision points, and storage areas or queues Process Flowcharting: 2
- 165. 4 Process Flowcharting Example 1: Waking up Process Description: For Andy, the process of waking up starts when his alarm rings. When the alarm rings, Andy has to decide whether he is ready to get up or not. If he is ready to get up, he gets out of the bed, and the process of waking up comes to an end. If he is not ready to get up, he hits the snooze button on the alarm, and goes back to sleep for 5 minutes. This process continues until Andy wakes up. 3 4 Process Flowcharting Example 1: Waking up Any issues? 4
- 166. 4 Process Flowcharting Example 2: Bank teller Process Description: For a bank teller, it all starts when a customer arrives at the counter. After the customer makes a cash withdrawal request, the teller has to check the customer’s ID, available account balance, and whether such withdrawal is allowed under the bank’s policy. Only if the customer shows a valid ID, the teller will check the balance, and only if the account has the necessary balance, the teller will check whether the withdrawal request complies with the bank’s policy. If the request complies with the bank’s policy, the teller records the transaction, and then gives cash to the client. If any of the process checks (ID, balance, compliance with the bank’s policies) fail, then the withdrawal request is rejected. 5 4
- 167. Process Flowcharting Example 2: Bank teller Any issues? 6 4 Process Flowcharting Example 3: Your Call! Let’s make one example up! 7 4 Multi-stage process with buffer..
- 168. 8 Buffer: a storage area between stages where the output of a stage is placed prior to being used in a downstream stage Blocking: occurs when the activities in a stage must stop because there is no place to deposit the item Starving: occurs when the activities in a stage must stop because there is no work Bottleneck: stage that limits the capacity of the process Buffering, Blocking, and Starving.. 9 The drum, buffer, rope, concept Stage or process B Stage or process A
- 169. Stage or process D Stage or process E Buffer of inventory Stage or process C Bottleneck drum sets the beat Communication rope controls prior activities 10 10 Questions? 11
- 170. DSCI 303 Session 14 - Oct 22.pptx DSCI-303 Operations Management Session 14 1 What does planning involve? 2 Capacity .. means the scale of an operation. What is capacity? This alone does not reflect the operation’s processing capability.
- 171. Hence, we must incorporate a time dimension appropriate to the use of assets. For example, 24,000 liters per day; 10,000 calls per day; 57 patients per session; Etc. 3 3 Climatic Festive Behavioural Political Financial Social
- 172. Demand varies.. Construction materials Beverages (beer, cola) Foods (ice-cream) Clothing (swimwear, shoes) Gardening items (seeds) Fireworks Travel services Holidays Tax processing Doctors (influenza epidemic) Sports services Education services. 4 4
- 173. Demand fluctuations in four operations 5 5 Good forecasts are essential .. But, so is an understanding of demand uncertainty because it allows you to judge the risks to the service level. When demand uncertainty is high, the risks to service level of under provision of capacity are high. Demand Time Only 5% chance of demand being lower than this Demand Time Distribution of demand
- 174. Only 5% chance of demand being higher than this 6 6 Loading time Equipment ‘idling’ Speed losses Slow running equipment Net operating time Not worked (unplanned) Breakdown failure Set-up and change-overs Total operating time
- 175. Availability losses Operating equipment effectiveness (OEE) Availability rate = a = Total operating time Loading time Performance rate = p = Net operating time Total operating time Quality rate = q = Valuable operating time Net operating time Quality losses Valuable operating time Quality losses 7
- 176. 7 How capacity is used.. Design capacity 168 hours per week Effective capacity 109 hours per week Planned loss of 59 hours Actual output – 51 hours per week Avoidable loss – 58 hours per week Efficiency Actual output Effective capacity = Utilization Actual output Design capacity =
- 177. 8 8 Economies and Diseconomies of Scale Economies of scale: as a plant gets larger, the average cost per unit drops Lower operating and capital costs Per unit cost of equipment drops More specialization of labor At some point, the plant becomes too large Diseconomies of scale becomes a problem 9 Ways of reconciling capacity and demand Level capacity
- 178. Demand Capacity Chase demand Demand management Capacity Capacity Demand Demand 10 Absorb demand Adjust output to match demand
- 179. Change demand 10 Considerations in Changing Capacity Maintaining system balance Want similar capacities at each operation Deal with bottlenecks Frequency of capacity additions Cost of upgrading too frequently Cost of upgrading too infrequently External sources of capacity Outsourcing Sharing capacity 11 Pull and push philosophies..
- 180. 12 12 Planning Service Capacity Time: goods can not be stored for later use and capacity must be available to provide a service when it is needed Location: service goods must be at the customer demand point and capacity must be located near the customer Volatility of demand: much greater than in manufacturing 13 26 Yield Management Yield management: the process of allocating the right type of capacity to the right type of customer at the right price and time to maximize revenue or yield Can be a powerful approach to making demand more predictable
- 181. Has existed as long as there has been limited capacity for serving customers Its widespread scientific application began with American Airlines’ computerized reservation system (SABRE) 14 Yield management most effective when… Demand can be segmented by customer Fixed costs are high and variable costs are low Inventory is perishable Product can be sold in advance Demand is highly variable 15 Homework 2 can be submitted on Blackboard
- 182. from Oct 24 & is due by 6 pm on Oct 31 Questions? 17 DSCI 303 Session 15 and 16 - Oct 27 and Oct 29.pptx DSCI-303 Operations Management 1 Sessions 15 & 16
- 183. 1 What and why of inventory.. Input process Inventory Output process Rate of supply from input process Rate of demand from output process Inventory 2
- 184. 2 Inventory helps.. Maintain independence of operations Meet variation in product demand Allow flexibility in production scheduling Provide a safeguard for variation in raw material delivery time Take advantage of economic purchase-order size 3 4 Inventory considerations.. Inventory = stacks of money sitting on forklifts, on shelves, and in trucks and planes while in transit For many businesses, inventory is the largest asset on the balance sheet at any given time Inventory is often not very liquid It may be a good idea to try to get the inventory down as far as possible
- 185. 4 Inventory affects ROA (Return on Assets) 5 Return on Assets Profit Total assets Working capital + Fixed assets = = Ability to supply from stock Obsolescence, damage, loss Cost of funding inventory Storage costs Ordering costs Amount you owe suppliers Amount customers owe you e.g. Automotive parts distributor
- 186. e.g. Local retail store Single-stage inventory system Suppliers Suppliers Stock Sales operation Central depot Distribution Local distribution point Sales operation Two-stage inventory system Single-stage, two-stage, multi-stage inventory systems
- 187. 6 e.g. Television manufacturer Suppliers Input stock Stage 1 WIP Stage 2 WIP Stage 3 Finished goods stock Multi-stage inventory system
- 188. 6 A multi-echelon inventory system Yarn producers Cloth manufacturers
- 189. Garment manufacturers Regional warehouses Retail stores 7
- 190. 1. Homework Assignments (best 2 out of 3): · Top two scores out of the three homework assignment scores will be used for the final grade calculation. · Will contain multiplequestions requiring calculations / analysis / reflection. · Will be posted on Blackboard on prescheduled dates, and will be due by 6:00 pm (PST) seven days after. For example, the assignment posted on a Friday will be due by 6:00 pm (PST) next Friday. · Submission must be made via Blackboard, and MUST be in the form of a single MS-Word file / PDF file (as specified in the Homework Assignment), uploaded as an attachment with your response. Any other type of submission will receive zero points. · The file name MUST include the course code, section number, homework assignment number, your last name, and your first name as exemplified below (do change the Section Number, FirstName, and LastName as appropriate). Files named differently will automatically face a penalty (a stern warning for the first offence, 5-point penalty for the second offence, 25- point penalty for each subsequent offence). · Homework 1: DSCI303_Section1_HW1_FirstName_LastName.docx · If you make multiple submissions for an assignment, only your last submission made before the deadline will be graded. It is the student’s responsibility to ensure that the correct file is submitted, and that the file has uploaded successfully. · Late submissions: One late submission (with up to six hours of delay) will face no penalty. Subsequent offences / submissions
- 191. more than six hours late will automatically receive zero points regardless of the excuse. · No make-up assignments will be offered. 2. Final Exam (1, optional): · Offered only at the times specified by the University registrar, except for those with a pre-approved disability-related accommodation. · May contain a mix of multiple choice questions and questions that require analysis / calculation / reflection. · Cumulative, open book, and open notes (non-electronic). · No electronic devices except a calculator will be allowed in the exam hall. If a student appears to be using any other electronic device during the exam, the student will be asked to leave right away, and will receive zero points for the final exam regardless of his actual performance. No make-up exam will be offered DSCI 303 - Homework 02 - Assignment.docx DSCI 303: Homework 02 (150 points) Hello everyone! The second homework assignment for DSCI 303 is here! You need to: · Prepare a Process Flow Diagram that captures the flow of material, process steps, decision points, storage / buffer, and the hourly processing capacity of each step in the process based on the description given below. · Use a software program (of your choice) to create a ONE-
- 192. PAGE Process Flow Diagram – hand-drawn diagrams will automatically receive zero points, and multi-page diagrams will face a 10-point penalty for each additional page. · Then, convert your work into a SINGLE PDF file before submitting. All the requested details must be legible when the diagram is printed on a Letter (8.5”x11”) or an A3 (11”x17”) paper. · If any process step has multiple machines / resources that are identical to one another (identical source of input, identical transformation, identical destination for the output), draw only one shape for the step, and acknowledge the number of machines under the box / inverted triangle. · Mention the processing capacity of each step under the box / inverted triangle. Be consistent with the unit of time used across your diagram. · Name the file using the following sample as a guide (files named differently will automatically face a 25-point penalty): · DSCI303_Section1_HW2_FirstName_LastName.pdf · For example: DSCI303_Section2_HW2_Brad_Pitt.pdf · Submit your response as a SINGLE one-page PDF file attachment on Blackboard no later than by 6 pm on October 31, 2014. As you know, late responses attract a penalty (as described in the course syllabus), so don’t be late! Only Blackboard submissions count! Do let me know right away if you have any questions or concerns. Note: This is an individual-effort task – do not receive / provide any assistance from / to others. How your response will be graded: 1. Correct diagram (110 points) 1.1: Receiving and testing: 14 points 1.2: Dumping: 9 points 1.3: Temporary storage: 21 points
- 193. 1.4: Dechaffing / destoning / drying: 12 points 1.5: Separation / quality grading: 24 points 1.6: Bulking and bagging: 30 points 2. Neat, professional, easy-to-follow diagram (40 points) 1. 2. 2.1. Your name, section name at the top of the page: 2 points 2.2. Course name, assignment name at the top of the page: 2 points 2.3. Dotted-line boundaries around each process stage: 6 points 2.4. Correctly and legibly labeled boxes and arrows: 10 points 2.5. Clear indication of process start and end: 8 points 2.6. Properly aligned boxes, diamonds, inverted triangles and arrows: 12 points Introduction: Oh My God Cherries Inc. (OMGCI) – a North Carolina-based processor of cherries has a cherry processing plant located in Florida. This plant, called FL-1, receives both fresh (dry harvested) and process cherries (water harvested / wet) during each harvesting season. The handling process for cherries is highly mechanized at FL-1. The process consists of several operations: receiving and testing, dumping, temporary storage, destoning, dechaffing, drying, separation, and bulking / bagging. The objective of the entire process is to gather bulk cherries and prepare them for storage / further processing. Process stages: 1. Receiving and testing: Trucks arrive at FL-1 loaded with dry or wet cherries. When the truck arrives, its gross and empty weights are recorded in one step. Then, prior to unloading the cherries (achieved through dumpers, described in the next step), three separate samples are taken at the same time to determine the following: · The percentage of the truck’s net weight that is made up of
- 194. clean cherries · The percentage of unusable (poor / smaller / frosted) cherries in the truck · The color grade of the cherries in the truck 2. Dumping: After a truckload of cherries is weighed and sampled, the truck moves to one of the seven HH301 dumpers. The dumpers empty the truck content onto one of the seven rapidly moving belt conveyors. Each of the seven conveyors takes the cherries to the second level of the plant for storage in one of the 30 transient storage bins (TSBs). 3. Temporary storage: TSBs 1-20 can hold 250 barrels each, and TSBs 21-30 can hold 400 barrels each. TSBs 1-15 are used for dry cherries only, and TSBs 26-30 are used for wet cherries only. TSBs 16-25 can be used for either wet or dry cherries (however, dry and wet cherries are never combined in any TSB). Wet cherries from these bins are directly taken to one of the five dechaffing units. The dry cherries are routed through one of the four destoning units capable of processing 1500 barrels per hour each, before going through a dechaffing unit. 4. Dechaffing / Destoning / Drying: The dechaffing units can process up to 1500 barrels of cherries per hour each. Only the first two dechaffing units are used to process the wet cherries at any time. After dechaffing, the wet cherries are taken to one of the six drying units before being taken to the quality grading area. The drying units process wet cherries that come out of dechaffing area at the rate of 200 barrels per hour each. After drying, the wet cherries are taken to the quality grading area (as explained in the next paragraph). The dry cherries first go through destoning, then dechaffing (only the last three dechaffing units are used for the dry cherries), and then finally move to the quality grading area as
- 195. explained below. 5. Separation / quality grading: After destoning, dechaffing, and drying (as applicable), the cherries are transported to one of the two large take-way conveyors that take the cherries to the jumbo separators. Each of the two large take-way conveyors is able to process 500 barrels of cherries per hour, and is attached to twelve jumbo separators that separate the cherries into three groups – 1st quality, potential 2nd quality, and unacceptable cherries. The first quality cherries are taken to the shipping area (as explained in the next paragraph). The unacceptable cherries fall through waste chutes into water-filled waste flumes, and float off to the disposal area. The potential 2nd quality cherries fall into the Bailey mill that separate the cherries into 2nd quality cherries and unacceptable cherries. Unacceptable cherries coming out of the Bailey mill also fall through waste chutes into water-filled waste flumes, and float off to the disposal area. 6. Bulking and bagging: Five conveyors (four from the jumbo separators and one from the Bailey mill) transport separated (1st and 2nd quality) cherries to the shipping building. Each of the five conveyors can feed cherries to any of the three main flexible conveyors in the shipping area. These flexible conveyors can route the cherries to any of the five bagging stations, any of the three bulk bin stations, or to any of the six bulk truck stations. From the bulk truck stations, the cherries leave the FL-1 plant in bulk trucks for shipment directly to the finish processing plant. From the bagging stations as well as bulking stations, the cherries leave the FL-1 plant as described below: · In bins for storage at freezers with bulk bin storage capability · In bags for storage in freezers that could handle only bagged
- 196. cherries · In bins / bags for storage in freezers that could handle both bins and bags. Page 2 of 2 Untitled-11-2.pdf Untitled-11-3.pdf Untitled-11.pdf Untitled-11[1].pdf Untitled-11[2].pdf Untitled-11[3].pdf