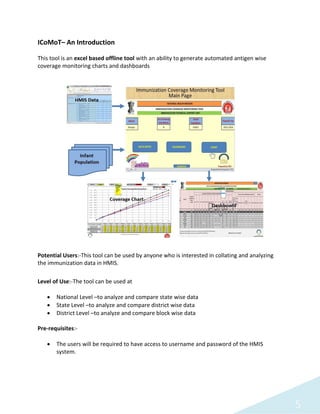
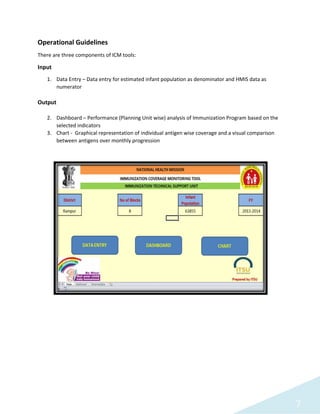
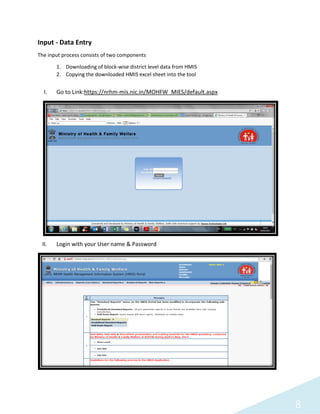
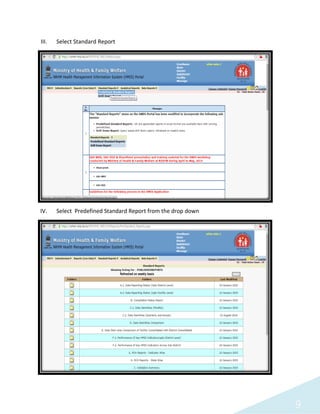
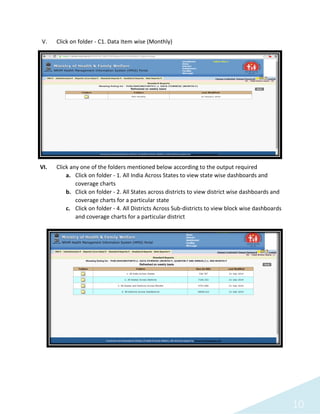
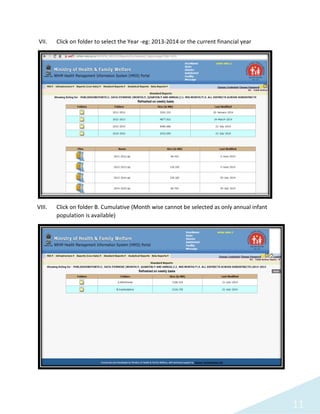
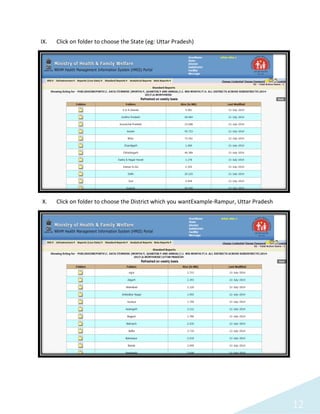
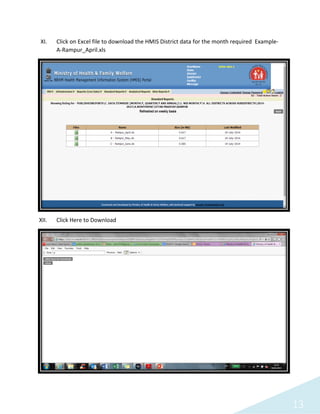
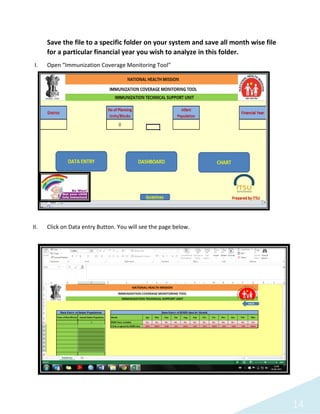
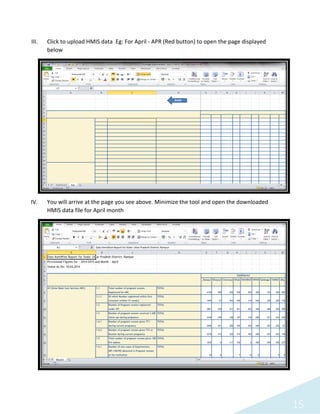
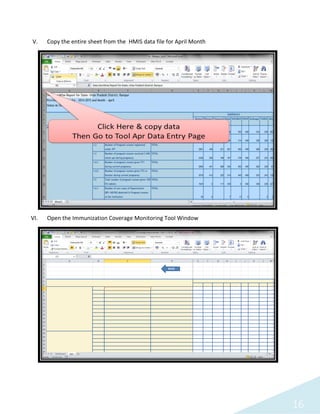
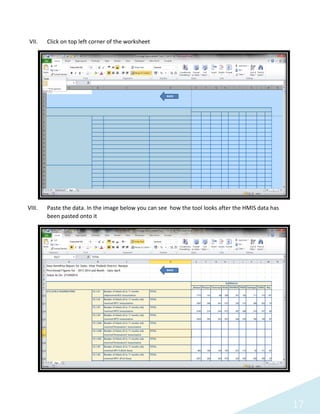
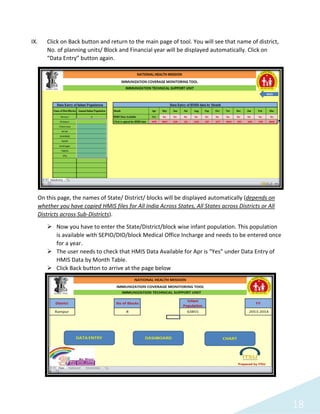
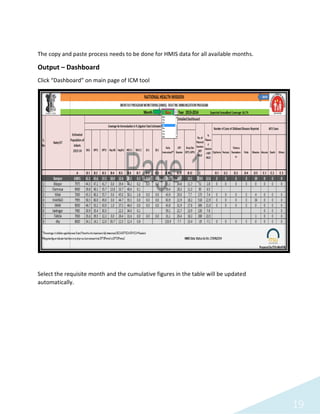
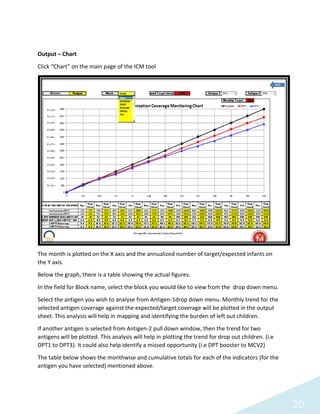
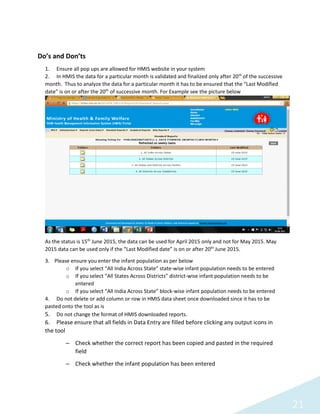
IMMUNIZATION COVERAGE MONITORING TOOL
ICoMoT
Operational Guidelines
Under guidance from
Immunization Division
Ministry of Health and Family Welfare
Government of India
2
Contents
1. Background
2. ICT Tool – An Introduction
3. Operation Guidelines
4. Do’s and Don't
3
Background
India’s Universal Immunization Program (UIP) is one of the largest in the world in terms of
quantities of vaccine used, number of beneficiaries, the number of immunization sessions
organized, the geographical spread and diversity of areas covered. A program of this scale
generates an enormous amount of data for analysis and use.
Immunization data analysis and use is necessary to achieve evidence-based policy making,
evidence-based management, and evidence-based accountability. Together with implementing
the immunization program, it is very important to formalize data management activities to
ensure that implementation problems are detected and addressed; to identify both, areas of
weak performance and specific areas where further input may be needed; and to collect
information demonstrating the success of the program.
The performance of the UIP is assessed by data related to immunization coverage not only at
national and state, but also at district, sub-district and health facility for micro level analyses and
planning.
For the successful implementation of the immunization program, it is essential for the program
manager to analyze the coverage data, reported vaccine preventable diseases (VPD) and most
importantly the dropped out and left out infants and children.
One of the major contributions of National Rural Health Mission (NRHM) has been to put in place
a nationwide Health Management Information System (HMIS). The HMIS web portal was
launched by the Ministry of Health and Family Welfare (MoHFW) on 21st October, 2008 to enable
capturing of public health data from both public and private institutions in rural and urban areas
across the country. The portal is envisaged as a “Single Window” for all public health data for the
MoHFW. The MoHFW initially rolled out the HMIS up to the District Level and it has now been
expanded to the Sub District/Block level . Over 660 Districts are reporting their monthly
performance on a regular basis.
HMIS provides the data on live birth, antigen wise coverage, fully immunization, session planned
& held and VPD cases on monthly basis in absolute numbers. These numbers are consolidation
of reported numbers under specific administrative/planning unit (state, district, sub-district, etc.)
This generates a large amount of data every month and if analyzed regularly and promptly will
give great insight into the program and its gaps and also allow for timely corrections.
With this in mind, the Child Immunization division of MoHFW and Immunization Technical
Support Unit(ITSU) envisages to develop an easy-to-use tool for the program manager at the
state, district and sub-district to monitor the coverage and other program management
components on a monthly basis.
Under the guidance of DC (Immunization), Immunization Technical Support Unit (technical
support arm of MoHFW) developed a tool- the “Immunization Coverage Monitoring (ICM) Tool”
with the following objectives:
4
 Set and evaluate monthly goals in a timely fashion
 Compare performance and coverage over different time periods,
 Monitor each vaccine and dose
 Quantify the gaps in terms of drop-out and left out children
 Accurately reflect the situation of their region
5
ICoMoT– An Introduction
This tool is an excel based offline tool with an ability to generate automated antigen wise
coverage monitoring charts and dashboards
Potential Users:-This tool can be used by anyone who is interested in collating and analyzing
the immunization data in HMIS.
Level of Use:-The tool can be used at
 National Level –to analyze and compare state wise data
 State Level –to analyze and compare district wise data
 District Level –to analyze and compare block wise data
Pre-requisites:-
 The users will be required to have access to username and password of the HMIS
system.
6
 The report (State across district HMIS /district across sub-district –cumulative)for a
particular level needs to be downloaded from the HMIS website https://nrhm-
mis.nic.in/.
 District and Sub-district level estimated population of infants is required
System Requirement
 Desk Top Computer or Laptop with basic configuration
 Microsoft Window 2003 or above
 Microsoft Office
 Internet Access to download HMIS data
7
Operational Guidelines
There are three components of ICM tools:
Input
1. Data Entry – Data entry for estimated infant population as denominator and HMIS data as
numerator
Output
2. Dashboard – Performance (Planning Unit wise) analysis of Immunization Program based on the
selected indicators
3. Chart - Graphical representation of individual antigen wise coverage and a visual comparison
between antigens over monthly progression
8
Input - Data Entry
The input process consists of two components
1. Downloading of block-wise district level data from HMIS
2. Copying the downloaded HMIS excel sheet into the tool
I. Go to Link:https://nrhm-mis.nic.in/MOHFW_MIES/default.aspx
II. Login with your User name & Password
9
III. Select Standard Report
IV. Select Predefined Standard Report from the drop down
10
V. Click on folder - C1. Data Item wise (Monthly)
VI. Click any one of the folders mentioned below according to the output required
a. Click on folder - 1. All India Across States to view state wise dashboards and
coverage charts
b. Click on folder - 2. All States across districts to view district wise dashboards and
coverage charts for a particular state
c. Click on folder - 4. All Districts Across Sub-districts to view block wise dashboards
and coverage charts for a particular district
11
VII. Click on folder to select the Year -eg: 2013-2014 or the current financial year
VIII. Click on folder B. Cumulative (Month wise cannot be selected as only annual infant
population is available)
12
IX. Click on folder to choose the State (eg: Uttar Pradesh)
X. Click on folder to choose the District which you wantExample-Rampur, Uttar Pradesh
13
XI. Click on Excel file to download the HMIS District data for the month required Example-
A-Rampur_April.xls
XII. Click Here to Download
14
Save the file to a specific folder on your system and save all month wise file
for a particular financial year you wish to analyze in this folder.
I. Open “Immunization Coverage Monitoring Tool”
Do’s and Don’t
II. Click on Data entry Button. You will see the page below.
15
III. Click to upload HMIS data Eg: For April - APR (Red button) to open the page displayed
below
IV. You will arrive at the page you see above. Minimize the tool and open the downloaded
HMIS data file for April month
16
V. Copy the entire sheet from the HMIS data file for April Month
VI. Open the Immunization Coverage Monitoring Tool Window
17
VII. Click on top left corner of the worksheet
VIII. Paste the data. In the image below you can see how the tool looks after the HMIS data has
been pasted onto it
18
IX. Click on Back button and return to the main page of tool. You will see that name of district,
No. of planning units/ Block and Financial year will be displayed automatically. Click on
“Data Entry” button again.
On this page, the names of State/ District/ blocks will be displayed automatically (depends on
whether you have copied HMIS files for All India Across States, All States across Districts or All
Districts across Sub-Districts).
 Now you have to enter the State/District/block wise infant population. This population
is available with SEPIO/DIO/block Medical Office Incharge and needs to be entered once
for a year.
 The user needs to check that HMIS Data Available for Apr is “Yes” under Data Entry of
HMIS Data by Month Table.
 Click Back button to arrive at the page below
19
The copy and paste process needs to be done for HMIS data for all available months.
Output – Dashboard
Click “Dashboard” on main page of ICM tool
Select the requisite month and the cumulative figures in the table will be updated
automatically.
20
Output – Chart
Click “Chart” on the main page of the ICM tool
The month is plotted on the X axis and the annualized number of target/expected infants on
the Y axis.
Below the graph, there is a table showing the actual figures.
In the field for Block name, select the block you would like to view from the drop down menu.
Select the antigen you wish to analyse from Antigen-1drop down menu. Monthly trend for the
selected antigen coverage against the expected/target coverage will be plotted in the output
sheet. This analysis will help in mapping and identifying the burden of left out children.
If another antigen is selected from Antigen-2 pull down window, then the trend for two
antigens will be plotted. This analysis will help in plotting the trend for drop out children. (i.e
DPT1 to DPT3). It could also help identify a missed opportunity (i.e DPT booster to MCV2)
The table below shows the monthwise and cumulative totals for each of the indicators (for the
antigen you have selected) mentioned above.
21
Do’s and Don’ts
1. Ensure all pop ups are allowed for HMIS website in your system
2. In HMIS the data for a particular month is validated and finalized only after 20th
of the successive
month. Thus to analyze the data for a particular month it has to be ensured that the “Last Modified
date” is on or after the 20th
of successive month. For Example see the picture below
As the status is 15th
June 2015, the data can be used for April 2015 only and not for May 2015. May
2015 data can be used only if the “Last Modified date” is on or after 20th
June 2015.
3. Please ensure you enter the infant population as per below
o If you select “All India Across State” state-wise infant population needs to be entered
o If you select “All States Across Districts” district-wise infant population needs to be
entered
o If you select “All India Across State” block-wise infant population needs to be entered
4. Do not delete or add column or row in HMIS data sheet once downloaded since it has to be
pasted onto the tool as is
5. Do not change the format of HMIS downloaded reports.
6. Please ensure that all fields in Data Entry are filled before clicking any output icons in
the tool
– Check whether the correct report has been copied and pasted in the required
field
– Check whether the infant population has been entered
22
If it is clicked without entering data or infant population then you will see the following
pop up:
Solution for above problem
– Click on END and then blue arrow which says BACK and enter data in the
required fields.
– After data entry click on chart - the same error will appear.
– Click on END and from the drop down list select the district/block for which chart
is required
23
Conceptualized and Developed by
For any enquires please email
vishal.agarwal@phfi.org
Under guidance from
Immunization Division
Ministry of Health and Family Welfare
Government of India

Immunization Coverage Monitoring Tool

  • 1.
    IMMUNIZATION COVERAGE MONITORINGTOOL ICoMoT Operational Guidelines Under guidance from Immunization Division Ministry of Health and Family Welfare Government of India
  • 2.
    2 Contents 1. Background 2. ICTTool – An Introduction 3. Operation Guidelines 4. Do’s and Don't
  • 3.
    3 Background India’s Universal ImmunizationProgram (UIP) is one of the largest in the world in terms of quantities of vaccine used, number of beneficiaries, the number of immunization sessions organized, the geographical spread and diversity of areas covered. A program of this scale generates an enormous amount of data for analysis and use. Immunization data analysis and use is necessary to achieve evidence-based policy making, evidence-based management, and evidence-based accountability. Together with implementing the immunization program, it is very important to formalize data management activities to ensure that implementation problems are detected and addressed; to identify both, areas of weak performance and specific areas where further input may be needed; and to collect information demonstrating the success of the program. The performance of the UIP is assessed by data related to immunization coverage not only at national and state, but also at district, sub-district and health facility for micro level analyses and planning. For the successful implementation of the immunization program, it is essential for the program manager to analyze the coverage data, reported vaccine preventable diseases (VPD) and most importantly the dropped out and left out infants and children. One of the major contributions of National Rural Health Mission (NRHM) has been to put in place a nationwide Health Management Information System (HMIS). The HMIS web portal was launched by the Ministry of Health and Family Welfare (MoHFW) on 21st October, 2008 to enable capturing of public health data from both public and private institutions in rural and urban areas across the country. The portal is envisaged as a “Single Window” for all public health data for the MoHFW. The MoHFW initially rolled out the HMIS up to the District Level and it has now been expanded to the Sub District/Block level . Over 660 Districts are reporting their monthly performance on a regular basis. HMIS provides the data on live birth, antigen wise coverage, fully immunization, session planned & held and VPD cases on monthly basis in absolute numbers. These numbers are consolidation of reported numbers under specific administrative/planning unit (state, district, sub-district, etc.) This generates a large amount of data every month and if analyzed regularly and promptly will give great insight into the program and its gaps and also allow for timely corrections. With this in mind, the Child Immunization division of MoHFW and Immunization Technical Support Unit(ITSU) envisages to develop an easy-to-use tool for the program manager at the state, district and sub-district to monitor the coverage and other program management components on a monthly basis. Under the guidance of DC (Immunization), Immunization Technical Support Unit (technical support arm of MoHFW) developed a tool- the “Immunization Coverage Monitoring (ICM) Tool” with the following objectives:
  • 4.
    4  Set andevaluate monthly goals in a timely fashion  Compare performance and coverage over different time periods,  Monitor each vaccine and dose  Quantify the gaps in terms of drop-out and left out children  Accurately reflect the situation of their region
  • 5.
    5 ICoMoT– An Introduction Thistool is an excel based offline tool with an ability to generate automated antigen wise coverage monitoring charts and dashboards Potential Users:-This tool can be used by anyone who is interested in collating and analyzing the immunization data in HMIS. Level of Use:-The tool can be used at  National Level –to analyze and compare state wise data  State Level –to analyze and compare district wise data  District Level –to analyze and compare block wise data Pre-requisites:-  The users will be required to have access to username and password of the HMIS system.
  • 6.
    6  The report(State across district HMIS /district across sub-district –cumulative)for a particular level needs to be downloaded from the HMIS website https://nrhm- mis.nic.in/.  District and Sub-district level estimated population of infants is required System Requirement  Desk Top Computer or Laptop with basic configuration  Microsoft Window 2003 or above  Microsoft Office  Internet Access to download HMIS data
  • 7.
    7 Operational Guidelines There arethree components of ICM tools: Input 1. Data Entry – Data entry for estimated infant population as denominator and HMIS data as numerator Output 2. Dashboard – Performance (Planning Unit wise) analysis of Immunization Program based on the selected indicators 3. Chart - Graphical representation of individual antigen wise coverage and a visual comparison between antigens over monthly progression
  • 8.
    8 Input - DataEntry The input process consists of two components 1. Downloading of block-wise district level data from HMIS 2. Copying the downloaded HMIS excel sheet into the tool I. Go to Link:https://nrhm-mis.nic.in/MOHFW_MIES/default.aspx II. Login with your User name & Password
  • 9.
    9 III. Select StandardReport IV. Select Predefined Standard Report from the drop down
  • 10.
    10 V. Click onfolder - C1. Data Item wise (Monthly) VI. Click any one of the folders mentioned below according to the output required a. Click on folder - 1. All India Across States to view state wise dashboards and coverage charts b. Click on folder - 2. All States across districts to view district wise dashboards and coverage charts for a particular state c. Click on folder - 4. All Districts Across Sub-districts to view block wise dashboards and coverage charts for a particular district
  • 11.
    11 VII. Click onfolder to select the Year -eg: 2013-2014 or the current financial year VIII. Click on folder B. Cumulative (Month wise cannot be selected as only annual infant population is available)
  • 12.
    12 IX. Click onfolder to choose the State (eg: Uttar Pradesh) X. Click on folder to choose the District which you wantExample-Rampur, Uttar Pradesh
  • 13.
    13 XI. Click onExcel file to download the HMIS District data for the month required Example- A-Rampur_April.xls XII. Click Here to Download
  • 14.
    14 Save the fileto a specific folder on your system and save all month wise file for a particular financial year you wish to analyze in this folder. I. Open “Immunization Coverage Monitoring Tool” Do’s and Don’t II. Click on Data entry Button. You will see the page below.
  • 15.
    15 III. Click toupload HMIS data Eg: For April - APR (Red button) to open the page displayed below IV. You will arrive at the page you see above. Minimize the tool and open the downloaded HMIS data file for April month
  • 16.
    16 V. Copy theentire sheet from the HMIS data file for April Month VI. Open the Immunization Coverage Monitoring Tool Window
  • 17.
    17 VII. Click ontop left corner of the worksheet VIII. Paste the data. In the image below you can see how the tool looks after the HMIS data has been pasted onto it
  • 18.
    18 IX. Click onBack button and return to the main page of tool. You will see that name of district, No. of planning units/ Block and Financial year will be displayed automatically. Click on “Data Entry” button again. On this page, the names of State/ District/ blocks will be displayed automatically (depends on whether you have copied HMIS files for All India Across States, All States across Districts or All Districts across Sub-Districts).  Now you have to enter the State/District/block wise infant population. This population is available with SEPIO/DIO/block Medical Office Incharge and needs to be entered once for a year.  The user needs to check that HMIS Data Available for Apr is “Yes” under Data Entry of HMIS Data by Month Table.  Click Back button to arrive at the page below
  • 19.
    19 The copy andpaste process needs to be done for HMIS data for all available months. Output – Dashboard Click “Dashboard” on main page of ICM tool Select the requisite month and the cumulative figures in the table will be updated automatically.
  • 20.
    20 Output – Chart Click“Chart” on the main page of the ICM tool The month is plotted on the X axis and the annualized number of target/expected infants on the Y axis. Below the graph, there is a table showing the actual figures. In the field for Block name, select the block you would like to view from the drop down menu. Select the antigen you wish to analyse from Antigen-1drop down menu. Monthly trend for the selected antigen coverage against the expected/target coverage will be plotted in the output sheet. This analysis will help in mapping and identifying the burden of left out children. If another antigen is selected from Antigen-2 pull down window, then the trend for two antigens will be plotted. This analysis will help in plotting the trend for drop out children. (i.e DPT1 to DPT3). It could also help identify a missed opportunity (i.e DPT booster to MCV2) The table below shows the monthwise and cumulative totals for each of the indicators (for the antigen you have selected) mentioned above.
  • 21.
    21 Do’s and Don’ts 1.Ensure all pop ups are allowed for HMIS website in your system 2. In HMIS the data for a particular month is validated and finalized only after 20th of the successive month. Thus to analyze the data for a particular month it has to be ensured that the “Last Modified date” is on or after the 20th of successive month. For Example see the picture below As the status is 15th June 2015, the data can be used for April 2015 only and not for May 2015. May 2015 data can be used only if the “Last Modified date” is on or after 20th June 2015. 3. Please ensure you enter the infant population as per below o If you select “All India Across State” state-wise infant population needs to be entered o If you select “All States Across Districts” district-wise infant population needs to be entered o If you select “All India Across State” block-wise infant population needs to be entered 4. Do not delete or add column or row in HMIS data sheet once downloaded since it has to be pasted onto the tool as is 5. Do not change the format of HMIS downloaded reports. 6. Please ensure that all fields in Data Entry are filled before clicking any output icons in the tool – Check whether the correct report has been copied and pasted in the required field – Check whether the infant population has been entered
  • 22.
    22 If it isclicked without entering data or infant population then you will see the following pop up: Solution for above problem – Click on END and then blue arrow which says BACK and enter data in the required fields. – After data entry click on chart - the same error will appear. – Click on END and from the drop down list select the district/block for which chart is required
  • 23.
    23 Conceptualized and Developedby For any enquires please email vishal.agarwal@phfi.org Under guidance from Immunization Division Ministry of Health and Family Welfare Government of India