Utilizando Proxy no Jmeter Passo a Passo
•
0 likes•718 views

Créditos documentação oficial da Apache Jmeter: jmeter.apache.org

Recommended
More Related Content
Viewers also liked
Viewers also liked (20)
Similar to Utilizando Proxy no Jmeter Passo a Passo
Similar to Utilizando Proxy no Jmeter Passo a Passo (20)
Recently uploaded
Recently uploaded (20)
Utilizando Proxy no Jmeter Passo a Passo
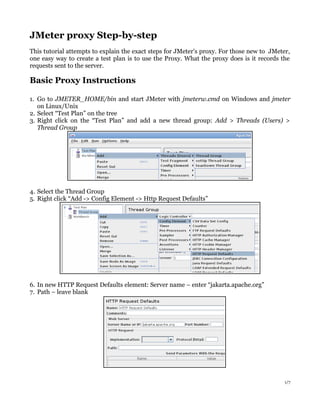
- 1. JMeter proxy Step-by-step This tutorial attempts to explain the exact steps for JMeter's proxy. For those new to JMeter, one easy way to create a test plan is to use the Proxy. What the proxy does is it records the requests sent to the server. Basic Proxy Instructions 1. Go to JMETER_HOME/bin and start JMeter with jmeterw.cmd on Windows and jmeter on Linux/Unix 2. Select “Test Plan” on the tree 3. Right click on the “Test Plan” and add a new thread group: Add > Threads (Users) > Thread Group 4. Select the Thread Group 5. Right click “Add -> Config Element -> Http Request Defaults” 6. In new HTTP Request Defaults element: Server name – enter “jakarta.apache.org” 7. Path – leave blank 1/7
- 2. 8. Right click on the “Thread Group” and add a recording controller: Add > Logic Controller > Recording Controller 9. Next, select WorkBench 10.Right click on WorkBench and add the Http proxy: Add -> Non-test elements -> Http Proxy Server 11.On HTTP Proxy Server, click the “Add” button in “URL Patterns to Include”. This will create a blank entry. 12.Enter “.*.html” 13.Click 3 times, the “Add” button in “URL Patterns to Exclude”. This will create 3 blank entries. 14.Enter “.*.png” pattern, “.*.gif” pattern and “.*.ico” pattern 2/7
- 3. 15.Right click on “HTTP Proxy Server” and add a listener: Add -> Listener -> View Results Tree 16.Return to HTTP Proxy Server, and click the “Start” button at the bottom 3/7
- 4. Configure your brower to use the JMeter HTTP Proxy At this point, JMeter's proxy is running. For this exercise, we will use Iceweasel/Firefox to view some pages on Jakarta. 13.Start Iceweasel/Firefox, but do not close Jmeter. 14.From the tool bar, click “Edit -> Preferences” (or “Tools > Preferences”). This should bring up the options. 15.Select the “Advanced” tab, and “Network” tab 16.Click “Settings” button near the bottom. 17.On the new popup, check “Manual proxy configuration”. The address and port fields should be enabled now. 18.Address – enter “localhost” or the IP address of your system 19.Port – enter “8080”. 20.Check “Use this proxy server for all protocols” 4/7
- 5. 21.Click “ok” button 22.Click “ok” button again. This should return you to the browser Record your navigation 23.With your brower, in the “Address” bar at the top, enter “http://jakarta.apache.org/jmeter/index.html” and hit the “enter” key. 24.Click on a few links on JMeter's pages. 25.Close your browser and bring up the JMeter window. Expand the thread group and there should be several samplers. At this point, the test plan can be saved as is. If you forget to add default http request settings, you will have to manually delete the servername, and port. In this sample, there aren't any default request parameters. If a particular request parameter 5/7
- 6. is required by all pages, the request defaults is where one would add the entries. 25.Select “Thread Group” 26.Right click “Add -> Listener -> Summary Report” to add an summary listener. 27.The summary listener will show some basic statistics. 27.Select “Thread Group” 28.Number of Threads – enter “5” 29.Ramp up Period – do not change 30.Loop Count – enter 100 6/7
- 7. Start the test At this point, we are ready to run our test plan and see what happens. Save the test plan. When you're ready to run the test, there's two ways: 1. Run -> Start 2. Ctrl–R Before you start the test, select “Summary Report”. As the test runs, the statistics will change until the test is done. At the end of the test, the summary report should look like this. While the test is running, in the upper right-hand corner, there should be a green square. When the test is done, the box should be grey. 7/7