
Recommended
Recommended
More Related Content
What's hot
What's hot (19)
Similar to Integrated Geophysical and Geotechnical Evaluation of Foundation Failure in Parts of Ikere-Ekiti, South Western Nigeria
Similar to Integrated Geophysical and Geotechnical Evaluation of Foundation Failure in Parts of Ikere-Ekiti, South Western Nigeria (20)
Recently uploaded
Recently uploaded (20)
Integrated Geophysical and Geotechnical Evaluation of Foundation Failure in Parts of Ikere-Ekiti, South Western Nigeria
- 1. International Journal of Engineering Science Invention ISSN (Online): 2319 – 6734, ISSN (Print): 2319 – 6726 www.ijesi.org ||Volume 6 Issue 5|| May 2017 || PP.77-83 www.ijesi.org 77 | Page Integrated Geophysical and Geotechnical Evaluation of Foundation Failure in Parts of Ikere-Ekiti, South Western Nigeria Olutomilola, O.O., *Afolabi, O.O. and Yakubu, J. Department of Geology, Afe Babalola University, Ado-Ekiti, SW Nigeria. *Corresponding author Abstract: Geophysical and geotechnical methods have been integrated with the aim of assessing characteristics of sub-surface layers to identify why structures in some parts of Ikere-Ekiti Southwestern Nigeria are failing or sinking as a result of foundation failure. Eight (8) vertical electrical sounding (VES) were carried out using resistivity meter and six (6) pits were dug to a depth of 1.2m. Six disturbed soil samples were collected from the six dug pits for the study. These samples were subjected to geotechnical tests in the laboratory, which include moisture content, shear test, Atterberg limit and grain size analysis. The acquired VES data were processed and interpreted using partial curve matching technique. The results of the all the mall the eight VES produced H curves. This curve type manifested three layers which are composed of sandy-clay, clayey- sand/weathered basement and weathered basement/rock head. The depth o rockhead ranges from 12.1 to 43.2m. VES stations four and five have deeper depth to rock head (i.e. 21.3 to 43.2m) while other locations have lesser depth to rockhead (i.e.1 12.1m to 17.5m). The second layer has the lowest resistivity values meaning that it is somewhat conductive owing to clayey sand deposition and weathered area. Geotechnical test shows that the soils in the study area generally has high moisture content, low plasticity, and from grain size distribution, high concentrations of silt and clay. From the result, it is established that the layer in which the foundations are built upon are rated as poor to fairly competent. This might be as a result of poor drainage system characterised the study area which brought about the local deposition of the supposed subsoil. Therefore, high moisture content made the subsoil to lose its competency thereby causing the structures in the study area to subside. Keynotes: geophysical, geotechnical, evaluation, Ikere-Ekiti, Foundation failure. I. Introduction The cases of building failures and consequent collapse in Nigeria have reached an alarming and lamentable stage. It is a disaster comparable to flood disaster, earthquake and plane clash considering the loss of life and destruction of property. Structural failure as well as building collapse are common phenomenon in Nigerian cities such as Lagos and Port-Harcourt (Opara, 2007)structural failure or building collapse is in respective of geology as failures have been recorded in both crystalline and sedimentary environment (Akintorinwa et al., 2010). There are three basic things that are paramount to human existence in life of which shelter a place to lay our head is one of these fundamental things. Out of all the necessities, this report will be emphasizing on shelter, construction of buildings to be precise and the soils as to which they are built upon. Buildings are built upon foundations, therefore foundations are parts of structures, which is in direct contact with the ground and its primary aim is to transmit and spread the loads (dead and live) from the building over an underlying soil. A good foundation should satisfy the following requirements: It shall safely sustain and transmit to the loads (dead, live and wind) in such a way as not to cause any settlement or other movement which would impair stability or cause damage to the whole or any part of the buildings or both. It shall be taken down to such a depth or be so constructed as safeguard the building from swelling, shrinking or freezing of the subsoil. The materials used must be capable of adequately resisting any attack by sulphates or any other deteriorating matter and chemicals present in the subsoil (Akanmu, 2013).The design of foundations generally requires the knowledge of such factors as:The load that will be transmitted by the structure to the foundation system; the requirements of the local building code; the behaviour and stress-related deformability of soils that will support the foundation system and the geological and mineralogical conditions of the soil under consideration. II. Study Area Thestudy was carried out in parts of Ikere-Ekiti, SW Nigeria. Essentially the target was focused on where about eight buildings wee subsiding. The field work involved geophysical and geotechnical survey to characterise the sub-surface of the affectedparts of the study area, therefore this entailed detailed verticalelectrical soundings pitting and sampling within the vicinity of the study areas, determination of
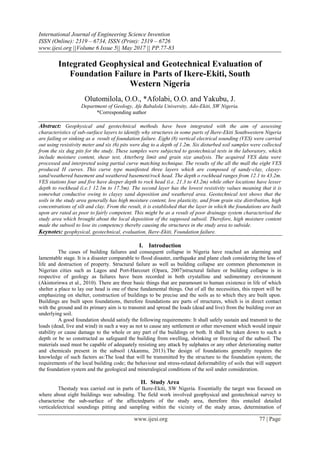
- 2. Integrated Geophysical and Geotechnical Evaluation of Foundation Failure in Parts of Ikere-Ekiti, .. www.ijesi.org 78 | Page coordinates of the area and the depth to bedrock. The study area lies between latitudes 70 30’ N to 70 35’N and longitudes 50 10’E to 50 15’E respectively covering a total area of 25km2 . It is also situated between Ado-Ekiti (the state capital of Ekiti State) and Akure (the capital of Ondo State), and the nearest gateway to Ekiti state. The study area is generally accessible through good networks of all seasonal roads and motor-able tracks which link it with neighbouring towns and all parts of the country, (Fig. 1). The relief of the study area is rugged with undulating areas and granitic outcrops in several places. Most of these hills are well over 250m above sea level. Drainage in the study area is mainly dendritic with direction of the river flowing southwards (Fig. 1). The study area conform with the two main season that is existing in Nigeria, that is the tropical climate marked by rainy season which starts from late march to October and dry season which commences from November to march. It has a warm climate with annual temperature ranging from 280 to 300 ; a mean annual rainfall of 1500mm and high relative humidity of about 75%(Federal Survey, 1978). The vegetation is dense and made up of broad- leaved trees that are mostly evergreen although prolong human activities have affected areas. Ikere and its environs are dominated by crystalline rocks which are composed of migmatite-gneiss quartzite complex, charnockites and fine to medium grained granites (Fig.2). In the study area, there is a close association between the charnokitic rocks and charnokitic granite rocks due to their field relations as documented in the basement complex rocks of Nigeria (Olarewaju, 1988; Hubbard, 1968; Cooray, 1972; Rahaman, 1976). Figure 1: Road network and Drainage systems of the study area Figure 2: Cross section of study area (Talabi and Tijani, 2011)
- 3. Integrated Geophysical and Geotechnical Evaluation of Foundation Failure in Parts of Ikere-Ekiti, .. www.ijesi.org 79 | Page III. Materials and Methods Eight Vertical Electrical Sounding points were located strategically to cover the study area. Six dug pits were also occupied very close to size of the VES points. Eight Vertical Electrical Soundings were carried out using schlumberger configuration. The satellite or aerial photograph showing VES and borehole stations (Fig. 3) Samples were collected manually from the dug pits at depth 1.2m. This involved electrical resistivity method using schlumberger array. Eight (8) Vertical Electrical Sounding (VES) stations were occupied along the study area. The eight soundings were carried out using the Schlumberger configuration. The electrode spacing (AB/2) was varied from 1m to 100m on the average. The co-ordinate of each of the sounding points was recorded using “GARMIN 12” channel personnel navigation geographic position system (GPS) unit. The apparent resistivity values were plotted against electrode spacing (AB/2) on a bi-logarithmic graph sheet to generate depth-sounding curves. The field curves were then inspected visually for identification of the curve type. Partial curve matching was carried out on the field curves. The interpretation results (layer resistivity and thicknesses) were fed into computer for 1-D computer assisted interpretation involving Resist version 1.0 software (Velper, 1988). The final interpreted results were used for the generation of geo-electric sections Figure 3: Generated Base map of the study area showing VES and borehole stations Also six (6) disturbed soil samples were collected at different locations at a depth not exceeding 1.2m within the site as shown in fig. 3.These samples were preserved in polythene bags and transported to the laboratory for various geotechnical tests. The tests include natural moisture content, grain size analysis, liquid limit, plastic limit, linear shrinkage and compaction test. IV. Results and Discussion Both geophysical and geotechnical analysis were carried out at the site of study to give information on the reasons for the failed foundations. The results of the geophysical survey carried out at the study area is presented as sounding curves, tables, and geo-electric sections while that of geotechnical survey carried out as plastic limit, liquid limit etc. are represented as graphs and tables. Geophysical Results The eight (8) vertical electrical sounding (VES) curves are identified as H-curve types (Table 1). This curve type is of three layers. The H-curve is mostly water saturated and characterised by low resistivity, high porosity, low specific yield and low permeability (Jones, 1985; Olayinka and Olorunfemi, 1992). The depth to bedrock in most of the locations varied significantly. The depth to weathered basement/rock head ranges from 12.1m – 43.2m as can be observed in VES 6 and VES 4 respectively.
- 4. Integrated Geophysical and Geotechnical Evaluation of Foundation Failure in Parts of Ikere-Ekiti, .. www.ijesi.org 80 | Page Table 1: Summary of Interpretation Results VES station Depth (m) d1/d2…dn-1 Resistivity (Ωm) Ω1/ Ω2… Ωn curve types 1 2.0/ 17.5 44.3/ 7.0/ 171.3 H 2 2.1/ 12.7 34.3/ 4.6/ 357.5 H 3 1.2/ 14.7 35.1/ 7.5/ 153.5 H 4 1.6/ 43.2 23.4/ 10.7/ 53.9 H 5 0.3/ 21.3 42.0/ 13.6/ 117.1 H 6 0.3/ 12.1 30.2/ 9.2/ 48.0 H 7 1.0/ 15.1 74.1/ 12.3/ 140.1 H 8 1.0/ 14.4 59.4/ 12.5/ 93.7 H Geo-electric section along the study area Eight(8) VES stations (VES 1to 8) were located at the site of study. The topsoil has resistivity values ranging from 23.4Ωm to 74.1Ωm in VES 4 and 7 respectively as shown in Table 1, indicating that sandy clay constitutes the topsoil. Its thickness varies from 0.3m (VES 5 and 6) to 2.1m (VES2). The second layer resistivity value ranges from 4.6Ωm in VES 2 to 13.6Ωm in VES 5. This layer is presumably the clayey sand/ weathered basement (Figs. 4 - 6). The thickness ranges from 10.6m (VES2) to 41.6m (VES4).Resistivity of the third layer ranges from 48.0Ωm (VES 6) to357.5Ωm (VES2) and constitutes the weathered basement/ rock head. The depth to rock head ranges from 12.1m (VES6) to 43.2m (VES4). Figure 4: Geoelectric section showing VES 1, 2 and 3 Figure 5: Geoelectric sectionshowing stations 8 and 4
- 5. Integrated Geophysical and Geotechnical Evaluation of Foundation Failure in Parts of Ikere-Ekiti, .. www.ijesi.org 81 | Page Figure 6: Geoelectric section of station 7 and 8 Geotechnical Results Table 2 shows the summary of the geotechnical results. The natural moisture content of tested soil samples ranges 9.35% to78.5%, which are very large extremes. This shows variability in soil texture. Location 6 that has the least moisture content is closer to areas where the buildings are stable/street road and it is at higher elevation. Location 2 that has the highest moisture content was the one that we encountered water at almost a depth of 1.2m. Moisture variation is generally determined by intensity of rain, depth of collection of sample and the texture of the soil (Jegede, 2000). From the grain size analysis, the soils can be classified as not well graded. The tested soils have percentage finer (0.075mm), ranged from 32.5% (location 1) to 80% (location 4) while the remaining fines were subjected to hydrometer analysis. Most of the soil samples tested have percentage values more than the maximum recommended 35% by the FMWH (1972) for foundation materials. Hence, the soils can be generally rated as poor to fair subgrade foundation materials. The soils that are largely made up of fine particles are likely to have poor geotechnical properties as foundation materials than soils that are largely made up of coarse particles, (Akintorinwa and Adeusi, 2009). Table 2 shows the result of the Atterberg limits. From the table, liquid limit ranged from 15.2%- 45.8%, the plastic limit ranged from 12.2% - 39.3% while the plastic index of soils ranged from 1.5 -33.6%. According to Akintorinwa and Adeusi (2009), soil having high values of liquid and plastic limits is considered to be poor foundation materials. The plastic index of location 5 (33.6%) is higher than 20% maximum value recommended by Federal ministry of works and housing (FMWH), 1972. The shrinkage limit of the tested soil ranged from 2.14% to 7.14% (Table 2). Brink et al. (1992) suggested that soils with linear shrinkage limit below 8% would be inactive, inexpensive and not good as foundation materials. As the normal stress on the soil samples increases, so does the shear stress. The average bulk density ranged from 1.48g/cm3 to 1.89g/cm3 .The angle of friction ranged from 450 – 83.50 . Brajas (2011) stated that the angle of friction for sand ranged from 260 – 450 which increases with the relative density of compaction. The mixture of clay and sand in the soil samples could have caused the increase in angle of friction. Shear strength of the samples ranged from 21.25 to 399.00. Locations 2 and 3 have the highest shear strength (243.5-399.0) while location 5 has the lowest shear strength (21.25, 31.00 and 49.00). High shear strength has the ability to cause foundation failure leading to subsidence. Hence this could have been the reason for building subsidence in the study areas. Comparing the geophysical and the geotechnical data generated from each dug-hole revealed that the topsoil is made up of clayey and sandy materials while the subsoil comprises mainly of clayey sand (Table 3).
- 6. Integrated Geophysical and Geotechnical Evaluation of Foundation Failure in Parts of Ikere-Ekiti, .. www.ijesi.org 82 | Page Table 2: Summary of the Results of Geotechnical Investigation of the Study Area Table 3: Comparing the Results of Vertical Electrical Sounding with the Geotechnical Results Name of VES Number of Dug Hole Geophysical Result Geotechnical Result VES 1 DH 1(beside VES 1). The sample was taken at depth of 1.2m. From the 0m to2.0m, the topsoil resistivity value is 44.3 Ω-m. It is classified as sandy clay. The resistivity is low, that is, the layer is conductive. The percentage finer passing through 0.075mm sieve (32.5%) indicated the presence of clay and sand. The moisture content is 19.5%. The liquid limit is 32.5%. The plastic limit is 13.0%. The shrinkage limit is 2.86%. The plastic index is 19.0% while the effective shear angle of friction is 77.00 . VES 3 DH 2(beside VES 3). The sample was taken at depth of 1.2m. Between 0 to 1.2m, the topsoil has resistivity value of 35.1Ω-m. The layer resistivity value is low and it shows this layer is conductive due its water content. The percentage finer passing through 0.075mm sieve (44.5%) indicated the presence of clay and sand. The moisture content is 78.5%. The liquid limit is 18.7%. The plastic limit is 16.3%. The shrinkage limit is 4.29%. The plastic index is 2.4%. Effective shear angle of friction is 83.50 . VES 5/6 DH 4(It is in between VES 5 and VES6). The sample was taken at depth of 1.2m. From 0m to 0.3m, the resistivity value ranges from 30.2 Ω-m (VES 6) to 42.0 Ω-m (VES5). The layer below has lower resistivity value which ranged from 9.2 Ω-m to 13.6 Ω-m indicating that it has higher moisture content. The percentage finer passing through 0.075mm sieve (80.0%), it is indicating the presence of clay and sand. The moisture content is50.0%. The liquid limit is 40.8%. The plastic limit is 39.3%. The shrinkage limit is 7.14%. The plastic index is 1.5%. The effective shear angle of friction is 61.60 . VES 7 DH 6(beside VES 7). The sample was taken at depth of 1.2m. From the ground surface to a depth of 1.0m, the resistivity value is 74.1Ω-m. This resistivity value is the highest of all the VES points. The location is at higher elevation compared to others. Although the layer below is more conductive. The percentage finer passing through 0.075mm sieve (41.0%). This indicates the presence of clay and sand. The moisture content is 9.4% as this location is of higher elevation compare to others. The liquid limit is 22.5%. The plastic limit is 17.2%. The shrinkage limit is 5.00%. The plastic index is 5.3% while the effective shear angle of friction is 69.90 . Subsurface Engineering Evaluation of the Study Area The depth to the weathered basement or rock head varies from 2.1m – 43.2m (Fig. 4-6). This depth could also be considered as over burden thickness. The geologic sequence within the study area is composed of the subsoil (sandy clay and clayey-sand) and weathered basement / rock head. The subsoil constitutes the layer within which normal civil engineering foundation should be founded. This layer is composed of sandy clay and clayey-sand. Engineering competence of the subsoil can be qualitatively evaluated from layer resistivity and geotechnical parameter. The higher the layer resistivity value, the higher the competence of a layer. From the geoelectric sections observed, the weathered basement or rockhead is the most competent of the layer delineated. This is followed by the sandy-clay while the clayey-sand is the least competent. The higher the geotechnical parameter of the soil, the lesser is the competence of the soil as foundation material. The federal ministry of woks and housing, 1972 recommended 35%, 50%, 30% and 20% maximum for percentage finer, liquid limit, plastic limit and plastic index respectively and also 8% minimum of linear shrinkage for a good foundation material. The geotechnical properties of the top soil are rated from poor to fair as more than half of the samples taken within the top soil could not meet up the requirement of FMWH, (1972). In the site of study about 12 buildings can be located in which nearly all experience partial subsidence, five (5) of the buildings have been abandoned. There is a 2-storey building present there, but the ground floor has been evacuated.
- 7. Integrated Geophysical and Geotechnical Evaluation of Foundation Failure in Parts of Ikere-Ekiti, .. www.ijesi.org 83 | Page V. Conclusio n Eight (8) vertical electrical sounding (VES) were carried out using the tetrameter and six (6) pits were hand dug to a depth of 1.2m. Six (6) disturbed samples were collected from six hand dug pits in the study area. These samples were further subjected to geotechnical tests in the laboratory which included the moisture content, shear test, Atterberg’s limits and grain size analysis.The geophysical results revealed three (3) geoelectric sequences in the study area, which comprises of sandy-clay as top soil, clayey-sand as subsoil, and weathered basement/ rock head. The overburden is generally thick and mainly composed of sandy clay and clayey sand. The low resistivity recorded in the clayey sand section (second layer) may be due to its moisture content as it has high water retaining capacity. The geo-electric sections depict depth of rock head to be between 12.1m and 43. 2m. The geotechnical results showed that the soil has fairly high natural moisture content while the clay content is high as revealed by the percentage fines was generally greater than 35%. The plasticity index of dug hole 5 is greater than 20% while others are moderate. The deduction from the investigation is that the sub-soil formation is not adequate to act as foundation materials. References [1]. Akintorinwa, O.J. and Adeusi, F.A.(2009): Integration of geophysical and geotechnical investigation for a proposed lecture room complex at the Federal University of Technology, Akure, Southwesstern Nigeria. Journal of Applied of Science 2(3); pp 241 - 254. [2]. Akintorinwa, O.J. , Ojo, J.S. and Olorunfemi, M.O. (2010): Geophysical Investigation of pavement failure in a basement complex terrain of south western Nigeria. The Pacific Journal of Science and Technology Vol.11(2); pp 649 - 663. [3]. Burke K.C and Dewey F.J (1971): Orogeny in African Geology (T.F.J. Dessauvagie and A.J Whiteman Eds) Univ. of Ibadan Press, Nigeria. [4]. Brink, A.B., Parridge, J.C and Williams, A.A. B. (1992): Soils survey for Engineering, Claredon, Oxford? [5]. Das Braja M (2007): Principles of foundation engineering: Adapted international student edition. Elizabethan Pub. Co. pp 15 – 39. [6]. Federal Survey of Nigeria (1978): Atlas of Federal Republic of Nigeria, First Ed Federal surveys: Lagos, Nigeria; 136p. [7]. Rahaman, M.A. (1976): Review of the basement geology of south-western Nig. In. C.A. Kogbe (ed.) Geology of Nigeria. Elizabethan Pub. Co. Lagos. 41 – 58.