Geophysical Investigation of Groundwater Potential in Ahmadu Bello University...
Gh2511431153
1. Fadele, Jatau, Patrick / International Journal of Engineering Research and Applications
(IJERA) ISSN: 2248-9622 www.ijera.com
Vol. 2, Issue 5, September- October 2012, pp.1143-1153
Geophysical Engineering Investigation Around Makiyaye Village,
Shika Area Within The Basement Complex Of North-Western
Nigeria.
FADELE S.I, JATAU B.S AND PATRICK N.O
Nasarawa State University, Keffi, Nigeria
Abstract
Geophysical investigation for engineering studies as septic tanks and sewage channels are planned
was carried out around Makiyaye village which for the area under study.
falls within the Basement Complex of North-
Western Nigeria. The study is aimed at (Key words: VES, Top soil, Weathered Basement,
evaluating the competence of the near surface Partly weathered or Fractured Basement, Fresh
formation as foundation materials, and to Basement)
unravel the subsurface profile which in turn
determines if there would be any subsurface I. Introduction
lithological variation(s) that might lead to The failure statistic of structures such as
structural failure at the site and evaluating the buildings, tarred roads and bridges throughout the
groundwater potential of the site and nation is increasing geometrically. Most of these
determining the level of safety of the failures were caused by swelling clays (Blyth and
hydrogeologic system. Vertical Electrical Freitas, 1988). In recent times, the collapse of civil
Sounding (VES) using Schlumberger array was engineering structures has been on the increase for
carried out at eighteen (18) VES stations. ABEM reasons associated with subsurface geological
terrameter (SAS 300) was used for the data sequence (Omoyoloye et al., 2008). The need for
acquisition. The field data obtained have been subsurface geophysical investigation has therefore
analysed using computer software (IPI2win) become very imperative so as to prevent loss of
which gives an automatic interpretation of the valuable properties and lives that always accompany
apparent resistivity. The geoelectric section such a failure. Foundation evaluation of a new site is
revealed three to four lithologic units defined by necessary so as to provide subsurface and aerial
the topsoil, which comprises clayey-sandy and information that normally assist civil engineers,
sandy lateritic hard pan; the weathered builders and town planners in the design and siting
basement; partly weathered/fractured basement of foundations of civil engineering structures
and the fresh basement. The resistivity values (Omoyoloye, et al., 2008). Geophysical methods
range from 28 - 354Ωm in the topsoil, 70 - such as the Electrical Resistivity (ER), Seismic
356Ωm in the weathered basement, 245 - 694Ωm refraction, Electromagnetic (EM), Magnetic and
in the fractured basement and 1114 - 3699Ωm in Ground Penetrating Radar (GPR) are used singly or
the fresh basement . Layer thicknesses vary from in combinations for engineering site investigations.
0.38 – 2.64m in the topsoil, 0.7 – 37.36m in the The applications of such geophysical investigation
weathered layer, 5.86 – 34.2m in the fractured are used for the determination of depth to bedrock,
basement. Depth from the surface to structural mapping and evaluation of subsoil
bedrock/fresh basement generally varied competence (Burland, J.B and Burbidge, M.C
between 2.64 and 44.11m. Based on the resistivity 1981). The engineering geophysical investigation
values, it is concluded that the subsurface was carried out around Makiyaye village, Zaria,
material up to the depth greater than 20m is Kaduna State, North-Western Nigeria, aimed at
competent and has high load-bearing capacity. determining the depth to the competent stratum in
However, resistivity values less than 100Ωm at the subsurface, delineation of areas that are prone to
depths of 10 - 15m indicate high porosity, high subsidence or some form of instability, evaluating
clayey sand content and high degree of saturation the groundwater potential of the site and
which are indications of soil conditions requiring determining the level of safety of the hydrogeologic
serious consideration in the design of massive system in the study area.
engineering structures. The hydrogeologic system
at the site is vulnerable to contamination. Hence, II. Location and Topography of the
the result reasonably provide a basis for which
Study area
groundwater potential zones are appraised for
The study area lies between Latitudes 110
safety in case potential sources of groundwater
10’ 09”N - 110 11’00’’N and Longitudes 70
contamination sites such
1143 | P a g e
2. Fadele, Jatau, Patrick / International Journal of Engineering Research and Applications
(IJERA) ISSN: 2248-9622 www.ijera.com
Vol. 2, Issue 5, September- October 2012, pp.1143-1153
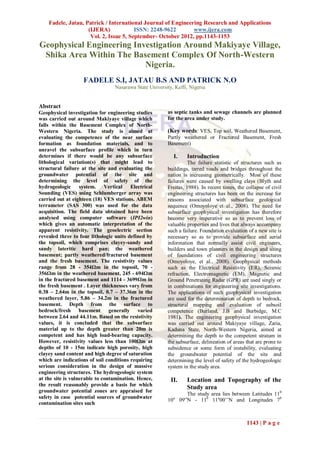
35’50”E - 70 38’ 40” E. The site is situated along northwest trend. They have a pronounced effect on
the Sokoto road, North West of Zaria (Fig. 1). The the drainage pattern of the state.
topography is that of high plain (flat terrain) of
Hausa land. The site is located within the tropical IV. Methodology
climatic belt with Sudan Savannah vegetation. The Vertical Electrical Soundings (VES) using
environment is Savannah type with distinct wet and Schlumberger array were carried out at eighteen
dry season. The rainfall regime is simple but with (18) stations. A regular direction of N-S azimuth
slight variation which consists of wet season lasting was maintained in the orientation of the profiles.
from May to September and characterized by heavy Overburden in the basement area is not as thick as to
down pour at the start and end of the rainy season. warrant large current electrode spacing for deeper
The annual rainfall varies between 800 mm to 1090 penetration (Oseji, et al., 2005; Okolie, et al., 2005),
mm while the mean annual temperature ranges therefore the largest Current electrode spacing AB
between 240C to 310C reaching a maximum of about used was 200m, that is, 1/2AB=100m. The
360C around April (Hore,1970; Goh Cheng Leong principal instrument used for this survey is the
and Adeleke, 1978). ABEM (Signal Averaging System, (SAS 300)
Terrameter. The resistance readings at every VES
III. Geology of Study Area point were automatically displayed on the digital
The study area is laid on undifferentiated readout screen and then written down on paper.
basement. Though there were no rock out-crops
within the site, observation however revealed that V. Results and Discussion
the weathered bedrock in some existing hand-dug The geometric factor, K, was first
wells within the site and environs indicates the calculated for all the electrode spacings using the
occurrence of granitic rocks within the site which formula; K= π (L2/2b – b/2), for Schlumberger array
are porphiritic in texture. The study area falls within with MN=2b and 1/2AB=L. The values obtained,
the Metasediments of the Basement Complex were then multiplied with the resistance values to
(McCurry, 1970). The Basement Complex in obtain the apparent resistivity, ρa, values. Then the
Kaduna state was affected by an Orogeny, which apparent resistivity, ρa, values were plotted against
predated the emplacement of the Older Granite. the electrode spacings (1/2AB) on a log-log scale to
During this event, deformation of the basement obtain the VES sounding curves using an
produced north-south trending basins of appropriate computer software IPI2win in the
Metasediment in the form of Synclinoria. Tertiary present study. Some sounding
earth movements tilted the Metasediments to north
and warped the basement along the axis of the uplift
pass through the present Kaduna state having
1144 | P a g e
3. Fadele, Jatau, Patrick / International Journal of Engineering Research and Applications
(IJERA) ISSN: 2248-9622 www.ijera.com
Vol. 2, Issue 5, September- October 2012, pp.1143-1153
Study Area
Figure 1: Location Map Showing the Study Area (From Northern Nigerian Survey Map)
1145 | P a g e
4. Fadele, Jatau, Patrick / International Journal of Engineering Research and Applications
(IJERA) ISSN: 2248-9622 www.ijera.com
Vol. 2, Issue 5, September- October 2012, pp.1143-1153
curves and their models are shown in Fig 2. structural features have some geological, physical
Similarly, geoelectric sections are shown in Figs. 3 and near-surface engineering significance.
and 4.Three resistivity sounding curve types were
obtained from the studied area and these are the H Profile A-A’
(ρ1>ρ2<ρ3), A (ρ1< ρ2<ρ3) and KH (ρ1>ρ2< ρ3>ρ4) Profile A-A’ geoelectric section suggests
type curves. The results of the interpreted VES that the site is characterized by lateritic hard pan at
curves are shown in Table 1 and 2. The modeling different consolidation levels within shallow
of the VES measurements carried out at eighteen depths, while gneiss and granites mainly,
(18) stations has been used to derive the geoelectric characterize the basements. The fresh basements
sections for the various profiles (Figs. 4 and 5). have synclinal structure which cut across the
These have revealed that there are mostly four and profile (fig. 4). The weathered/fractured basements
three geologic layers beneath each VES station. have sharp dipping layers along VES 5, 6, 7 and 8.
The geologic sequence beneath the study area is The probable feature that may cause building
composed of top soil, weathered basement, partly failure could be geologic feature like dipping
weathered/fractured basement, and fresh basement. bedrock or synclinal structure. This is because
The topsoil is composed of clayey-sandy and while overburden materials fill the synclinal
sandy-lateritic hard crust with resistivity values structure, their columns undergo ground movement
ranging from 28Ωm to 354Ωm and thickness by subsidence and thereby could amount to uneven
varying from 0.38m to 2.64m, thinnest at VES 12 settlement at the foundation depths of buildings. In
and thickest at VES 6, 11 and 14. It is however, other words, uneven stress distribution may occur
observed from the geoelectric sections that VES 2, at the foundation depths of subsurface, that is one
3, 4, 9, 10, 11, 12, 13, 14 and 15 are characterized side of building structure may have a stronger
with low resistivity values varying between 26Ωm support than the other adjacent of it. Another
to 53Ωm suggesting the clayey nature of the topsoil factor that could contribute to structural defect of
in these areas and possibly high moisture content. building is the seasonal variation in the saturation
The second layer is the weathered basement with of clay which causes ground movement and is
resistivity values varying from 70Ωm to 356Ωm caused by clay swells and shrinkages which are
and thickness ranges between 0.7m to 37.36m, occasioned by alternate wet and dry seasons. The
thinnest at VES 1and thickest at VES 6. The third area is characterized by clay soils with lateritic
layer is the partly weathered and fractured patches at shallow depths with their thickness
basement with resistivity and thickness values ranging between 1.37m and 2.64m, which are
varying between 245Ωm to 694Ωm and 5.86m to considerably thin and are resting on the shallow
34.2m respectively. The layer is extensive and weathered/fractured basement.
thickest at VES 18 and thinnest at VES 16. The
fourth layer is presumably fresh basement whose
resistivity values vary from 1114Ωm to 3699Ωm
with an infinite depth. Though the thickness of the
bedrock is assumed to be infinite, the depth from
the earth’s surface to the bedrock surface varies
between 2.64m to 44.11m. Quite a few of the
profiles dipping and a negligible number of them
show synclinal and fractured structure. These
1146 | P a g e
5. Fadele, Jatau, Patrick / International Journal of Engineering Research and Applications
(IJERA) ISSN: 2248-9622 www.ijera.com
Vol. 2, Issue 5, September- October 2012, pp.1143-1153
Table 1: The results of the interpreted VEScurves
VES Thickness (m) Layer resistivity Remarks Curve types Numb of layers
Stations (Ωm)
1.23 152 TP
1 0.70 113 WB KH 4
9.69 426 PWB
- 1329 FB
2.29 45 TP
2 12.2 171 WB A 3
- 1765 FB
3 1.71 48 TP 3
11.2 298 WB A
- 1198 FB
1.13 48 TP
4 5.96 326 WB KH 4
11.6 433 PWB
- 2112 FB
1.23 196 TB
5 0.78 152 WB KH 4
10.2 245 PWB
- 1960 FB
2.64 256 TP
6 37.36 114 WB H 3
- 1450 FB
1.87 249 TP
7 12.1 169 WB H 3
- 1365 FB
1.37 154 TP
8 2.14 199 WB KH 4
15.2 565 PWB
- 1289 FB
2.09 53 TP
9 7.82 70 WB KH 4
34.2 450 PWB
- 1114 FB
1.13 26 TP
10 2.33 316 WB A 3
- 1251 FB
2.64 28 TB
11 8.84 162 WB A 3
- 1410 FB
0.38 27 TP
12 5.10 162 WB A 3
- 3600 FB
1147 | P a g e
6. Fadele, Jatau, Patrick / International Journal of Engineering Research and Applications
(IJERA) ISSN: 2248-9622 www.ijera.com
Vol. 2, Issue 5, September- October 2012, pp.1143-1153
Table 2: The results of the interpreted VES curves
VES Thickness (m) Layer resistivity Remarks Curve types Numb of layers
Stations (Ωm)
Apparent resistivity (Ωm)
Where,
N is the number of layers,
ρ is the apperent resistivity,
h is the thickness and
d is the depth to interface of
each layer.
Electrode spacing (m)
(a) TYPE KH CURVE
1148 | P a g e
7. Fadele, Jatau, Patrick / International Journal of Engineering Research and Applications
(IJERA) ISSN: 2248-9622 www.ijera.com
Vol. 2, Issue 5, September- October 2012, pp.1143-1153
Apparent resistivity (Ωm)
Where,
N is the number of layers,
ρ is the apperent resistivity,
h is the thickness and
d is the depth to interface of
each layer.
Electrode spacing (m)
(b) TYPE A CURVE
Apparent resistivity (Ωm)
Where,
N is the layer number,
ρ is the apperent resistivity
in ohm-metre,
h is the layer thickness and
d is the depth to interface of
each layer
Electrode spacing (m)
(c) TYPE A CURVE
Figure 2: Typical curve types and models obtained from the study area.
1149 | P a g e
8. Fadele, Jatau, Patrick / International Journal of Engineering Research and Applications
(IJERA) ISSN: 2248-9622 www.ijera.com
Vol. 2, Issue 5, September- October 2012, pp.1143-1153
VES 1 VES 2 VES 3 VES 4 VES 5 VES 6 VES 7 VES 8 VES 9
A
1A
52𝜴𝒎
2A 3A
𝟒𝟖𝜴𝒎
4A
𝟒𝟖𝜴𝒎
5A
𝟏𝟗𝟔𝜴𝒎
6A
𝟐𝟓𝟕𝜴𝒎
7A
𝟐𝟒𝟗𝜴𝒎
8A
𝟏𝟓𝟒𝜴𝒎
9A
𝟓𝟎𝜴𝒎
A’
𝟒𝟓𝜴𝒎
113 𝜴𝒎
𝟏𝟓𝟐𝜴𝒎
𝟏𝟗𝟗𝜴𝒎
𝟐𝟎𝜴𝒎
326𝛺𝑚
𝟏𝟕𝟏𝜴𝒎 𝟐𝟗𝟖𝜴𝒎
10 426 𝜴𝒎 𝟏𝟔𝟗𝜴𝒎
𝟐𝟒𝟓𝜴𝒎 𝟏𝟏𝟒𝜴𝒎
𝟏𝟓𝟐𝜴𝒎
𝟒𝟑𝟑𝜴𝒎
𝟏𝟓𝟑𝜴𝒎
𝟐𝟔𝟒𝟑 𝜴𝒎
𝟏𝟑𝟎𝟗 𝜴𝒎
DEPTH (m)
20 𝟏𝟏𝟔𝟓 𝜴𝒎
𝟏𝟗𝟔𝟎 𝜴𝒎
𝟏𝟑𝟎𝟗𝜴𝒎
𝟐𝟏𝟏𝟐 𝜴𝒎 𝟏𝟐𝟖𝟗𝜴𝒎
30
𝟏𝟏𝟒𝟒𝜴𝒎
40
𝟏𝟒𝟏𝟎 𝜴𝒎
Clay/clayey sandy (Top soil) Lateritic hard pan (Top soil)
Weathered layer Partly weathered/fractured layer
Fresh basement
Figure 3: Geoelectric section along profiles A-Ai
1150 | P a g e
9. Fadele, Jatau, Patrick / International Journal of Engineering Research and Applications
(IJERA) ISSN: 2248-9622 www.ijera.com
Vol. 2, Issue 5, September- October 2012, pp.1143-1153
VES 10 VES 11 VES 12 VES 13 VES 14 VES 15 VES 16 VES 17 VES 18
1D 3D 4D 5D 6D 7D 8D 9D B’
B 26 𝜴𝒎 28 𝜴𝒎
30 𝜴𝒎 254 𝜴𝒎
281 𝜴𝒎 256 𝜴𝒎
28 𝜴𝒎 30 𝜴𝒎
316 𝜴𝒎 347 𝜴𝒎 358 𝜴𝒎
356 𝜴𝒎
261 𝜴𝒎
162 𝜴𝒎 199 𝜴𝒎
519 𝜴𝒎
694 𝜴𝒎
302 𝜴𝒎 3699 𝜴𝒎 2593 𝜴𝒎
3307 𝜴𝒎
1270 𝜴𝒎
2935 𝜴𝒎
10
1519 𝜴𝒎 658 𝜴𝒎
1410 𝜴𝒎
DEPTH (m)
20
30
1614 𝜴𝒎
40 Clay/clayey sandy (Top soil) Lateritic hard pan (Top soil)
3511 𝜴𝒎
Weathered layer Partly weathered/fractured layer
Fresh basement
Figure 4: Geoelectric section along profiles B-Bi
Profile B-B’ Competence Evaluation
The geoelectric section revealed clayey There are no indications of any major
sandy topsoil having some lateritic hard crust linear structure such as fracture or faults that could
patches (fig. 5). The synclinal structure at VES aid building subsidence. The geologic sequence
point 11 is not well pronounced and may not pose beneath the area is composed of thin layer of
any serious danger to building foundation. topsoil, thick weathered layer, partly
However, there is a deep weathering beneath VES weathered/fractured basement and fresh bedrock.
point 17 and 18. The presence of laterite beneath The topsoil constitutes the layer within which small
the clayey topsoil which hardly extends beyond civil engineering structures can be constructed.
2.64m reduces the danger posed by clay formation From the table of resistivity values (Table 1), the
to large buildings. This area forms a good site for topsoil is composed of sandy clay, clayey sand and
the erection of high-rise civil engineering patches of lateritic hard pans. Engineering
structures. competence of the subsurface can be qualitatively
evaluated from the layer resistivity. The higher the
layer resistivity value, the higher the competence of
a layer; hence from the point of view of the
1151 | P a g e
10. Fadele, Jatau, Patrick / International Journal of Engineering Research and Applications
(IJERA) ISSN: 2248-9622 www.ijera.com
Vol. 2, Issue 5, September- October 2012, pp.1143-1153
resistivity value therefore, laterite is the most areas and possibly high moisture content. The
competent of the delineated topsoil, followed by second layer is the weathered basement with
clayey sand and sandy clay being the least resistivity values varying from 70Ωm to 356Ωm
competent. Based on the resistivity values, depths and thickness ranges between 0.7m to 37.36m,
of about 10 - 15m can support small to medium thinnest at VES 1 and thickest at VES 6. The third
size structures while depth in excess of 25m can layer is the partly weathered and fractured
support massive civil engineering structures in the basement with resistivity and thickness values
study area. varying between 245Ωm to 694Ωm and 5.86m to
34.2m respectively. The layer is extensive and
Groundwater Potential thickest at VES 18 and thinnest at VES 16. The
Even though experience has shown that fourth layer is presumably fresh basement whose
there is no direct relationship between groundwater resistivity values vary from 1114Ωm to 3699Ωm
yield and borehole depth in a basement complex with an infinite depth. Though the thickness of the
environment, studies (Bala and Ike, 2001; Omosuyi bedrock is assumed to be infinite, the depth from
et al., 2008; Ariyo and Osinawo, 2007) revealed the earth’s surface to the bedrock surface varies
that areas with thick overburden cover in such between 2.64m to 44.11m. A-curve type which
basement complex terrain has high potential for shows a continuous and uniform increase in
groundwater. According to Ariyo and Oguntade resistivity predominates. This curve typifies an area
(2009), in a basement complex terrain, areas with showing characteristics of high load-bearing
overburden thickness of 15m and above are good strength. This is followed by HK-curve showing
for groundwater development. The highest that some areas have overburden saturation which
groundwater yield is often obtained from a recharges the main aquifer units. The rest of the
weathered/fractured aquifer, or simply a subsurface curves are minority in number with H-type curve
sequence that has a combination of a significantly which has a minimum resistivity intermediate layer
thick and sandy weathered layer and fractured underlain and overlain by more resistant materials
aquifer. Where the bedrock is not fractured, a reminiscent of areas promising for groundwater
borehole can be located at a point having a development. Based on the resistivity values of the
relatively high layer resistivity greater than 150Ωm different geoelectric layers, the various geologic
but less than 600Ωm (Olorunfemi, 2009). From the units up to depth of 25m are competent and can
foregoing two parameters – overburden thickness support massive civil engineering structures. The
and resistivity values, VES 2, 3, 4, 5, 6, 8, 9, 17 presence of laterite beneath the clayey topsoil
and 18 can be considered to be productive zones which hardly extends beyond 2.64m reduces the
for groundwater development in the study area. danger posed by clay formation to large buildings.
Since the area is generally shallow to the water Other probable causes of foundation defects are the
aquifer and groundwater in this area is vulnerable growth of tree roots, organic deposits, sink holes,
to pollution, the depth of sewage system should be cavities or ground surface saturation due to
<10m to the weathered basement (aquiferrous seepages and this should be taken care of during
zone) in order to avoid groundwater contamination. building project implementation to ensure that
It is suggested that potential sources of buildings erected at the site stands the test of time.
contamination site like sewage channels should be In a basement complex terrain, areas with
sited far away from viable aquifer units to ensure overburden thickness of 15m and above are good
safety consumption of groundwater within the area. for groundwater development. The highest
groundwater yield is often obtained from a
VI. Conclusion weathered/fractured aquifer, or simply a subsurface
The VES results revealed heterogeneous sequence that has a combination of a significantly
nature of the subsurface geological sequence. thick and sandy weathered layer and fractured
Though the geoelectric section showed complexity aquifer. Where the bedrock is not fractured, a
in the Subsurface lithology, there is however, no borehole can be located at a point having a
indication of any major fracture or fault that could relatively high layer resistivity greater than 150Ωm
aid subsidence. The geologic sequence beneath the but less than 600Ωm (Olorunfemi, 2009). From the
study area is composed of topsoil, weathered layer, foregoing two parameters – overburden thickness
partly weathered/fractured basement, and fresh and resistivity values, VES 2, 3, 4, 5, 6, 8, 9, 17
basement. The topsoil is composed of clayey-sandy and 18 can be considered to be productive zones
and sandy-lateritic hard crust with resistivity values for groundwater development in the study area. To
ranging from 26Ωm to 391Ωm and thickness ensure safety appraisal of groundwater
varying from 0.38m to 2.64m, however, observed consumption in the area, potential sources of
from the geoelectric sections that VES 2, 3, 4, 10, contamination site should be sited far away from
11, 12, 13, 14 and 15 are characterized with low viable aquifer units to ensure safety consumption of
resistivity values varying between 26Ωm to 53Ωm groundwater within the study area.
suggesting the clayey nature of the topsoil in these
1152 | P a g e
11. Fadele, Jatau, Patrick / International Journal of Engineering Research and Applications
(IJERA) ISSN: 2248-9622 www.ijera.com
Vol. 2, Issue 5, September- October 2012, pp.1143-1153
References 14. Nigerian Association of Hydrogeologists.
1. Ariyo, S.O. and Oguntade, A.K. (2009). Special Publication Series 1, pp. 1-20.
Geophysical Investigation for 15. Omoyoloye, N.A., Oladapo, M.I. and
Groundwater Potential in Mamu Area, Adeoye, O.O., (2008). Engineering
Southwestern Nigeria. Medwell Online Geophysical Study of Adagbakuja
Journal of Earth Sciences, Vol.3, no.1, Newtown Development, Southwestern
pp.10-13. Nigeria. Medwell Online Journal of Earth
2. Ariyo, S.O. and Osinawo, O.O. (2007). Science; Vol. 2(2); pp. 55-63
Hydrogeophysical Evaluation of 16. Oseji, J.O., Atakpo, E. and Okolie, E.C.
Groundwater Potentials of (2005). Geoelectric Investigation of the
Atan/Odosenbora. Vol.9, no.1, pp. 50-65. Aquifer Characteristics and Groundwater
3. Bala, A.E. and Ike, E.C. (2001). The Potential in Kwale, Delta State. Nigerian
Aquifer of the Crystalline Basement Journal of Applied Sciences and
Complex Area of Africa. Quarterly Environmental Management, Vol.9, pp.
Journal of Engineering Geology, Vol.18, 157-1600.
pp. 35-36.Burger, R.H (1992),
‘Exploration Geophysics of the Shallow
Subsurface’. prentice Hall, U.S.A. pp. 30-
56
4. Blyth, F.G.H and de Freitas, M.D.,
(1988).A Geology for Engineers’, Butler
and Tannar Ltd, Frome and London. Pp.
292-293.
5. Geology for Engineers. Butler and Tannar
Ltd, Frome and London. Pp. 292-293.
6. Burland, J.B and Burbidge, M.C (1981).
Settlement of Foundations on Sand and
Gravel Proceedings of the Institution of
Civil Engineers, 78(1), pp. 1325- 1381.
7. Goh, C.L., and Adeleke, B.O., (1978).
Certificate Physical and Human
Geography’ Oxford University Press,
Ibadan,pp78-150.
8. Hore, P.N (1970). Weather and Climate of
Zaria and its Region .(Ed.) By M.J.
Mortimore, Department of Geography,
Occasional Paper No4. A.B.U. Zaria. pp.
41-54
9. McCurry, P. O. (1970). The Geology of
Zaria Sheet 102 S.W and its Region in
Mortimore, M.J. (Ed). Department of
Geography occasional paper No.4,
10. Ahmadu Bello University, Zaria. pp. 1-3.
11. Omosuyi, G.O., Ojo, J.S. and
Enikanoselu, P.A. (2003). Geophysical
Investigation for Groundwater around
Obanla-Obakekere in Akure Area within
the Basement Complex of South-western
Nigeria. Journal of Mining and Geology,
Vol.39, no.2, pp. 109-116.
12. Okolie, E.C., Osemeikhian, J.E.A., Oseji,
J.O. and Atakpo, E. (2005). Geophysical
Investigation of the Source of River
Ethiope in Ukwuani Local Government
Area of Delta State. Nigerian Institute of
Physics, Vol.17, pp.30-45.
13. Olorunfemi M.O. (2009). Water resources,
Groundwater Exploration, Borehole site
selection, and Optimum Drill Depth in
Basement Complex Terrain: Journal of the
1153 | P a g e