![2. The ACFM Method
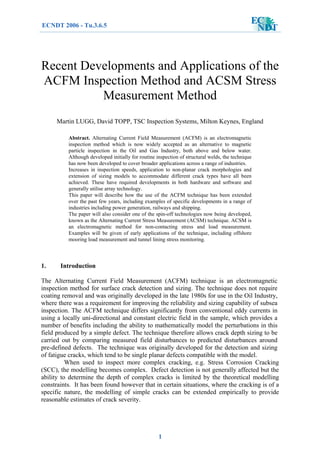
The Alternating Current Field Measurement (ACFM) technique is an electromagnetic
technique capable of both detecting and sizing (length and depth) surface breaking cracks
in metals. The basis of the technique is that an alternating constant current in a tangential
solenoid, remote from the test surface, induces electric currents in the sample surface
which are uni-directional and of uniform strength over a localised area under the solenoid.
When there are no defects present in this area, these electric currents will be undisturbed. If
a crack is present the uniform current is disturbed and the current flows around the ends
and down the faces of the crack.
Clockwise flow
gives Bz peak
Anti-clockwise
flow gives Bz
trough
Uniform input
current
Current lines
close together
gives Bx peak Current lines far
apart gives Bx
trough
Bz
Bx
x y
z
Figure 1. ACFM currents flowing around a defect
Associated with the current flowing in the surface is a magnetic field above the surface
which, like the current in the surface, will be disturbed in the presence of a defect. In the
ACFM technique, components of this magnetic field are measured by sensors close to the
surface. An important factor of the ACFM technique is its capability to relate percentage
changes in the magnetic field strength in a particular direction to the size of defect that
caused that disturbance. This was made possible by a series of studies at University College
London in the 1980s [1], which provided mathematical modelling of the electric currents,
and then of the magnetic fields, for a variety of crack shapes and sizes.
Although the magnetic field above the surface is a complex 3D field, it is
sufficient to measure two orthogonal components of the field in order to characterise a
planar defect. Figure 1 presents a plan view of a surface breaking crack where a uniform ac
current is flowing in the y-direction. In the absence of a defect, the magnetic field
component in the x-direction (Bx), at right angles to the current, would be locally constant
(proportional to the current density). The other magnetic field components (By and Bz)
would be zero. However, when a defect is present, as in figure 1, all three components are
affected. As the current flows around the deeper part of the crack, the current density in the
y-direction is reduced and hence Bx is reduced. The amount of the reduction in Bx is
indicative of the depth of the defect. The magnetic field component normal to the metal
2](data:image/gif;base64,R0lGODlhAQABAIAAAAAAAP///yH5BAEAAAAALAAAAAABAAEAAAIBRAA7)
Recommended
More Related Content
What's hot
What's hot (20)
Similar to Acfm paper
Similar to Acfm paper (20)
Recently uploaded
Recently uploaded (20)
Acfm paper
- 1. Recent Developments and Applications of the ACFM Inspection Method and ACSM Stress Measurement Method Martin LUGG, David TOPP, TSC Inspection Systems, Milton Keynes, England Abstract. Alternating Current Field Measurement (ACFM) is an electromagnetic inspection method which is now widely accepted as an alternative to magnetic particle inspection in the Oil and Gas Industry, both above and below water. Although developed initially for routine inspection of structural welds, the technique has now been developed to cover broader applications across a range of industries. Increases in inspection speeds, application to non-planar crack morphologies and extension of sizing models to accommodate different crack types have all been achieved. These have required developments in both hardware and software and generally utilise array technology. This paper will describe how the use of the ACFM technique has been extended over the past few years, including examples of specific developments in a range of industries including power generation, railways and shipping. The paper will also consider one of the spin-off technologies now being developed, known as the Alternating Current Stress Measurement (ACSM) technique. ACSM is an electromagnetic method for non-contacting stress and load measurement. Examples will be given of early applications of the technique, including offshore mooring load measurement and tunnel lining stress monitoring. 1. Introduction The Alternating Current Field Measurement (ACFM) technique is an electromagnetic inspection method for surface crack detection and sizing. The technique does not require coating removal and was originally developed in the late 1980s for use in the Oil Industry, where there was a requirement for improving the reliability and sizing capability of subsea inspection. The ACFM technique differs significantly from conventional eddy currents in using a locally uni-directional and constant electric field in the sample, which provides a number of benefits including the ability to mathematically model the perturbations in this field produced by a simple defect. The technique therefore allows crack depth sizing to be carried out by comparing measured field disturbances to predicted disturbances around pre-defined defects. The technique was originally developed for the detection and sizing of fatigue cracks, which tend to be single planar defects compatible with the model. When used to inspect more complex cracking, e.g. Stress Corrosion Cracking (SCC), the modelling becomes complex. Defect detection is not generally affected but the ability to determine the depth of complex cracks is limited by the theoretical modelling constraints. It has been found however that in certain situations, where the cracking is of a specific nature, the modelling of simple cracks can be extended empirically to provide reasonable estimates of crack severity. ECNDT 2006 - Tu.3.6.5 1
- 2. 2. The ACFM Method The Alternating Current Field Measurement (ACFM) technique is an electromagnetic technique capable of both detecting and sizing (length and depth) surface breaking cracks in metals. The basis of the technique is that an alternating constant current in a tangential solenoid, remote from the test surface, induces electric currents in the sample surface which are uni-directional and of uniform strength over a localised area under the solenoid. When there are no defects present in this area, these electric currents will be undisturbed. If a crack is present the uniform current is disturbed and the current flows around the ends and down the faces of the crack. Clockwise flow gives Bz peak Anti-clockwise flow gives Bz trough Uniform input current Current lines close together gives Bx peak Current lines far apart gives Bx trough Bz Bx x y z Figure 1. ACFM currents flowing around a defect Associated with the current flowing in the surface is a magnetic field above the surface which, like the current in the surface, will be disturbed in the presence of a defect. In the ACFM technique, components of this magnetic field are measured by sensors close to the surface. An important factor of the ACFM technique is its capability to relate percentage changes in the magnetic field strength in a particular direction to the size of defect that caused that disturbance. This was made possible by a series of studies at University College London in the 1980s [1], which provided mathematical modelling of the electric currents, and then of the magnetic fields, for a variety of crack shapes and sizes. Although the magnetic field above the surface is a complex 3D field, it is sufficient to measure two orthogonal components of the field in order to characterise a planar defect. Figure 1 presents a plan view of a surface breaking crack where a uniform ac current is flowing in the y-direction. In the absence of a defect, the magnetic field component in the x-direction (Bx), at right angles to the current, would be locally constant (proportional to the current density). The other magnetic field components (By and Bz) would be zero. However, when a defect is present, as in figure 1, all three components are affected. As the current flows around the deeper part of the crack, the current density in the y-direction is reduced and hence Bx is reduced. The amount of the reduction in Bx is indicative of the depth of the defect. The magnetic field component normal to the metal 2
- 3. surface (Bz) is produced by circulations of the surface current flow. This circulation is strongest at the crack ends, clockwise at one end, anticlockwise at the other, and so Bz exhibits a positive response above one crack end and a negative response above the other end. The physical separation of the two responses is therefore indicative of crack length. From a practical standpoint, the technique can be applied using a single probe that can be manually moved along a component. Another advantage of using a uniform input field, apart from the easier modelling, is that perturbations in the magnetic fields decay more slowly with height above the metal surface. Since an ACFM probe requires no electrical or mechanical contact with the component, ACFM can be applied without the removal of surface coatings or grime several millimetres thick. The plot on the left of figure 2 shows typical raw data from the crack end (Bz) and crack depth (Bx) sensors collected from a manually deployed probe. The right hand section of figure 2 shows this presented as a so-called “butterfly plot” in which Bx is plotted against Bz. In the presence of a defect, a distinctive butterfly-shaped loop is drawn on the screen and for manual operation the operator looks for this loop to decide whether a crack is present or not. Having detected a defect, the data can be subsequently interrogated to determine the depth of the crack without calibration. All data is stored by the system and is available for subsequent review and analysis. This is particularly useful for audit purposes and for reporting. Length Signal Depth Signal The Butterfly Plot does not require uniform speed of probe movement Figure 2. Typical ACFM signal response to a defect 2.1 ACFM Arrays A conventional ACFM probe contains a field inducer and one pair of sensors. In its simplest form an ACFM array probe contains multiple sensor pairs operating with a single (larger) field inducer. A linear array can then be swept over the component to provide inspection of the scanned area. The introduction of array technology allows the inspection of larger areas in a single scan (Figure 3). With a single field the inspection is limited to a particular orientation of defects (predominantly oriented along the direction of scan). To overcome this limitation it is possible to incorporate other field inducers in the array probe in order to allow a field to be introduced within the sample in other orientations. This is particularly useful in situations where the crack orientation could be unknown or variable. In this case additional sensors, denoted By, are also incorporated in order to take full advantage of the additional input field directions. 3
- 4. Figure 3. Schematic showing different coverage from manual and array probes To make best use of an array probe, it is necessary to switch through the sensors as quickly as possible in order to allow rapid inspection. There are inherent limitations to this, however, including switching settling times, data transfer rates and limitations in the sampling of a 5kHz signal. With conventional analogue electronics these factors limit the speed of scan for array probes to around 15mm/second for a single field 16 channel array. In some applications, this is limiting and affects the useability of the tool. For this reason a high speed instrument has been developed which allows scanning speeds 4-5 times faster than with the conventional ACFM instrument. This has been achieved by increasing the energising frequency from 5kHz to 50 kHz together with modifications to the signal processing electronics. 3. Use of ACFM in Non-Fatigue Applications The following are examples of applications of ACFM when the defects are not standard fatigue cracks. In these situations the equipment, procedures and modelling have needed to be adapted to suit the particular application. 3.1 SCC in Gas Pipelines Stress Corrosion Cracking (SCC) has been recognised as an integrity threat to oil and gas pipelines since the 1960’s. Cracks can develop on buried pipelines when ground water comes in contact with the steel pipe surface beneath patches of separated or damaged pipe coating. Typically cracks begin as microscopic fissures that form in colonies containing numerous short, axially-oriented cracks (Figure 4). Over years of service cracks can extend by joining with their neighbours and occasionally cracks can develop to a size that can cause product leakage or rupture. The principal modern method of detecting SCC on a pipeline is by performing a pig inspection. This allows the location of major clusters to be determined to within a metre or so. However, in order to determine the severity of the defects, the pipeline must conventionally be excavated at the selected locations, the coating removed from the pipe and the pipe surface cleaned. Because cracks are not visible to the naked eye until they attain advanced stages of development, detection then requires either a technique that renders the cracks visible or some form of indirect detection. Historically the preferred technique has been magnetic particle inspection (MPI) and due to small indication size and the need for photo-documentation either a wet fluorescent or wet colour-contrasting technique has been used. Single probe inspects a narrow strip Multiple sensors Array probe inspects wide strip 4
- 5. While MPI is a very effective inspection technique, its field use can be costly when one considers the standby time while the MPI inspection and documentation is in progress. In a 2003 study in Canada, various technologies were assessed for their potential both to detect cracks through pipe coatings and for their inspection speed relative to that of MPI. The study [2] concluded that ACFM had the greatest potential for this application given its advanced state of development and commercial availability. A series of laboratory tests were then conducted to assess how well ACFM could detect typical SCC. Samples of pipe were obtained that had been cut out from service pipe containing examples of SCC typical of that found in the field. The coating had been removed and several colonies of cracks were visible (Figure 4). The plates were inspected in the received condition without any cleaning or demagnetization. The nature of SCC results in multiple cracks and ACFM is often unable to discriminate individual cracks within a cluster. However it was found that ACFM was able to reliably identify the presence of a cluster (i.e. crack detection). The defect areas noted in the ACFM results agreed well with the areas detected with visual and MPI inspection and it was often possible to match individual visual defects within areas to those in the ACFM data (Figure 5). Figure 4. Visual indications in and around zone 2. Figure 5. False colour Bz ACFM data overlaid with visual indication zones. Following the success of the laboratory trial, ACFM was applied in a series of buried pipeline digs in Ontario, Canada [3]. The aims of the visit were to review the obstacles and opportunities for the use of ACFM and to determine the capabilities of standard ACFM equipment for detecting SCC at the dig locations. The pipeline was coated in polyethylene, typically 1mm thick. Initially the ACFM inspections were carried out through the coating (Figure 6). Several crack colonies were recorded using ACFM. 5
- 6. Figure 6. ACFM inspection on gas pipeline After the ACFM inspection had taken place, the coating was removed and the surface prepared for MPI inspection. In every case where ACFM had indicated the presence of crack colonies this was confirmed by MPI inspection. At one particular site the largest indication in the colony was sized as 6mm long and <1.1mm deep with ACFM. The same area was then ground to remove the defect and the pipe thickness measured before and after to give an indication of depth. The grinding required to remove the defect indications was measured to be approximately 0.5mm. The fact that ACFM can be used through a coating in reasonable condition means that pipelines can be inspected without meticulous surface cleaning, a significant advantage over MPI inspection. ACFM inspection does not require contrast paint and does not produce a residue so it could be used before or after coating removal and only one surface blasting operation would be required. Another advantage provided by ACFM is the potential to provide crack depth sizing. While the current sizing algorithms are based on a fatigue crack geometry, and therefore not expected to be accurate on clustered defects, results so far show that ACFM can grade cracks in terms of depth. Development of SCC algorithms could offer the prospect of ACFM providing more accurate depth sizing information which would greatly improve the ability to classify SCC as to its severity and likely impact on pipeline integrity. 3.2 SCC in Nuclear Power Industry Another industry where stress corrosion cracking is more of a problem that fatigue cracking is the nuclear power industry. ACFM has been deployed in many difficult environments, particularly offshore, but the nuclear power industry presented a new difficulty in the form of radiation. In 2004, the ACFM technique was chosen for the inspection of the butt welds in a large austenitic stainless steel tank used for nuclear waste storage [4]. A series of real defects were produced in realistic welded sample plates, and the instrument parameters adjusted to give the most accurate depth sizing. A special waterproof probe was then produced which was deployed by underwater crawler in a test tank. The probe height had to be kept very low to allow the probe to get underneath the storage racks holding the nuclear waste material. In addition to the remote deployment, the probes were also deployed by diver in a working tank (Figure 7). The radiation level in this case was relatively low, and the probes performed well. 6
- 7. Figure 7. ACFM inspection of welds in stainless steel nuclear waste storage tank The probes built for the trials used standard electronic components, to save costs. Following the trial, it was decided to see how much radiation a standard probe could receive before failure. This information would help users to decide whether the extra lifetime of a probe built with radiation-tolerant components would be worth the extra expense. One of the array probes was therefore placed near to a Cobalt radiation source while data was continuously connected. The probe functioned with no change in data until an estimated dose of 600 Gy (6 x 10⁴ Rad) was received. The defects studied in the storage tanks were all linear, parallel to the welds. More recently, feasibility studies have been initiated on the use of ACFM on SCC in the stainless steel cladding surface on nozzles in a nuclear pressure vessel. The defects in this case are of more complex morphology. Figure 8 shows ACFM data from a defect in the form of an “X”, where one crack crosses another. Figure 8. ACFM data from X-shaped SCC defect in cladding on nozzle sample (with current flowing down page on left, and across page on right) With the induced current flowing in one direction, signals are seen from just the crack that is perpendicular to this current. This is the expected behaviour in non-ferrous metals – when the current is flowing parallel to the defect, it is not perturbed so there are no perturbations to the magnetic field. However, by using a second induced current, at right angles to the first, the other crack can be seen. In ferrous steel, the situation is different when the induced current is parallel to a defect. Although there is no current perturbation, an ACFM probe still detects the defect because of the flux leakage signal where the magnetic field crosses the defect. 7
- 8. 3.3 Head-Checking on Rail As described above, the ACFM method was originally developed for manual inspection of welds. In this case, the inspection area is quite narrow, inspection speeds are relatively slow and scanning is generally parallel to the defects. The requirement for rail inspection is very different. There is a requirement to inspect a wider area, covering the gauge face, gauge corner and across the head towards to field side. The speed of inspection should be as high a possible, in order to achieve acceptable throughput. The defects are generally perpendicular to the scan direction (so each defect is seen only once by each sensor in an array). Finally, when defects occur, they tend to be in large, closely-spaced clusters, making it desirable to have automated interpretation of the results. Like SCC, the morphology of Head-Checking, or Gauge Corner Cracking (GCC) is very different to the fatigue cracking that ACFM was developed for. As well as being closely spaced, and at a large angle to the running direction (Figure 9), they are highly inclined to the surface. A typical crack is initially inclined at an angle of approximately 30 degrees to the surface until they break through the compressive layer, about 5mm below the surface, when the angle increases to approximately 60 degrees. Most rail inspection is now carried out by ultrasonic testing. This works well for detecting severe defect clusters, but can suffer from "crack shielding" where shallower defects mask deeper defects and thereby undersize the greatest defect depth. Shallow surface cracking can also be difficult for ultrasonics to identify and categorise. For these reasons, the industry in the UK was interested in developing electromagnetic techniques to improve detection of shallow GCC and improve sizing accuracy. Figure 9. Example of Gauge Corner Cracking (GCC) The ACFM technique had already been in use in the rail industry for a few years, firstly for inspection of welds on bogies through paint coatings, and then getting approval for axle inspection, following independent comparative blind trials. To tackle the rail inspection problem, a special-purpose ACFM array probe was designed. Coverage of the whole rail head was achieved by use of a sensor array, shaped to the head of the rail. In fact the probe was designed to take the shape of a wheel in order to optimise the location of the probe even on worn rail. The inspection across the rail head is carried out by sequentially scanning across the group of sensors. By doing this, a continuous scan of the rail head is achieved as the probe is pushed along the rail. Using the high speed instrumentation scanning speeds of 2-3km per hour have been achieved. It must be recognised that this is a quantitative inspection method and that sufficient data must be collected to not only detect, but also determine the severity of the cracking. 8
- 9. The system has been packaged into a pedestrian 'Walking Stick' , Figure 10, which is totally self contained and capable of operating for at least 8 hours from its own power source. The walking stick display is a ruggedised PC which controls the system and displays analysed data in a readily useable form for the operator. Very little operator interpretation is required. Figure 11 shows a typical data screen. In order to provide real time crack sizing it was necessary to consider the mathematical modelling and its relevance to the GCC crack form. It was decided that the existing models would be used as a starting point and that empirical correction factors would be applied to take account of the crack type. This obviously required a large amount of data on crack growth behaviour and that is difficult to achieve with any existing non- destructive testing methods. For this reason, it was decided to embark on a programme of destructive testing, which could be used to characterise the crack shape and at the same time to validate the results of blind trials using the ACFM method. Figure 10. ACFM Rail Walking Stick 9
- 10. Figure 11. Walking Stick screen layout showing defective rail A number of samples of cracked rail from the network were collected and after inspection with the Walking Stick were sectioned to determine the crack size and shape. This information was then used to develop empirical corrections to the sizing models. Figure 12 shows the improvement achieved with the new models. It was not surprising the original models did not work well for the GCC because they had been developed for single planar cracks. Model Error (mm) vs Pocket Depth -10 0 10 20 30 40 50 60 0 2 4 6 8 10 12 14 16 Pocket Depth (mm) Error(mm) New Model Old Model Figure 12. Comparison of errors using old and new models Another part of the accreditation process involved Electromagnetic Compatibility (EMC) testing to both industrial standards [5] and railway specific standards [6]. This work was supplemented by third party reviews to assess the likelihood of interference with specific trackside signalling equipment [7]. This has led to product approval by Network Rail for use even on operational track (Red Zone working). 4. Electromagmetic Stress Measurements When a stress is applied to a ferromagnetic material the magnetic domains change in both size and magnetisation direction in a process known as the magnetostrictive effect. These changes then alter the magnetic permeability of the material. The Alternating Current Stress Measurement (ACSM) technique has been developed, as a spin-off from ACFM, to allow this effect to be measured and, by reference and calibration, allow the applied stress to be determined. 10
- 11. The ACSM technique involves inducing currents into the metal surface and making measurements of the magnetic fields produced above the surface. Small changes in the strength and direction of this magnetic field can be related to changes in the stress state. The technique does not require contact with the surface under investigation, allowing stress measurements to be made with little setting up time and generally without surface preparation or paint removal. The technique responds to both tensile and compressive loads. The directional nature of the stresses produces anisotropy in the material magnetic properties. Using directional applied currents, a theoretical interpretation of measured electrical or magnetic properties has been developed for anisotropic behaviour [8] and found to correlate with practical measurements. This work led to the practical use of the ACSM technique as a non-contacting stress measurement tool. In practical terms the ACSM technique can be considered similar to a moveable strain gauge, however the characteristics of the material (stress response) must be known in order to allow applied stress to be quantified. This calibration process is often simple because many 'families' of steel have similar responses. However it is not possible to use calibration data from, for example, mild steel to predict the behaviour of a high alloy steel. Calibration takes the form of measuring the material response to known applied stresses and is often achieved by making measurements on simple test pieces in the lab under simple bending or uniaxial loads. In its simplest application, the ACSM technique can be used to measure dynamic load cycles. These are typically required for fatigue analysis for example, or for measuring the effect of an event such as a lorry passing over a bridge, the welding of a component or the effect of removing a support. The emphasis here is on dynamic loading because simple ACSM systems can accurately measure changes in stress, but absolute measurements require a more complex system. However, the absolute (or mean) stress level is often not required for basic fatigue analysis of structural steels in air, where the stress amplitude is of more importance. Under the right conditions, the calibration curves of probe response to applied stress are essentially linear responses (Figure 13 shows a typical response for a ship steel). In practice this means that the load cycle range can be measured without knowing the value of the mean load. S t r e ssP r obe Re sponse - S hip S t e e l y =3.5804x +1105.4 1000 1100 1200 1300 1400 1500 1600 0 20 40 60 80 100 120 140 St r ess ( M P a) Figure 13. ACSM response from typical ship steel The mean load is more difficult to determine using simple ACSM systems. Many steels exhibit a hysteresis effect due to previous loading and this can be pronounced when making magnetic measurements. In this situation a demagnetisation process can be used to shake down the material into a known reproducible state. By measuring in that state a better estimate of the mean load in the material is obtained. More complex ACSM systems contain such a demagnetisation facility. 11
- 12. 4.1 Mooring Chain Monitoring – Dynamic stress The technique is currently being evaluated for the in-situ measurement of load in mooring chain. The chains, used for mooring offshore facilities, are made from bar up to 150mm diameter. It is desirable to be able to monitor the loads once installed and in a number of instances, on-vessel load monitoring with conventional methods have proved unreliable in the harsh offshore environments. The objective here is to develop a system that can be easily installed by diver and either be used to take spot readings or be left in place to provide monitoring over a period of time. Figure 14. Large scale tests on 114mm Diameter mooring chain Figure 15 shows the large scale laboratory tests and instrumented chain link During the lab tests, the applied load was increased up to a mean load, and then the chain was loaded sinusoidally with an increasing amplitude. The ACSM probe output during this test is shown in Figure 16. 12
- 13. 1400 1450 1500 1550 1600 1650 1700 1750 1800 1 155 309 463 617 771 925 1079 1233 1387 1541 1695 1849 2003 2157 2311 2465 2619 2773 2927 3081 3235 3389 Time (1/10 secs) ACSMprobeo/p Figure 16. ACSM data from chain link under variable amplitude loading The results were very encouraging and the first offshore trials took place in late 2005 when the technique, applied by divers, was used to measure static loads. The results compared well with pre-installed load monitoring devices. Plans are now underway to produce a permanently-installed system for load monitoring. 4.2 Load in Tunnel Liners – Absolute stress distribution The technique is being used to determine the loading in cast iron tunnel liners used in the London Underground system. The advantage of the ACSM technique for this application is that, unlike the hole drilling used currently, the process is totally non-intrusive. This application requires measurement of static loads and so special procedures have been developed to facilitate this. The technique has been applied to several tunnels in the system and a good correlation has been obtained between the depth of the tunnel and the measured stress in the liner. The results have also correlated well with results from finite element modelling and hole drilling methods. The tunnel liners consist of many separate panels. Each panel is effectively a concave curved plate with flanges around the edge, and neighbouring panels are bolted together through the flanges. A panel is thus expected to see a compressive stress due to the external load, with the stress level greatest at the centre of the panel, reducing towards the flanges at each edge of the panel. Figure 17 shows data from two adjacent panels in one tunnel, where this behaviour can be clearly seen. 13
- 14. -90 -80 -70 -60 -50 -40 -30 -20 -10 0 0 200 400 600 800 1000 1200 1400 Distance along Tunnel (mm) Stress(MPa) Above centre Centre of panel Below centre 1776 1775 Figure 17. Stress distribution measured across two panels in underground tunnel lining 5. Conclusions The ACFM inspection technique is now being developed beyond the original application of inspection of welds for fatigue damage. The introduction of ACFM arrays allows larger areas to be inspected more quickly, thereby providing the opportunity for plain body inspection, away from geometric stress raisers. Also, the technique is now being applied to detect and size defects other than the conventional semi-elliptical fatigue cracks. Such new applications include stress-corrosion cracking on pipelines and in the nuclear power industry, and gauge-corner cracking on rail. The ACSM stress measurement technique has been developed from ACFM. The opportunities for non-intrusive stress measurement are enormous and the applications investigated so far suggest the technique has real promise. References [1] A M Lewis, D H Michael, M C Lugg and R Collins, “Thin-skin electromagnetic fields around surface-breaking cracks in metals”, J. Appl. Phys. 64(8), 3777-3784, 1988 [2] L Clapham and C Blouw, “Review of Non-destructive Technologies for Rapid In-hole SCC Detection”, Applied Magnetics Group, Department of Physics, Queen’s University, Kingston, Ontario, Canada [3] M Smith and R Sutherby, “The Detection of Pipeline SCC Flaws Using the ACFM Technique”, Insight, 47 (12), 765-768, 2005 [4] M Smith and C Laenan, “Inspection of Nuclear Storage Tanks using Remotely Deployed ACFMT”, ASNT Fall Conference, Columbus, Ohio, USA, Oct 17-21, 2005 [5] EU EMC Directive 89/336/EEC [6] UK Rail regulations SI 2372 1992 [7] Atkins Rail, Document No. 4340050-L-EC-003 [8] Zhou, J. and Dover, W.D., “Electromagnetic induction in anisotropic half-space and electromagnetic stress model”, J. Appl. Phys., 83(4), 1694-1701, 1998 14