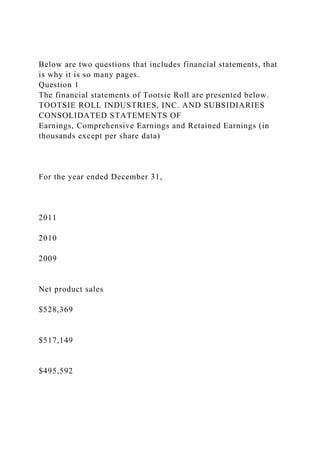
Below are two questions that includes financial statements, that is why it is so many pages.
Question 1
The financial statements of Tootsie Roll are presented below.
TOOTSIE ROLL INDUSTRIES, INC. AND SUBSIDIARIES
CONSOLIDATED STATEMENTS OF
Earnings, Comprehensive Earnings and Retained Earnings (in thousands except per share data)
For the year ended December 31,
2011
2010
2009
Net product sales
$528,369
$517,149
$495,592
Rental and royalty revenue
4,136
4,299
3,739
Total revenue
532,505
521,448
499,331
Product cost of goods sold
365,225
349,334
319,775
Rental and royalty cost
1,038
1,088
852
Total costs
366,263
350,422
320,627
Product gross margin
163,144
167,815
175,817
Rental and royalty gross margin
3,098
3,211
2,887
Total gross margin
166,242
171,026
178,704
Selling, marketing and administrative expenses
108,276
106,316
103,755
Impairment charges
—
—
14,000
Earnings from operations
57,966
64,710
60,949
Other income (expense), net
2,946
8,358
2,100
Earnings before income taxes
60,912
73,068
63,049
Provision for income taxes
16,974
20,005
9,892
Net earnings
$43,938
$53,063
$53,157
Net earnings
$43,938
$53,063
$53,157
Other comprehensive earnings (loss)
(8,740
)
1,183
2,845
Comprehensive earnings
$35,198
$54,246
$56,002
Retained earnings at beginning of year.
$135,866
$147,687
$144,949
Net earnings
43,938
53,063
53,157
Cash dividends
(18,360
)
(18,078
)
(17,790
)
Stock dividends
(47,175
)
(46,806
)
(32,629
)
Retained earnings at end of year
$114,269
$135,866
$147,687
Earnings per share
$0.76
$0.90
$0.89
Average Common and Class B Common shares outstanding
57,892
58,685
59,425
(The accompanying notes are an integral part of these statements.)
CONSOLIDATED STATEMENTS OF
Financial Position
TOOTSIE ROLL INDUSTRIES, INC. AND SUBSIDIARIES (in thousands except per share data)
Assets
December 31,
2011
2010
CURRENT ASSETS:
Cash and cash equivalents
$78,612
$115,976
Investments
10,895
7,996
Accounts receivable trade, less allowances of $1,731 and $1,531
41,895
37,394
Other receivables
3,391
9,961
Inventories:
Finished goods and work-in-process
42,676
35,416
Raw materials and supplies
29,084
21,236
Prepaid expenses
5,070
6,499
Deferred income taxes
578
689
Total current assets
212,201
235,167
PROPERTY, PLANT AND EQUIPMENT, at cost:
Land
21,939
21,696
Buildings
107,567
102,934
Machinery and equipment
322,993
307,178
Construction in progress
2,598
9,243
455,097
440,974
Less—Accumulated depreciation
242,935
225,482
Net property, plant and equipment
212,162
215,492
OTHER ASSETS:
Goodwill
73,237
73,237
Trademarks
175,024
175,024
Inv ...
Below are two questions that includes financial statements, that i.docx
1. Below are two questions that includes financial statements, that
is why it is so many pages.
Question 1
The financial statements of Tootsie Roll are presented below.
TOOTSIE ROLL INDUSTRIES, INC. AND SUBSIDIARIES
CONSOLIDATED STATEMENTS OF
Earnings, Comprehensive Earnings and Retained Earnings (in
thousands except per share data)
For the year ended December 31,
2011
2010
2009
Net product sales
$528,369
$517,149
$495,592
2. Rental and royalty revenue
4,136
4,299
3,739
Total revenue
532,505
521,448
499,331
Product cost of goods sold
365,225
349,334
319,775
3. Rental and royalty cost
1,038
1,088
852
Total costs
366,263
350,422
320,627
Product gross margin
163,144
167,815
175,817
4. Rental and royalty gross margin
3,098
3,211
2,887
Total gross margin
166,242
171,026
178,704
Selling, marketing and administrative expenses
108,276
106,316
103,755
10. Retained earnings at end of year
$114,269
$135,866
$147,687
Earnings per share
$0.76
$0.90
$0.89
11. Average Common and Class B Common shares outstanding
57,892
58,685
59,425
(The accompanying notes are an integral part of these
statements.)
CONSOLIDATED STATEMENTS OF
Financial Position
TOOTSIE ROLL INDUSTRIES, INC. AND SUBSIDIARIES (in
thousands except per share data)
Assets
December 31,
13. Accounts receivable trade, less allowances of $1,731 and $1,531
41,895
37,394
Other receivables
3,391
9,961
Inventories:
Finished goods and work-in-process
23. Liability for uncertain tax positions
8,345
9,835
Deferred compensation and other liabilities
48,092
46,157
Total noncurrent liabilities
133,566
132,046
SHAREHOLDERS’ EQUITY:
24. Common stock, $.69-4/9 par value—120,000 shares
authorized—36,479 and 36,057 respectively, issued
25,333
25,040
Class B common stock, $.69-4/9 par value—40,000 shares
authorized—21,025 and 20,466 respectively, issued
14,601
14,212
Capital in excess of par value
533,677
505,495
25. Retained earnings, per accompanying statement
114,269
135,866
Accumulated other comprehensive loss
(19,953
)
(11,213
)
Treasury stock (at cost)—71 shares and 69 shares, respectively
(1,992
)
(1,992
)
Total shareholders’ equity
665,935
26. 667,408
Total liabilities and shareholders’ equity
$857,856
$857,959
TOOTSIE ROLL INDUSTRIES, INC. AND SUBSIDIARIES
CONSOLIDATED STATEMENTS OF
Cash Flows (in thousands)
For the year ended December 31,
2011
2010
2009
27. CASH FLOWS FROM OPERATING ACTIVITIES:
Net earnings
$43,938
$53,063
$53,157
Adjustments to reconcile net earnings to net cash provided by
operating activities:
32. Prepaid expenses and other assets
5,106
4,936
5,203
Accounts payable and accrued liabilities
84
2,180
(2,755
)
Income taxes payable and deferred
(5,772
)
36. Purchase of available for sale securities
(39,252
)
(9,301
)
(11,331
)
Sale and maturity of available for sale securities
7,680
8,208
17,511
Net cash used in investing activities
38. )
Dividends paid in cash
(18,407
)
(18,130
)
(17,825
)
Net cash used in financing activities
(36,597
)
(41,011
)
(38,548
)
Increase (decrease) in cash and cash equivalents
39. (37,364
)
24,986
22,082
Cash and cash equivalents at beginning of year
115,976
90,990
68,908
Cash and cash equivalents at end of year
$78,612
$115,976
$90,990
40. Supplemental cash flow information
Income taxes paid
$16,906
$20,586
$22,364
Interest paid
$38
41. $49
$182
Stock dividend issued
$47,053
$46,683
$32,538
(The accompanying notes are an integral part of these
statements.)
Five Year Summary of Earning and Financial Hightlights
TOOTISE ROLL. INDUSTRY, INC. AND SUBSIDIARIES
(Thousands of dollars except per share, percentage and ratio
figures)
56. discounts, returns, allowances and certain advertising and
promotional costs, is recognized when products are delivered to
customers and collectability is reasonably assured. Shipping and
handling costs of $45,850, $43,034, and $38,628 in 2011, 2010
and 2009, respectively, are included in selling, marketing and
administrative expenses. Accounts receivable are unsecured.
Revenues from a major customer aggregated approximately
23.3%, 21.4% and 22.9% of net product sales during the years
ended December 31, 2011, 2010 and 2009, respectively.
SEGMENT AND GEOGRAPHIC INFORMATION:
The Company operates as a single reportable segments
encompassing the manufacturing and sale of confectionery
products. Its principal manufacturing operations are located in
the United States and Canada, and its principal market is in the
United States. The Company also manufactures and sells
confectionery products in Mexico, and exports products to
Canada and countries worldwide.
The following geographic data includes net product sales
summarized on the basis of the customer location and long-lived
assets based on their location:
2011
2010
2009
Net product sales:
59. days
Question 2
The financial statements of The Hershey Company and Tootsie
Roll are presented below.
THE HERSHEY COMPANY
CONSOLIDATED STATEMENTS OF INCOME
For the years ended December 31,
2011
60. 2010
2009
In thousands of dollars except per share amounts
Net Sales
$6,080,788
$5,671,009
$5,298,668
Costs and Expenses:
61. Cost of sales
3,548,896
3,255,801
3,245,531
Selling, marketing and administrative
1,477,750
1,426,477
1,208,672
Business realignment and impairment (credits) charges, net
(886
)
83,433
82,875
Total costs and expenses
5,025,760
4,765,711
62. 4,537,078
Income before Interest and Income Taxes
1,055,028
905,298
761,590
Interest expense, net
92,183
96,434
90,459
Income before Income Taxes
962,845
808,864
671,131
Provision for income taxes
64. Net Income Per Share—Basic—Common Stock
$2.85
$2.29
$1.97
Net Income Per Share—Diluted—Common Stock
$2.74
$2.21
$1.90
Cash Dividends Paid Per Share:
Common Stock
$1.3800
65. $1.2800
$1.1900
Class B Common Stock
1.2500
1.1600
1.0712
The notes to consolidated financial statements are an integral
part of these statements and are included in the Hershey's 2011
Annual Report, available at www.thehersheycompany.com.
THE HERSHEY COMPANY
CONSOLIDATED BALANCE SHEETS
December 31,
2011
2010
In thousands of dollars
68. 2,005,217
Property, Plant and Equipment, Net
1,559,717
1,437,702
Goodwill
516,745
524,134
Other Intangibles
111,913
123,080
Deferred Income Taxes
38,544
71. 24,088
Current portion of long-term debt
97,593
261,392
Total current liabilities
1,173,775
1,298,845
Long-term Debt
1,748,500
1,541,825
Other Long-term Liabilities
617,276
73. Preferred Stock, shares issued: none in 2011 and 2010
—
—
Common Stock, shares issued: 299,269,702 in 2011 and
299,195,325 in 2010
299,269
299,195
Class B Common Stock, shares issued: 60,632,042 in 2011
and 60,706,419 in 2010
60,632
60,706
Additional paid-in capital
75. The Hershey Company stockholders’ equity
849,022
902,316
Noncontrolling interests in subsidiaries
23,626
35,285
Total stockholders’ equity
872,648
937,601
Total liabilities and stockholders’equity
$4,412,199
$4,272,732
76. THE HERSHEY COMPANY
CONSOLIDATED STATEMENTS OF CASH FLOWS
For the years ended December 31,
2011
2010
2009
In thousands of dollars
Cash Flows Provided from (Used by) Operating Activities
78. 182,411
Stock-based compensation expense, net of tax of $15,127,
$17,413 and $19,223, respectively
28,341
32,055
34,927
Excess tax benefits from stock-based compensation
(13,997
)
(1,385
)
(4,455
)
Deferred income taxes
79. 33,611
(18,654
)
(40,578
)
Gain on sale of trademark licensing rights, net of tax of $5,962
(11,072
)
—
—
Business realignment and impairment charges, net of tax of
$18,333, $20,635 and $38,308, respectively
30,838
77,935
60,823
80. Contributions to pension plans
(8,861
)
(6,073
)
(54,457
)
Changes in assets and liabilities, net of effects from business
acquisitions and divestitures:
Accounts receivable—trade
(9,438
)
20,329
87. )
(263,403
)
Exercise of stock options
184,411
92,033
28,318
Excess tax benefits from stock-based compensation
13,997
1,385
4,455
Contributions from noncontrolling interests in subsidiaries
—
88. 10,199
7,322
Repurchase of Common Stock
(384,515
)
(169,099
)
(9,314
)
Net Cash (Used by) Financing Activities
(438,818
)
(71,100
)
(698,921
)
(Decrease) Increase in Cash and Cash Equivalents
89. (190,956
)
631,037
216,502
Cash and Cash Equivalents as of January 1
884,642
253,605
37,103
Cash and Cash Equivalents as of December 31
$693,686
$884,642
$253,605
Interest Paid
101. 59,425
(The accompanying notes are an integral part of these
statements.)
CONSOLIDATED STATEMENTS OF
Financial Position
TOOTSIE ROLL INDUSTRIES, INC. AND SUBSIDIARIES (in
thousands except per share data)
Assets
December 31,
2011
2010
CURRENT ASSETS:
102. Cash and cash equivalents
$78,612
$115,976
Investments
10,895
7,996
Accounts receivable trade, less allowances of $1,731 and $1,531
41,895
37,394
Other receivables
3,391
9,961
113. Total noncurrent liabilities
133,566
132,046
SHAREHOLDERS’ EQUITY:
Common stock, $.69-4/9 par value—120,000 shares
authorized—36,479 and 36,057 respectively, issued
25,333
25,040
Class B common stock, $.69-4/9 par value—40,000 shares
authorized—21,025 and 20,466 respectively, issued
114. 14,601
14,212
Capital in excess of par value
533,677
505,495
Retained earnings, per accompanying statement
114,269
135,866
Accumulated other comprehensive loss
(19,953
)
(11,213
)
115. Treasury stock (at cost)—71 shares and 69 shares, respectively
(1,992
)
(1,992
)
Total shareholders’ equity
665,935
667,408
Total liabilities and shareholders’ equity
$857,856
$857,959
TOOTSIE ROLL INDUSTRIES, INC. AND SUBSIDIARIES
CONSOLIDATED STATEMENTS OF
Cash Flows (in thousands)
116. For the year ended December 31,
2011
2010
2009
CASH FLOWS FROM OPERATING ACTIVITIES:
Net earnings
$43,938
119. Loss from equity method investment
194
342
233
Amortization of marketable security premiums
1,267
522
320
Changes in operating assets and liabilities:
122. 2,180
(2,755
)
Income taxes payable and deferred
(5,772
)
2,322
(12,543
)
Postretirement health care and life insurance benefits
2,022
1,429
1,384
123. Deferred compensation and other liabilities
2,146
2,525
2,960
Others
(708
)
310
305
Net cash provided by operating activities
125. )
Net purchase of trading securities
(3,234
)
(2,902
)
(1,713
)
Purchase of available for sale securities
(39,252
)
(9,301
)
(11,331
)
126. Sale and maturity of available for sale securities
7,680
8,208
17,511
Net cash used in investing activities
(51,157
)
(16,808
)
(16,364
)
CASH FLOWS FROM FINANCING ACTIVITIES:
128. Net cash used in financing activities
(36,597
)
(41,011
)
(38,548
)
Increase (decrease) in cash and cash equivalents
(37,364
)
24,986
22,082
Cash and cash equivalents at beginning of year
115,976
90,990
68,908
129. Cash and cash equivalents at end of year
$78,612
$115,976
$90,990
Supplemental cash flow information
Income taxes paid
$16,906
131. (The accompanying notes are an integral part of these
statements.)
Based on the information contained in these financial
statements, compute the following 2011 values for each
company. (Round answers to 1 decimal place, e.g. 15.2.)
(1)
Accounts receivable turnover. (For Tootsie Roll, use “Net
product sales.” Assume all sales were credit sales.)
(2)
Average collection period for accounts receivable.
Tootsie Roll
Hershey Company
Accounts receivable turnover
times
times
Average collection period
days
days