Prediction of pile settlement has been a major challenge to geotechnical engineering researchers and professionals, due to the nonlinear behavior of the soil. This paper focuses on developing a predictive model for determining settlement time response of pile load tests from the coastal region of Nigeria. Non parametric statistical analysis was carried out on the load settlement response data of static load test of piles from five locations in Lagos metropolis, Nigeria. Regression analysis was done on the predictive settlement data to determine the required predictive model. The maximum settlement observed was 9.991 mm with a mean value of 7.892 mm. A significant correlation of more than 50 existed for the various settlement data. Consequently, a predictive model was developed for determining settlement time response of static pile load tests. Akpila S. B. | Jaja G. W. T. ""Time Dependent Settlement Response Model of Tested Piles in Coastal Region of Nigeria"" Published in International Journal of Trend in Scientific Research and Development (ijtsrd), ISSN: 2456-6470, Volume-3 | Issue-3 , April 2019, URL: https://www.ijtsrd.com/papers/ijtsrd23306.pdf
Paper URL: https://www.ijtsrd.com/engineering/civil-engineering/23306/time-dependent-settlement-response-model-of-tested-piles-in-coastal-region-of-nigeria/akpila-s-b
2. International Journal of Trend in Scientific Research and Development (IJTSRD) @ www.ijtsrd.com eISSN: 2456-6470
@ IJTSRD | Unique Paper ID – IJTSRD23306 | Volume – 3 | Issue – 3 | Mar-Apr 2019 Page: 1344
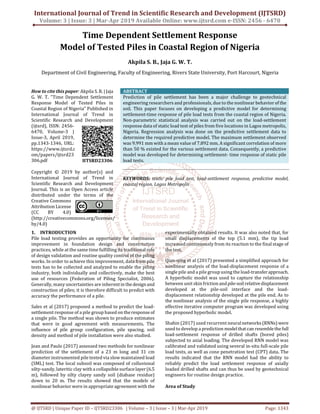
The study area is situated in Lagos, Nigeria with latitude
6.465422°N and longitude 3.406448°E with the gps
coordinates of 6° 27' 55.5192'' N and 3° 24'23.2128'' E
shown in Figure 1. Static Pile load tests were carried out on
five locations within the study area. The locations include
Lekki Phase 1, Ikorodu, Lekki, Aja and Onikan as shown in
Figure 2.
Figure1. Map showing the study area.
(Source: Google Maps, 2019)
Figure 2: Map showing the locations of the static pile load
test within the study area. (Source: Google Maps, 2019)
2. Materials and Methods
Static Load Test
Static load test of a pile or group of piles is used to establish
an allowable load. Static load test were carried out on piles
located in include Lekki Phase 1, Ikorodu, Lekki, Aja and
Onikan. The applied load is usually maximum of 150 % to
200 % of the design safe working load. The Primary
objectives of Static load test are;
To establish load-deflection relationships in thepile-soil
system,
To determine capacity of the pile-soil system, and
To determine load distribution in the pile-soil system.
These tests will confirm design assumptions or provide
information to allow those assumptions and the pile design
to be modified (Geotechnical Engineering Bureau, 2007).
Equipment and Instrumentation for Static Load Test
Major equipment required for applying compressiveload on
a test pile generally include, but are not limited to the
following:
1. test beams - primary and secondary
2. bearing plates
3. Hydraulic jack of appropriate capacity (800tons);
connected to hydraulic pump
4. Oil manometer of suitable capacity
5. Kentledge or Dead weights (normally in form of
concrete cubes of 1m3 and 24 kN or 2.4 tons), etc.
6. nos. steel reference beams
7. Nos. dial gauges, capable of measuring movements
within an accuracy of 0.01mm.
Arrangement of Load Test Platform
The arrangement for an axial compression test is generally
done using either;
(a) By means of a jack which obtains its reaction from
kentledge heavier than the required test load
(b) By means of jack which obtains itsreaction fromtension
piles or other suitable anchors (section 7.5.5.2 of BS
8004; 1986).
Pile Load Test Procedure
The pile load test involves the application of the load in
stages, with the load at each stagebeingmaintainedconstant
until the resulting settlement of the pile virtually ceases
before the application of the next load increment.
Maximum load to be applied on a single pile for this method
will not exceed 2.0 x safe working load. The loadisapplied in
increments of 25 % of the design load. Each load increment
is maintained until the rate of settlement is not greater than
0.05 mm /30 minutes or until a maximum of about 2 hours
have elapsed, whichever occurs first.
The maximum load is maintained on the pile for 6 hours,
except in the event that the average rate of settlement is not
greater than 0.05 mm /30 minutes. Unloading of pile isdone
in decrements of 25 % of the maximum load or as specified
by the client.
3. Results and Discussion
Figure 3 shows the settlement measured from the static pile
load tests at Lekki Phase 1, Ikorodu, Lekki , Aja and Onikan.
It can be observed from Figure 3 that Aja has the least
settlement values whereas the highest settlement values
where observed in Ikorodu. Table 1 shows that the
maximum settlement observed from the various settlement
was 9.991 mm with a mean value of 7.892 mm.
Figure 3: Settlement measured from static pile load tests
from the various locations.
3. International Journal of Trend in Scientific Research and Development (IJTSRD) @ www.ijtsrd.com eISSN: 2456-6470
@ IJTSRD | Unique Paper ID – IJTSRD23306 | Volume – 3 | Issue – 3 | Mar-Apr 2019 Page: 1345
Table 1: Descriptive statistics of settlement measured from static pile load test
Test Type LEKKI IKORODU LEKKI PHASE 1 AJA ONIKAN
Mean 2.94132 7.89220 5.468 2.92067 5.4934
Standard Error 0.46096 0.34550 0.18162 0.3453
Median 3.097 8.876 5.0725 2.463 5.073
Mode 2.4625 8.775 5.0725 2.463 5.073
Standard Deviation 1.13692 2.87868 2.15766 1.1342 2.1564
Sample Variance 1.29258 8.28679 4.65548 1.2865 4.6499
Kurtosis -0.3194 2.22868 -0.1844 -0.3184 -0.151
Skewness -0.4493 -1.9201 -0.4734 -0.3887 -0.511
Range 4.43 9.991 8.23 4.47 8.23
Minimum 0 0 0 0 0
Maximum 4.43 9.991 8.23 4.47 8.23
Sum 114.716 307.8 213.252 113.91 214.24
Count 39 39 39 39 39
Confidence Level (95.0%) 0.3686 0.9332 0.6994 0.36767 0.69901
In order to develop a model to predict the settlement from static pile load test in the coastal region of Nigeria, a predicted
settlement which is the mean settlement observed from the static pile load tests at Lekki Phase 1, Ikorodu, Lekki, Aja and
Onikan at the same time interval is assumed. Kendall’s tau_b test which is a non-parametric test is used to check forsignificant
correlations between the settlement measured from static pile load tests from the various locations and the predicted
settlement. Table 2 shows the result of the Kendall’s tau_b test on the settlement data and a significant correlation of more
than 50 % existed for the various settlement data.
Based on the significant correlation of the settlement data from the Kendall’s tau_b the values from the calculated predicted
settlement will be used for modelling the relationship between the settlement and time for soils from the coastal region of
Nigeria. Figure 4 shows the relationship between the settlement and time for predicted settlement of soils from the coastal
region of Nigeria.
.
Table 2: Kendall’s tau b correlation of settlement measured from static pile load tests
Test
Time
(Hrs)
Lekki Ikorodu
Lekki
Phase 1
Aja Onikan
Predicted
Settlement
(Mm)
Kendall's
tau_b
TIME (hrs)
Correlation
Coefficient
1.000 .534** .514** .738** .534** .774** .657**
Sig. (2-tailed) .000 .000 .000 .000 .000 .000
N 39 39 39 39 39 39 39
LEKKI
Correlation
Coefficient
.534** 1.000 .595** .536** .932** .562** .796**
Sig. (2-tailed) .000 .000 .000 .000 .000 .000
N 39 39 39 39 39 39 39
IKORODU
Correlation
Coefficient
.514** .595** 1.000 .552** .570** .512** .594**
Sig. (2-tailed) .000 .000 .000 .000 .000 .000
N 39 39 39 39 39 39 39
LEKKI PHASE 1
Correlation
Coefficient
.738** .536** .552** 1.000 .577** .962** .742**
Sig. (2-tailed) .000 .000 .000 .000 .000 .000
N 39 39 39 39 39 39 39
AJA
Correlation
Coefficient
.534** .932** .570** .577** 1.000 .603** .783**
Sig. (2-tailed) .000 .000 .000 .000 .000 .000
N 39 39 39 39 39 39 39
ONIKAN
Correlation
Coefficient
.774** .562** .512** .962** .603** 1.000 .767**
Sig. (2-tailed) .000 .000 .000 .000 .000 .000
N 39 39 39 39 39 39 39
PREDICTED
SETTLEMENT
(mm)
Correlation
Coefficient
.657** .796** .594** .742** .783** .767** 1.000
Sig. (2-tailed) .000 .000 .000 .000 .000 .000
N 39 39 39 39 39 39 39
4. International Journal of Trend in Scientific Research and Development (IJTSRD) @ www.ijtsrd.com eISSN: 2456-6470
@ IJTSRD | Unique Paper ID – IJTSRD23306 | Volume – 3 | Issue – 3 | Mar-Apr 2019 Page: 1346
Figure 4: Relationship between the settlement and time
for predicted settlement
In Figure 3, there is a positive relation between the
settlement and time with an R2 correlation coefficient of
0.8567. The predictive model is given in Equation 1 as
follows;
(R2 = 0.8567) (1)
4. Conclusion
Based on the results of this study, the following conclusions
are drawn:
1. The maximum settlement observed from the various
settlement from the coastal region of Nigeria was 9.991
mm with a mean value of 7.892 mm.
2. A significant correlation of more than 50 % existed for
the various settlement datafrom various locationsinthe
coastal region of Nigeria.
3. A positive correlation exists between settlement and
time with an R2 correlation coefficient of 0.8567. The
predictive model of Equation 1 may be used to evaluate
pile settlement.
4.1 Recommendations
Based on the results of this study, itisrecommendedthatthe
predictive model developed in this study should be used in
predicting settlement- time response of static pile loadtests.
5. References
[1] British Standard Code of Practice for Foundations BS
8004: (1996).
[2] GeotechnicalEngineeringBureau.(2007).Geotechnical
Control Procedure. New York State Department of
Transportation.
[3] Federation of Piling Specialists (2006). Handbook on
pile load testing. Forum Court, Bromley, UK.
[4] Garcia, J. R. & Rocha-de Albuquerque P.J. (2018).Model
of nonlinear behavior applied to prediction of
settlement in deep foundations. DYNA, 85(205), pp.
171-178, June, 2018.
[5] Google (2019). Retrieved from
https://espace.curtin.edu.au, 14th February, 2019.
[6] Qian-qing, Z., Shu-cai, L., Fa-yun, L., Min, Y., & Qian, Z.
(2014). Simplified method for settlement predictionof
single pile and pile group using a hyperbolic model.
International JournalofCivilEngineering Transaction B:
Geotechnical Engineering, Vol. 12, No. 2, 146-159
[7] Sales, M.M., Prezzi, M., Salgado, R., Choi, Y. S., & Lee, J.
(2017). Load-Settlement Behaviour of Model Pile
Groups in Sand under Vertical Load. Journal of Civil
Engineering and Management, 23(8), 1148–1163.
https://doi.org/10.3846/13923730.2017.1396559.
[8] Shahin, M. A. (2017). Load-Settlement Modeling of
Axially Loaded Drilled Shafts 26 using CPT-Based
Recurrent Neural Networks. Technical Note.
Department of Civil Engineering, Curtin University,
Australia.