SlideShare a Scribd company logo
1 of 5
Download to read offline
Anant Shree Agrawal / International Journal of Engineering Research and Applications
                      (IJERA)         ISSN: 2248-9622 www.ijera.com
                      Vol. 2, Issue4, July-August 2012, pp.1208-1212
                Task Prioritization Rules For Project Execution
                                         Anant Shree Agrawal
                                     Consultant, Vector Consulting Group
        Vector Consulting Group is India's leading consulting firm in the space of Theory of Constraints.
                                                +91-9819575898

ABSTRACT                                                   completion percentage into three zones of Red,
         This paper provides a substantially better        Yellow and Green. If the conflicting tasks occur on
way to prioritize the tasks within a multi-project         chains, which are in different color zones, the task in
environment than the one currently advocated by            the red chain gets higher priority over the task in the
Critical Chain Project Management and used by              yellow chain, which in turn gets higher priority over
its practitioners. This new method differs from the        the task in the green chain. If the two tasks occur on
currently accepted method on two grounds.                  the chains, which are in the same color zone, CCPM,
Firstly, it results in significantly high probability      at best, says that doing any task first is equally
of achieving a faster project completion, and              acceptable.
secondly, it makes the task priority signals far
more objective and easy to derive. The author uses           A           B
a computer simulation to check 970987 possible                                    FB
cases of a resource conflict occurring within a
project and compares the resulting lead-time from
the generally accepted task prioritization method
of CCPM and the proposed new rule of task
prioritization within a project.                             C                    D      E               PB


Keywords:        Multi-project  environment,    task
prioritization,       Critical   Chain       Project
Management(CCPM), feeding buffer, buffer based
                                                             F      G        FB
priorities, resource conflicts.

1.INTRODUCTION                                             Figure 1: Sample Project network
Resource conflicts are extremely common occurrence
within any multi project environment. Even after           For example, if a project network as shown in figure
completely eliminating all possible resource conflicts     1, has Task A and Task F which are to be done by the
using resource leveling during the project-planning        same resource, CCPM recommends following
phase, reasonable common cause variation                   procedure.
(uncertainty, or statistical fluctuations) can result in        a. Calculate the expected remaining duration
resource conflicts from time to time during execution               of each of the chains on which the two tasks
phase. Project managers normally lack any objective                 lie.
decision making criteria in such situations and                 b. Calculate the buffer duration available for
generally rely on their experience or other subjective              each chain based on the remaining duration
criteria to make decision in such cases. CCPM                       calculated in step 1.
provides an objective decision making rule in such              c. Compute         the    ratio    ‘%      Buffer
situations. Fundamentally it advocates that a task on               Consumption=(Planned buffer duration –
critical chain always gets higher priority than all                 Buffer duration available)/Planned buffer
other tasks of the project. For two or more tasks                   duration.
occurring on feeding chains, it advocates looking at            d. Also       compute        the     ratio    ‘%
the ratio of feeding buffer consumption percentage to               Completion=(Planned chain duration –
chain completion percentage of the contesting                       Remaining chain duration)/Planned chain
feeding chains (assuming conflicting tasks are on                   duration.
feeding chains) and giving higher priority to the task          e. Plot the value of the two ratios on the fever
with higher ratio.                                                  chart shown below.
                                                                f. Divide the fever chart into 3 zones of Red,
2. PRIORTISING TASKS IN A SINGLE                                    Yellow and Green as shown in figure2.
PROJECT ENVIRONMENT USING CCPM                                  g. All the tasks of the respective chains get the
In most of the literature on CCPM, e.g., Critical                   color of the band where the point
Chain (1997), Newbold (1998), Simpson and Lynch                     corresponding to the % Buffer Consumption
(1999), Homer (1998), and Leach (1999) have                         and % Completion lies on the fever chart.
advocated dividing the various possible combinations            h. The task priority of task to be followed is
of feeding buffer consumption percentage and chain                  red, yellow and green in that order.

                                                                                                  1208 | P a g e
Anant Shree Agrawal / International Journal of Engineering Research and Applications
                      (IJERA)         ISSN: 2248-9622 www.ijera.com
                      Vol. 2, Issue4, July-August 2012, pp.1208-1212

                                                           project lead-time by following the above two rules,
                                                           the following assumptions are made.
                                                                a. There will be no other resource conflict in
                                                                    the project other than the one under
                                                                    consideration. This assumption is valid
                                                                    because CCPM methodology demands
                                                                    removal of almost all the resource conflicts
                                                                    during the project-planning phase.
                                                                b. The conflicting tasks occur on two different
                                                                    feeding chains integrating at two different
                                                                    points on the critical chain.
                                                           With these two assumptions, a project network,
                                                           whose results can be impacted by the two different
                                                           decision-making rules, can be made as follows:

                                                             A           B

                                                                                  FB


Figure 2: A fever chart
                                                             C                    D      E               PB
There are several critiques to the above methodology.
Tzvi Raz, Dov Dvir and Robert Barnes (2003) say
that buffer penetration, is defined as the amount of
time running from the original start date of the buffer
                                                             F      G        FB
on the critical chain or one of the feeding chains, as
appropriate, to the projected end date of the last task
on the corresponding chain. The projected dates are
based on estimates of the ‘duration left’ for the tasks.   Figure 3: Project network used in the simulation
The estimation of how much work remains to be
done is also subjected to inflation by safety margins –    Figure 3 illustrates the project network used for
the very same problem CCPM attempted to solve by           simulating the lead times achieved by following the
using buffers. Moreover, the estimate of ‘duration         two different task priority rules. Task A and Task F
left’ is highly subjective, and varies significantly for   are to be done by the same resource and there is a
different people involved with the same project. This      conflict of priority. By checking the different
gives rise to lot skepticism and lack of confidence for    possible durations of each of the task and chain in the
the task priorities derived by this algorithm in the       project network, the impact of the two different
members of the project team.                               decision-making rules, in all the possible situations
                                                           can be studied. In other words, this is the most
3.1 RULE BASED ON INTEGRATION POINT                        generalized project network to study the impact of
POSITION FOR SINGLE PROJECTS                               the decision-making rules under consideration.
The rule that was found to give much better results        The following sets of conditions are studied.
than the above mentioned CCPM task prioritization               a. When task A and task F are in same color
rule is as follows.                                                  band
If the two conflicting tasks occur on two feeding               b. When task A is in Red and task F is in
chains, which integrate with the critical chain at two               Yellow or Green & when task A is in
different points, then the task on the feeding chain,                Yellow and task F is in Green
which integrates earlier with the critical chain, gets     For all the above cases, the buffer consumption based
higher priority over the task in the chain that            priority rule can give opposite priority to the
integrates later with the critical chain. If the two       integration point position based priority rule.
conflicting tasks occur on two feeding chains, which       Since the critical chain completion percentages for
integrate at the same point with the critical chain,       both the chains are 0%, it is assumed that 0% to 10%
then doing any task first is equally acceptable.           buffer consumption is Green band, 10% to 20%
                                                           buffer consumption is Yellow band and 20% and
                                                           higher is Red band (CCPM suggests to keep the color
3.2 THE SIMULATION INVOLVING A SINGLE                      bands biased towards red zone for smaller chain
PROJECT                                                    completion percentages).
In order to check the difference in the resulting


                                                                                                  1209 | P a g e
Anant Shree Agrawal / International Journal of Engineering Research and Applications
                       (IJERA)         ISSN: 2248-9622 www.ijera.com
                       Vol. 2, Issue4, July-August 2012, pp.1208-1212

                                                                   position based priority rule gave a shorter lead-time
                                                                   by 24% to 26%
----------------------------------------------------------------   For the 323486 cases found where task A and task F
 THE RANGE OF TASK DURATIONS                                       were in the different color band and the two rules
STUDIED IN THE SIMULATION                                          gave opposite result, the following is the frequency
----------------------------------------------------------------   distribution of percentage difference in the lead time
Task A – 1 to 21 days                                              of project by following the buffer priority rule and
Chain B – 10 to 100 days in steps of 3                             the integration point position based priority rule was
Chain C – 10 to 100 days in steps of 3                             observed.
Chain D – 10 to 100 days in steps of 3
Task F – 1 to 21 days                                                    Upper Limit           Frequency
Chain G – 10 to 100 days in steps of 3                                   -8                    33
----------------------------------------------------------------
For the 647501 cases found where both task A and                         -6                    62
task F were in the same color band, the following is                     -4                    140
the frequency distribution of percentage difference in                   -2                    399
the lead time of project by following the buffer
priority rule and the integration point position based                   0                     287352
priority rule was observed.                                              2                     13289
                                                                         4                     9339
      Upper Limit                    Frequency                           6                     5843
      -10                            4                                   8                     3203
      -8                             11                                  10                    1758
      -6                             48                                  12                    936
      -4                             92                                  14                    537
      -2                             241                                 16                    273
      0                              571911                              18                    150
      2                              22587                               20                    108
      4                              20465                               22                    37
      6                              13614                               24                    23
      8                              8309                                26                    3
      10                             4533                                28                    1
      12                             2747
                                                                   Figure 5: Frequency distribution of difference in
      14                             1416
                                                                   project lead times for cases where task A and task
      16                             695                           B are in the different color band.
      18                             431
                                                                   It looks very clear from the above result that both the
      20                             248                           probability of achieving a lower lead time &
      22                             100                           magnitude of the reduction in lead time, is favorable
      24                             33                            in the case of following an integration point position
                                                                   based priority rule rather than the rule currently
      26                             16                            advocated by CCPM.

Figure 4: Frequency distribution of difference in                  4. PRIORTISING TASKS IN A MULTI-
project lead times for cases where both task A and                 PROJECT ENVIRONMENT USING CCPM
task B are in the same color band.                                 In the case when the conflicting tasks occur on
                                                                   feeding chains of two different projects, the available
In figure 4, upper limit of -10 and frequency 4 means              literature on Critical Chain Project Management is
that there were 4 cases found where the integration                not very explicit of the rule to be followed. The
point position based priority rule gave a longer lead              author’s experience with many CCPM software show
time by 10% to 12% of buffer priority rule. Similarly              that most of them do task prioritization with
Upper limit of 26 and frequency 16 means that there                following methodology.
were 16 cases found where the integration point                         a. Color the tasks on the critical chain of the


                                                                                                          1210 | P a g e
Anant Shree Agrawal / International Journal of Engineering Research and Applications
                      (IJERA)         ISSN: 2248-9622 www.ijera.com
                      Vol. 2, Issue4, July-August 2012, pp.1208-1212

         project with dark red, dark yellow or dark        other resource conflict in the project other than the
         green based on the zone in which the              one under consideration. This assumption is valid
         %Buffer Consumption and % Completion of           because CCPM methodology demands removal of
         critical chain lie on the fever chart.            almost all the resource conflicts during the project-
    b.   Color the tasks on the feeding chains of the      planning phase.
         project with light red, light yellow and light
         green based on the zone in which %Buffer
         Consumption and % Completion of                     A               B
         individual feeding chains lie on the fever                                       FB
         chart.
    c.   The tasks are then prioritized in the order
                                                             C                                      F
         of dark red, dark yellow, dark green, light                                                               PB
         red, light yellow, light green.

Some software, while doing the above steps, keep the         D           E                FB
position of the feeding buffers fixed all throughout
the execution of the project irrespective of the status
of the critical chain, while other keep the position of
the feeding buffers floating along the timeline              G               H           FB
depending upon the updated status of the critical
chain. Some software completely ignore the status of
the feeding buffer in case a feeding chain starts to
intrude into the project buffer and color the feeding        I                                      L
chains dark red, dark yellow or dark green depending                                                               PB
on the incursion of feeding chain into the project
buffer, while others always look at feeding buffer
status to color the feeding chains.                          J           K
All the above task prioritization methods inevitably                                      FB
lead to situations when tasks of different projects get
mixed up with each other. That means that one
resource can have task of project A as the highest         Figure 6: Project network used in simulation
priority task and task of project B as lower priority
task whereas another resource can have task of             Figure 6 illustrates the two project networks used for
project B as the highest priority task and task of         simulating the lead times achieved by following the
project A as lower priority task. Also, a resource can     two different task priority rules. Task A and Task J
have one task of Project A as highest priority task,       are to be done by the same resource and there is a
then a task of project B and then again another task of    conflict of priority. Similarly, Task D and Task G are
project A. These situations are completely counter         to be done by a different resource and there is a
conducive to achieve synchronization of different          conflict of priority. By checking the different
resources and inevitably leads to inflation of project     possible durations of each of the task and chain in the
lead times.                                                project network, the impact of the two different
                                                           decision-making rules can be studied.
4.1 RULE BASED ON PROJECT PRIORITY
FOR MULTIPLE PROJECTS                                      The conditions when task A and task J both are in
The task prioritization rule that was found to give        light red color band is studied. In this situation,
much better results than the above-mentioned CCPM          either the buffer color priority system will mix the
rule is as follows. Priority of tasks of two or more       tasks of the two projects (if other tasks are of light
projects should never be mixed up. That means that if      yellow or light green) or it will be neutral towards
one task of a project A has higher priority than           doing any task in preference to any other (if other
another task of project B, then all the tasks of project   tasks are also of light red color).
A must have higher priority than all the tasks of          ----------------------------------------------------------------
project B for all the resources.                           THE RANGE OF TASK DURATIONS STUDIED
                                                           IN THE SIMULATION
4.11 THE SIMULATION WITH TWO                               ----------------------------------------------------------------
PROJECTS                                                   Task A – 3 to 8 days
In order to check the difference in the resulting          Chain B – 3 to 8 days
project lead-time by following the above two rules,        Chain C – 3 to 8 days
the following assumptions are made. There will be no       Task D – 3 to 8 days


                                                                                                         1211 | P a g e
Anant Shree Agrawal / International Journal of Engineering Research and Applications
                       (IJERA)         ISSN: 2248-9622 www.ijera.com
                       Vol. 2, Issue4, July-August 2012, pp.1208-1212

Chain E – 3 to 8 days                                             point position based priority rule gave a longer lead
Task G – 3 to 8 days                                              time by 6% to 4% of buffer priority rule. Similarly
Chain H – 3 to 8 days                                             Upper limit of 22 and frequency 3 means that there
Chain I – 3 to 8 days                                             were 3 cases found where the integration point
Task J – 3 to 8 days                                              position based priority rule gave a shorter lead-time
Chain K – 3 to 8 days                                             by 20% to 22%.
---------------------------------------------------------------
For the 1498 cases found where both task A and task               5.CONCLUSION
J were in the red color band, the following is the                The integration point position based priority rule &
frequency distribution of percentage difference in the            the rule of never mixing up tasks of different projects
lead time of project by following the buffer priority             while prioritizing, gives a better result than buffer
rule and the integration point position based priority            priority rule in far more number of cases. Also, the
rule was observed.                                                quanta of benefits are more for the rules compared to
                                                                  the buffer priority rule. Since project environments
              Upper Limit        Frequency                        are known to be highly uncertain and variations in
              -4                 9                                task lead times is quite common, a rule that is more
                                                                  likely (higher probability) to give a better result must
              -2                 0                                be followed even though in a certain particular case,
              0                  61                               some other rule seems to give a better result. Since
                                                                  the new rules have higher probability of giving a
              2                  0
                                                                  shorter lead-time for a project, these rules should be
              4                  0                                preferred over the current buffer based task
              6                  285                              prioritization rule.
              8                  0
                                                                  6. MANAGERIAL IMPLICATIONS
              10                 477                              The new rules of task prioritization, as proposed in
              12                 30                               this paper, especially the rule for task prioritization
                                                                  within single projects based on the position of
              14                 357
                                                                  integration point, apart from the obvious effect of
              16                 145                              shortening the project lead time, will drastically
              18                 97                               improve the acceptability of the change within the
                                                                  project team and save invaluable time which would
              20                 34                               have otherwise been spent on resolving conflicts
            22              3                                     occurring due to a flawed rule and the subjectivities
Figure 7: Frequency distribution of difference in                 involved in its method of calculation. The second rule
project lead times for simulation involving the two               of task priorities in multiple projects, based on the
projects.                                                         project priority, simplifies the task priority
                                                                  calculations, makes them more intuitive and easy to
In figure 7, upper limit of -4 and frequency 9 means              follow for everyone involved.
that there were 9 cases found where the integration

REFERENCE
   1. Goldratt, Eliyahu M., Critical Chain, North River, Great Barrington, MA , 1997
   2. http://www.toc-goldratt.in/product/TOC-Insights, Project Management and Engineering Insights.
   3. Tzvi Raz, Dov Dvir and Robert Barnes, A Critical Look At Critical Chain Project Management, Project
       Management Journal, December 2003
   4. Leach, L (1999), Critical chain project management improves project performance. Project
       Management Journal.
   5. Newbold, R.C. (1998). Project Management in the Fast Lane. Boca Raton, FL: The St. Lucie Press.
   6. Simpson, W.P. & Lynch, W.(1999), Critical success factors in critical chain project management.
       Proceedings of the 30th Annual Project Management Institute, Seminars & Symposium. CD-ROM,
       Newton Square, PA: Project Management Institute.
   7. Goldratt, Eliyahu M., The Goal, North River Press, Croton-on Hudson, New York, 1984
   8. Goldratt, Eliyahu M., THE HAYSTACK SYNDROME, North River Press, Croton-on Hudson, New
       York, 1990
   9. http://www.toc-goldratt.in/product/TOC-Insights, Project Management and Engineering Insights.
   10. Project Management Institute Standards Committee, A Guide to the Project Management Body of
       Knowledge, 1996.


                                                                                                          1212 | P a g e

More Related Content

What's hot

Sequentail Max Search (SMS) resouce allocation algorithm
Sequentail Max Search (SMS) resouce allocation algorithm Sequentail Max Search (SMS) resouce allocation algorithm
Sequentail Max Search (SMS) resouce allocation algorithm amal algedir
 
PERFORMANCE FACTORS OF CLOUD COMPUTING DATA CENTERS USING [(M/G/1) : (∞/GDMOD...
PERFORMANCE FACTORS OF CLOUD COMPUTING DATA CENTERS USING [(M/G/1) : (∞/GDMOD...PERFORMANCE FACTORS OF CLOUD COMPUTING DATA CENTERS USING [(M/G/1) : (∞/GDMOD...
PERFORMANCE FACTORS OF CLOUD COMPUTING DATA CENTERS USING [(M/G/1) : (∞/GDMOD...ijgca
 
An Improved Parallel Activity scheduling algorithm for large datasets
An Improved Parallel Activity scheduling algorithm for large datasetsAn Improved Parallel Activity scheduling algorithm for large datasets
An Improved Parallel Activity scheduling algorithm for large datasetsIJERA Editor
 
Formal Specification and Verification of Total Order Broadcast through Destin...
Formal Specification and Verification of Total Order Broadcast through Destin...Formal Specification and Verification of Total Order Broadcast through Destin...
Formal Specification and Verification of Total Order Broadcast through Destin...ijcsit
 
Ieeepro techno solutions ieee java project - budget-driven scheduling algor...
Ieeepro techno solutions   ieee java project - budget-driven scheduling algor...Ieeepro techno solutions   ieee java project - budget-driven scheduling algor...
Ieeepro techno solutions ieee java project - budget-driven scheduling algor...hemanthbbc
 
New Fault Tolerance Approach using Antecedence Graphs in Multi Agent Systems
New Fault Tolerance Approach using Antecedence Graphs in Multi Agent SystemsNew Fault Tolerance Approach using Antecedence Graphs in Multi Agent Systems
New Fault Tolerance Approach using Antecedence Graphs in Multi Agent SystemsIDES Editor
 
Optimizing Intelligent Agents Constraint Satisfaction with ...
Optimizing Intelligent Agents Constraint Satisfaction with ...Optimizing Intelligent Agents Constraint Satisfaction with ...
Optimizing Intelligent Agents Constraint Satisfaction with ...butest
 
An Index-first Addressing Scheme for Multi-level Caches
An Index-first Addressing Scheme for Multi-level CachesAn Index-first Addressing Scheme for Multi-level Caches
An Index-first Addressing Scheme for Multi-level Cachesidescitation
 
A MULTI-OBJECTIVE PERSPECTIVE FOR OPERATOR SCHEDULING USING FINEGRAINED DVS A...
A MULTI-OBJECTIVE PERSPECTIVE FOR OPERATOR SCHEDULING USING FINEGRAINED DVS A...A MULTI-OBJECTIVE PERSPECTIVE FOR OPERATOR SCHEDULING USING FINEGRAINED DVS A...
A MULTI-OBJECTIVE PERSPECTIVE FOR OPERATOR SCHEDULING USING FINEGRAINED DVS A...VLSICS Design
 

What's hot (12)

Sequentail Max Search (SMS) resouce allocation algorithm
Sequentail Max Search (SMS) resouce allocation algorithm Sequentail Max Search (SMS) resouce allocation algorithm
Sequentail Max Search (SMS) resouce allocation algorithm
 
Dn32717720
Dn32717720Dn32717720
Dn32717720
 
PERFORMANCE FACTORS OF CLOUD COMPUTING DATA CENTERS USING [(M/G/1) : (∞/GDMOD...
PERFORMANCE FACTORS OF CLOUD COMPUTING DATA CENTERS USING [(M/G/1) : (∞/GDMOD...PERFORMANCE FACTORS OF CLOUD COMPUTING DATA CENTERS USING [(M/G/1) : (∞/GDMOD...
PERFORMANCE FACTORS OF CLOUD COMPUTING DATA CENTERS USING [(M/G/1) : (∞/GDMOD...
 
An Improved Parallel Activity scheduling algorithm for large datasets
An Improved Parallel Activity scheduling algorithm for large datasetsAn Improved Parallel Activity scheduling algorithm for large datasets
An Improved Parallel Activity scheduling algorithm for large datasets
 
Formal Specification and Verification of Total Order Broadcast through Destin...
Formal Specification and Verification of Total Order Broadcast through Destin...Formal Specification and Verification of Total Order Broadcast through Destin...
Formal Specification and Verification of Total Order Broadcast through Destin...
 
Ieeepro techno solutions ieee java project - budget-driven scheduling algor...
Ieeepro techno solutions   ieee java project - budget-driven scheduling algor...Ieeepro techno solutions   ieee java project - budget-driven scheduling algor...
Ieeepro techno solutions ieee java project - budget-driven scheduling algor...
 
New Fault Tolerance Approach using Antecedence Graphs in Multi Agent Systems
New Fault Tolerance Approach using Antecedence Graphs in Multi Agent SystemsNew Fault Tolerance Approach using Antecedence Graphs in Multi Agent Systems
New Fault Tolerance Approach using Antecedence Graphs in Multi Agent Systems
 
Optimizing Intelligent Agents Constraint Satisfaction with ...
Optimizing Intelligent Agents Constraint Satisfaction with ...Optimizing Intelligent Agents Constraint Satisfaction with ...
Optimizing Intelligent Agents Constraint Satisfaction with ...
 
D04573033
D04573033D04573033
D04573033
 
An Index-first Addressing Scheme for Multi-level Caches
An Index-first Addressing Scheme for Multi-level CachesAn Index-first Addressing Scheme for Multi-level Caches
An Index-first Addressing Scheme for Multi-level Caches
 
Project doc
Project docProject doc
Project doc
 
A MULTI-OBJECTIVE PERSPECTIVE FOR OPERATOR SCHEDULING USING FINEGRAINED DVS A...
A MULTI-OBJECTIVE PERSPECTIVE FOR OPERATOR SCHEDULING USING FINEGRAINED DVS A...A MULTI-OBJECTIVE PERSPECTIVE FOR OPERATOR SCHEDULING USING FINEGRAINED DVS A...
A MULTI-OBJECTIVE PERSPECTIVE FOR OPERATOR SCHEDULING USING FINEGRAINED DVS A...
 

Viewers also liked

Green generation 15_2-5-14
Green generation 15_2-5-14Green generation 15_2-5-14
Green generation 15_2-5-14sathish2434
 
Trabajo terminado.ppt (2)
Trabajo terminado.ppt (2)Trabajo terminado.ppt (2)
Trabajo terminado.ppt (2)dhlha8991
 
Domótico
DomóticoDomótico
Domóticocollque
 
František kupka
František kupkaFrantišek kupka
František kupkaJason
 
UTE ACordova Estrategia y cultura organizacional en los emprendimientos sociales
UTE ACordova Estrategia y cultura organizacional en los emprendimientos socialesUTE ACordova Estrategia y cultura organizacional en los emprendimientos sociales
UTE ACordova Estrategia y cultura organizacional en los emprendimientos socialesAnitaUTE
 
XNN001 Methods to measure physical activity at the individual and population ...
XNN001 Methods to measure physical activity at the individual and population ...XNN001 Methods to measure physical activity at the individual and population ...
XNN001 Methods to measure physical activity at the individual and population ...ramseyr
 
Proyecto matematicas para SE
Proyecto matematicas para SEProyecto matematicas para SE
Proyecto matematicas para SERamon RC
 
Evo.pp copia
Evo.pp   copiaEvo.pp   copia
Evo.pp copiaTOTO12397
 
Don segundo sombra!
Don segundo sombra!Don segundo sombra!
Don segundo sombra!sofia4314
 
Trabajo teoría dialógica de la educación
Trabajo teoría dialógica de la educaciónTrabajo teoría dialógica de la educación
Trabajo teoría dialógica de la educaciónMCarorivero
 

Viewers also liked (20)

Green generation 15_2-5-14
Green generation 15_2-5-14Green generation 15_2-5-14
Green generation 15_2-5-14
 
Fração1
Fração1Fração1
Fração1
 
Trabajo terminado.ppt (2)
Trabajo terminado.ppt (2)Trabajo terminado.ppt (2)
Trabajo terminado.ppt (2)
 
Domótico
DomóticoDomótico
Domótico
 
František kupka
František kupkaFrantišek kupka
František kupka
 
mongoDBA
mongoDBAmongoDBA
mongoDBA
 
UTE ACordova Estrategia y cultura organizacional en los emprendimientos sociales
UTE ACordova Estrategia y cultura organizacional en los emprendimientos socialesUTE ACordova Estrategia y cultura organizacional en los emprendimientos sociales
UTE ACordova Estrategia y cultura organizacional en los emprendimientos sociales
 
xPlus で実現するモビリティの最大化
xPlus で実現するモビリティの最大化xPlus で実現するモビリティの最大化
xPlus で実現するモビリティの最大化
 
Robomind 1
Robomind 1Robomind 1
Robomind 1
 
XNN001 Methods to measure physical activity at the individual and population ...
XNN001 Methods to measure physical activity at the individual and population ...XNN001 Methods to measure physical activity at the individual and population ...
XNN001 Methods to measure physical activity at the individual and population ...
 
Proyecto matematicas para SE
Proyecto matematicas para SEProyecto matematicas para SE
Proyecto matematicas para SE
 
Volante punto 4
Volante punto 4Volante punto 4
Volante punto 4
 
Evo.pp copia
Evo.pp   copiaEvo.pp   copia
Evo.pp copia
 
XXImo
XXImoXXImo
XXImo
 
Bushmaster
BushmasterBushmaster
Bushmaster
 
Παρουσίαση στο Money Show 2013
Παρουσίαση στο Money Show 2013Παρουσίαση στο Money Show 2013
Παρουσίαση στο Money Show 2013
 
Rio de janeiro vistas aereas
Rio de janeiro vistas aereasRio de janeiro vistas aereas
Rio de janeiro vistas aereas
 
Don segundo sombra!
Don segundo sombra!Don segundo sombra!
Don segundo sombra!
 
Aziz rattensay
Aziz rattensayAziz rattensay
Aziz rattensay
 
Trabajo teoría dialógica de la educación
Trabajo teoría dialógica de la educaciónTrabajo teoría dialógica de la educación
Trabajo teoría dialógica de la educación
 

Similar to Gt2412081212

Overview1) Overview – The continued discussion of project implem.docx
Overview1) Overview – The continued discussion of project implem.docxOverview1) Overview – The continued discussion of project implem.docx
Overview1) Overview – The continued discussion of project implem.docxalfred4lewis58146
 
Overview1) Overview – The continued discussion of .docx
Overview1)             Overview – The continued discussion of .docxOverview1)             Overview – The continued discussion of .docx
Overview1) Overview – The continued discussion of .docxalfred4lewis58146
 
Yagmur Bostanci47 Hackensack Street, East Rutherford, NJ929-22.docx
Yagmur Bostanci47 Hackensack Street, East Rutherford, NJ929-22.docxYagmur Bostanci47 Hackensack Street, East Rutherford, NJ929-22.docx
Yagmur Bostanci47 Hackensack Street, East Rutherford, NJ929-22.docxjeffevans62972
 
Adaptive check-pointing and replication strategy to tolerate faults in comput...
Adaptive check-pointing and replication strategy to tolerate faults in comput...Adaptive check-pointing and replication strategy to tolerate faults in comput...
Adaptive check-pointing and replication strategy to tolerate faults in comput...IOSR Journals
 
Max Min Fair Scheduling Algorithm using In Grid Scheduling with Load Balancing
Max Min Fair Scheduling Algorithm using In Grid Scheduling with Load Balancing Max Min Fair Scheduling Algorithm using In Grid Scheduling with Load Balancing
Max Min Fair Scheduling Algorithm using In Grid Scheduling with Load Balancing IJORCS
 
Project management chapter 11
Project management chapter 11Project management chapter 11
Project management chapter 11VancityInstitute
 
Project management chapter 10
Project management chapter 10Project management chapter 10
Project management chapter 10VancityInstitute
 
352735340 rsh-qam11-tif-12-doc
352735340 rsh-qam11-tif-12-doc352735340 rsh-qam11-tif-12-doc
352735340 rsh-qam11-tif-12-docFiras Husseini
 
352735340 rsh-qam11-tif-12-doc
352735340 rsh-qam11-tif-12-doc352735340 rsh-qam11-tif-12-doc
352735340 rsh-qam11-tif-12-docBookStoreLib
 
Bragged Regression Tree Algorithm for Dynamic Distribution and Scheduling of ...
Bragged Regression Tree Algorithm for Dynamic Distribution and Scheduling of ...Bragged Regression Tree Algorithm for Dynamic Distribution and Scheduling of ...
Bragged Regression Tree Algorithm for Dynamic Distribution and Scheduling of ...Editor IJCATR
 
Ieeepro techno solutions 2014 ieee java project - a hyper-heuristic scheduling
Ieeepro techno solutions   2014 ieee java project - a hyper-heuristic schedulingIeeepro techno solutions   2014 ieee java project - a hyper-heuristic scheduling
Ieeepro techno solutions 2014 ieee java project - a hyper-heuristic schedulinghemanthbbc
 
Ieeepro techno solutions 2014 ieee dotnet project - a hyper-heuristic sched...
Ieeepro techno solutions   2014 ieee dotnet project - a hyper-heuristic sched...Ieeepro techno solutions   2014 ieee dotnet project - a hyper-heuristic sched...
Ieeepro techno solutions 2014 ieee dotnet project - a hyper-heuristic sched...ASAITHAMBIRAJAA
 
Environmental constrained electric power generation and dispatch via genetic ...
Environmental constrained electric power generation and dispatch via genetic ...Environmental constrained electric power generation and dispatch via genetic ...
Environmental constrained electric power generation and dispatch via genetic ...TuhinDas33
 
Procurement principle towards effective management of construction projects
Procurement principle towards effective management of construction projectsProcurement principle towards effective management of construction projects
Procurement principle towards effective management of construction projectseSAT Publishing House
 

Similar to Gt2412081212 (20)

Overview1) Overview – The continued discussion of project implem.docx
Overview1) Overview – The continued discussion of project implem.docxOverview1) Overview – The continued discussion of project implem.docx
Overview1) Overview – The continued discussion of project implem.docx
 
Overview1) Overview – The continued discussion of .docx
Overview1)             Overview – The continued discussion of .docxOverview1)             Overview – The continued discussion of .docx
Overview1) Overview – The continued discussion of .docx
 
Yagmur Bostanci47 Hackensack Street, East Rutherford, NJ929-22.docx
Yagmur Bostanci47 Hackensack Street, East Rutherford, NJ929-22.docxYagmur Bostanci47 Hackensack Street, East Rutherford, NJ929-22.docx
Yagmur Bostanci47 Hackensack Street, East Rutherford, NJ929-22.docx
 
CPM-PERT.ppt
CPM-PERT.pptCPM-PERT.ppt
CPM-PERT.ppt
 
Adaptive check-pointing and replication strategy to tolerate faults in comput...
Adaptive check-pointing and replication strategy to tolerate faults in comput...Adaptive check-pointing and replication strategy to tolerate faults in comput...
Adaptive check-pointing and replication strategy to tolerate faults in comput...
 
E01113138
E01113138E01113138
E01113138
 
Max Min Fair Scheduling Algorithm using In Grid Scheduling with Load Balancing
Max Min Fair Scheduling Algorithm using In Grid Scheduling with Load Balancing Max Min Fair Scheduling Algorithm using In Grid Scheduling with Load Balancing
Max Min Fair Scheduling Algorithm using In Grid Scheduling with Load Balancing
 
Project management chapter 11
Project management chapter 11Project management chapter 11
Project management chapter 11
 
Project management chapter 10
Project management chapter 10Project management chapter 10
Project management chapter 10
 
Isarc2007 4.3 2-065
Isarc2007 4.3 2-065Isarc2007 4.3 2-065
Isarc2007 4.3 2-065
 
Isarc2007 4.3 2-065
Isarc2007 4.3 2-065Isarc2007 4.3 2-065
Isarc2007 4.3 2-065
 
CBArchitect
CBArchitectCBArchitect
CBArchitect
 
352735340 rsh-qam11-tif-12-doc
352735340 rsh-qam11-tif-12-doc352735340 rsh-qam11-tif-12-doc
352735340 rsh-qam11-tif-12-doc
 
352735340 rsh-qam11-tif-12-doc
352735340 rsh-qam11-tif-12-doc352735340 rsh-qam11-tif-12-doc
352735340 rsh-qam11-tif-12-doc
 
Bragged Regression Tree Algorithm for Dynamic Distribution and Scheduling of ...
Bragged Regression Tree Algorithm for Dynamic Distribution and Scheduling of ...Bragged Regression Tree Algorithm for Dynamic Distribution and Scheduling of ...
Bragged Regression Tree Algorithm for Dynamic Distribution and Scheduling of ...
 
Ieeepro techno solutions 2014 ieee java project - a hyper-heuristic scheduling
Ieeepro techno solutions   2014 ieee java project - a hyper-heuristic schedulingIeeepro techno solutions   2014 ieee java project - a hyper-heuristic scheduling
Ieeepro techno solutions 2014 ieee java project - a hyper-heuristic scheduling
 
Ieeepro techno solutions 2014 ieee dotnet project - a hyper-heuristic sched...
Ieeepro techno solutions   2014 ieee dotnet project - a hyper-heuristic sched...Ieeepro techno solutions   2014 ieee dotnet project - a hyper-heuristic sched...
Ieeepro techno solutions 2014 ieee dotnet project - a hyper-heuristic sched...
 
Environmental constrained electric power generation and dispatch via genetic ...
Environmental constrained electric power generation and dispatch via genetic ...Environmental constrained electric power generation and dispatch via genetic ...
Environmental constrained electric power generation and dispatch via genetic ...
 
Omega
OmegaOmega
Omega
 
Procurement principle towards effective management of construction projects
Procurement principle towards effective management of construction projectsProcurement principle towards effective management of construction projects
Procurement principle towards effective management of construction projects
 

Gt2412081212

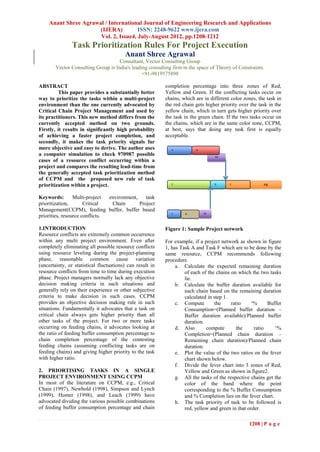
  • 1. Anant Shree Agrawal / International Journal of Engineering Research and Applications (IJERA) ISSN: 2248-9622 www.ijera.com Vol. 2, Issue4, July-August 2012, pp.1208-1212 Task Prioritization Rules For Project Execution Anant Shree Agrawal Consultant, Vector Consulting Group Vector Consulting Group is India's leading consulting firm in the space of Theory of Constraints. +91-9819575898 ABSTRACT completion percentage into three zones of Red, This paper provides a substantially better Yellow and Green. If the conflicting tasks occur on way to prioritize the tasks within a multi-project chains, which are in different color zones, the task in environment than the one currently advocated by the red chain gets higher priority over the task in the Critical Chain Project Management and used by yellow chain, which in turn gets higher priority over its practitioners. This new method differs from the the task in the green chain. If the two tasks occur on currently accepted method on two grounds. the chains, which are in the same color zone, CCPM, Firstly, it results in significantly high probability at best, says that doing any task first is equally of achieving a faster project completion, and acceptable. secondly, it makes the task priority signals far more objective and easy to derive. The author uses A B a computer simulation to check 970987 possible FB cases of a resource conflict occurring within a project and compares the resulting lead-time from the generally accepted task prioritization method of CCPM and the proposed new rule of task prioritization within a project. C D E PB Keywords: Multi-project environment, task prioritization, Critical Chain Project Management(CCPM), feeding buffer, buffer based F G FB priorities, resource conflicts. 1.INTRODUCTION Figure 1: Sample Project network Resource conflicts are extremely common occurrence within any multi project environment. Even after For example, if a project network as shown in figure completely eliminating all possible resource conflicts 1, has Task A and Task F which are to be done by the using resource leveling during the project-planning same resource, CCPM recommends following phase, reasonable common cause variation procedure. (uncertainty, or statistical fluctuations) can result in a. Calculate the expected remaining duration resource conflicts from time to time during execution of each of the chains on which the two tasks phase. Project managers normally lack any objective lie. decision making criteria in such situations and b. Calculate the buffer duration available for generally rely on their experience or other subjective each chain based on the remaining duration criteria to make decision in such cases. CCPM calculated in step 1. provides an objective decision making rule in such c. Compute the ratio ‘% Buffer situations. Fundamentally it advocates that a task on Consumption=(Planned buffer duration – critical chain always gets higher priority than all Buffer duration available)/Planned buffer other tasks of the project. For two or more tasks duration. occurring on feeding chains, it advocates looking at d. Also compute the ratio ‘% the ratio of feeding buffer consumption percentage to Completion=(Planned chain duration – chain completion percentage of the contesting Remaining chain duration)/Planned chain feeding chains (assuming conflicting tasks are on duration. feeding chains) and giving higher priority to the task e. Plot the value of the two ratios on the fever with higher ratio. chart shown below. f. Divide the fever chart into 3 zones of Red, 2. PRIORTISING TASKS IN A SINGLE Yellow and Green as shown in figure2. PROJECT ENVIRONMENT USING CCPM g. All the tasks of the respective chains get the In most of the literature on CCPM, e.g., Critical color of the band where the point Chain (1997), Newbold (1998), Simpson and Lynch corresponding to the % Buffer Consumption (1999), Homer (1998), and Leach (1999) have and % Completion lies on the fever chart. advocated dividing the various possible combinations h. The task priority of task to be followed is of feeding buffer consumption percentage and chain red, yellow and green in that order. 1208 | P a g e
  • 2. Anant Shree Agrawal / International Journal of Engineering Research and Applications (IJERA) ISSN: 2248-9622 www.ijera.com Vol. 2, Issue4, July-August 2012, pp.1208-1212 project lead-time by following the above two rules, the following assumptions are made. a. There will be no other resource conflict in the project other than the one under consideration. This assumption is valid because CCPM methodology demands removal of almost all the resource conflicts during the project-planning phase. b. The conflicting tasks occur on two different feeding chains integrating at two different points on the critical chain. With these two assumptions, a project network, whose results can be impacted by the two different decision-making rules, can be made as follows: A B FB Figure 2: A fever chart C D E PB There are several critiques to the above methodology. Tzvi Raz, Dov Dvir and Robert Barnes (2003) say that buffer penetration, is defined as the amount of time running from the original start date of the buffer F G FB on the critical chain or one of the feeding chains, as appropriate, to the projected end date of the last task on the corresponding chain. The projected dates are based on estimates of the ‘duration left’ for the tasks. Figure 3: Project network used in the simulation The estimation of how much work remains to be done is also subjected to inflation by safety margins – Figure 3 illustrates the project network used for the very same problem CCPM attempted to solve by simulating the lead times achieved by following the using buffers. Moreover, the estimate of ‘duration two different task priority rules. Task A and Task F left’ is highly subjective, and varies significantly for are to be done by the same resource and there is a different people involved with the same project. This conflict of priority. By checking the different gives rise to lot skepticism and lack of confidence for possible durations of each of the task and chain in the the task priorities derived by this algorithm in the project network, the impact of the two different members of the project team. decision-making rules, in all the possible situations can be studied. In other words, this is the most 3.1 RULE BASED ON INTEGRATION POINT generalized project network to study the impact of POSITION FOR SINGLE PROJECTS the decision-making rules under consideration. The rule that was found to give much better results The following sets of conditions are studied. than the above mentioned CCPM task prioritization a. When task A and task F are in same color rule is as follows. band If the two conflicting tasks occur on two feeding b. When task A is in Red and task F is in chains, which integrate with the critical chain at two Yellow or Green & when task A is in different points, then the task on the feeding chain, Yellow and task F is in Green which integrates earlier with the critical chain, gets For all the above cases, the buffer consumption based higher priority over the task in the chain that priority rule can give opposite priority to the integrates later with the critical chain. If the two integration point position based priority rule. conflicting tasks occur on two feeding chains, which Since the critical chain completion percentages for integrate at the same point with the critical chain, both the chains are 0%, it is assumed that 0% to 10% then doing any task first is equally acceptable. buffer consumption is Green band, 10% to 20% buffer consumption is Yellow band and 20% and higher is Red band (CCPM suggests to keep the color 3.2 THE SIMULATION INVOLVING A SINGLE bands biased towards red zone for smaller chain PROJECT completion percentages). In order to check the difference in the resulting 1209 | P a g e
  • 3. Anant Shree Agrawal / International Journal of Engineering Research and Applications (IJERA) ISSN: 2248-9622 www.ijera.com Vol. 2, Issue4, July-August 2012, pp.1208-1212 position based priority rule gave a shorter lead-time by 24% to 26% ---------------------------------------------------------------- For the 323486 cases found where task A and task F THE RANGE OF TASK DURATIONS were in the different color band and the two rules STUDIED IN THE SIMULATION gave opposite result, the following is the frequency ---------------------------------------------------------------- distribution of percentage difference in the lead time Task A – 1 to 21 days of project by following the buffer priority rule and Chain B – 10 to 100 days in steps of 3 the integration point position based priority rule was Chain C – 10 to 100 days in steps of 3 observed. Chain D – 10 to 100 days in steps of 3 Task F – 1 to 21 days Upper Limit Frequency Chain G – 10 to 100 days in steps of 3 -8 33 ---------------------------------------------------------------- For the 647501 cases found where both task A and -6 62 task F were in the same color band, the following is -4 140 the frequency distribution of percentage difference in -2 399 the lead time of project by following the buffer priority rule and the integration point position based 0 287352 priority rule was observed. 2 13289 4 9339 Upper Limit Frequency 6 5843 -10 4 8 3203 -8 11 10 1758 -6 48 12 936 -4 92 14 537 -2 241 16 273 0 571911 18 150 2 22587 20 108 4 20465 22 37 6 13614 24 23 8 8309 26 3 10 4533 28 1 12 2747 Figure 5: Frequency distribution of difference in 14 1416 project lead times for cases where task A and task 16 695 B are in the different color band. 18 431 It looks very clear from the above result that both the 20 248 probability of achieving a lower lead time & 22 100 magnitude of the reduction in lead time, is favorable 24 33 in the case of following an integration point position based priority rule rather than the rule currently 26 16 advocated by CCPM. Figure 4: Frequency distribution of difference in 4. PRIORTISING TASKS IN A MULTI- project lead times for cases where both task A and PROJECT ENVIRONMENT USING CCPM task B are in the same color band. In the case when the conflicting tasks occur on feeding chains of two different projects, the available In figure 4, upper limit of -10 and frequency 4 means literature on Critical Chain Project Management is that there were 4 cases found where the integration not very explicit of the rule to be followed. The point position based priority rule gave a longer lead author’s experience with many CCPM software show time by 10% to 12% of buffer priority rule. Similarly that most of them do task prioritization with Upper limit of 26 and frequency 16 means that there following methodology. were 16 cases found where the integration point a. Color the tasks on the critical chain of the 1210 | P a g e
  • 4. Anant Shree Agrawal / International Journal of Engineering Research and Applications (IJERA) ISSN: 2248-9622 www.ijera.com Vol. 2, Issue4, July-August 2012, pp.1208-1212 project with dark red, dark yellow or dark other resource conflict in the project other than the green based on the zone in which the one under consideration. This assumption is valid %Buffer Consumption and % Completion of because CCPM methodology demands removal of critical chain lie on the fever chart. almost all the resource conflicts during the project- b. Color the tasks on the feeding chains of the planning phase. project with light red, light yellow and light green based on the zone in which %Buffer Consumption and % Completion of A B individual feeding chains lie on the fever FB chart. c. The tasks are then prioritized in the order C F of dark red, dark yellow, dark green, light PB red, light yellow, light green. Some software, while doing the above steps, keep the D E FB position of the feeding buffers fixed all throughout the execution of the project irrespective of the status of the critical chain, while other keep the position of the feeding buffers floating along the timeline G H FB depending upon the updated status of the critical chain. Some software completely ignore the status of the feeding buffer in case a feeding chain starts to intrude into the project buffer and color the feeding I L chains dark red, dark yellow or dark green depending PB on the incursion of feeding chain into the project buffer, while others always look at feeding buffer status to color the feeding chains. J K All the above task prioritization methods inevitably FB lead to situations when tasks of different projects get mixed up with each other. That means that one resource can have task of project A as the highest Figure 6: Project network used in simulation priority task and task of project B as lower priority task whereas another resource can have task of Figure 6 illustrates the two project networks used for project B as the highest priority task and task of simulating the lead times achieved by following the project A as lower priority task. Also, a resource can two different task priority rules. Task A and Task J have one task of Project A as highest priority task, are to be done by the same resource and there is a then a task of project B and then again another task of conflict of priority. Similarly, Task D and Task G are project A. These situations are completely counter to be done by a different resource and there is a conducive to achieve synchronization of different conflict of priority. By checking the different resources and inevitably leads to inflation of project possible durations of each of the task and chain in the lead times. project network, the impact of the two different decision-making rules can be studied. 4.1 RULE BASED ON PROJECT PRIORITY FOR MULTIPLE PROJECTS The conditions when task A and task J both are in The task prioritization rule that was found to give light red color band is studied. In this situation, much better results than the above-mentioned CCPM either the buffer color priority system will mix the rule is as follows. Priority of tasks of two or more tasks of the two projects (if other tasks are of light projects should never be mixed up. That means that if yellow or light green) or it will be neutral towards one task of a project A has higher priority than doing any task in preference to any other (if other another task of project B, then all the tasks of project tasks are also of light red color). A must have higher priority than all the tasks of ---------------------------------------------------------------- project B for all the resources. THE RANGE OF TASK DURATIONS STUDIED IN THE SIMULATION 4.11 THE SIMULATION WITH TWO ---------------------------------------------------------------- PROJECTS Task A – 3 to 8 days In order to check the difference in the resulting Chain B – 3 to 8 days project lead-time by following the above two rules, Chain C – 3 to 8 days the following assumptions are made. There will be no Task D – 3 to 8 days 1211 | P a g e
  • 5. Anant Shree Agrawal / International Journal of Engineering Research and Applications (IJERA) ISSN: 2248-9622 www.ijera.com Vol. 2, Issue4, July-August 2012, pp.1208-1212 Chain E – 3 to 8 days point position based priority rule gave a longer lead Task G – 3 to 8 days time by 6% to 4% of buffer priority rule. Similarly Chain H – 3 to 8 days Upper limit of 22 and frequency 3 means that there Chain I – 3 to 8 days were 3 cases found where the integration point Task J – 3 to 8 days position based priority rule gave a shorter lead-time Chain K – 3 to 8 days by 20% to 22%. --------------------------------------------------------------- For the 1498 cases found where both task A and task 5.CONCLUSION J were in the red color band, the following is the The integration point position based priority rule & frequency distribution of percentage difference in the the rule of never mixing up tasks of different projects lead time of project by following the buffer priority while prioritizing, gives a better result than buffer rule and the integration point position based priority priority rule in far more number of cases. Also, the rule was observed. quanta of benefits are more for the rules compared to the buffer priority rule. Since project environments Upper Limit Frequency are known to be highly uncertain and variations in -4 9 task lead times is quite common, a rule that is more likely (higher probability) to give a better result must -2 0 be followed even though in a certain particular case, 0 61 some other rule seems to give a better result. Since the new rules have higher probability of giving a 2 0 shorter lead-time for a project, these rules should be 4 0 preferred over the current buffer based task 6 285 prioritization rule. 8 0 6. MANAGERIAL IMPLICATIONS 10 477 The new rules of task prioritization, as proposed in 12 30 this paper, especially the rule for task prioritization within single projects based on the position of 14 357 integration point, apart from the obvious effect of 16 145 shortening the project lead time, will drastically 18 97 improve the acceptability of the change within the project team and save invaluable time which would 20 34 have otherwise been spent on resolving conflicts 22 3 occurring due to a flawed rule and the subjectivities Figure 7: Frequency distribution of difference in involved in its method of calculation. The second rule project lead times for simulation involving the two of task priorities in multiple projects, based on the projects. project priority, simplifies the task priority calculations, makes them more intuitive and easy to In figure 7, upper limit of -4 and frequency 9 means follow for everyone involved. that there were 9 cases found where the integration REFERENCE 1. Goldratt, Eliyahu M., Critical Chain, North River, Great Barrington, MA , 1997 2. http://www.toc-goldratt.in/product/TOC-Insights, Project Management and Engineering Insights. 3. Tzvi Raz, Dov Dvir and Robert Barnes, A Critical Look At Critical Chain Project Management, Project Management Journal, December 2003 4. Leach, L (1999), Critical chain project management improves project performance. Project Management Journal. 5. Newbold, R.C. (1998). Project Management in the Fast Lane. Boca Raton, FL: The St. Lucie Press. 6. Simpson, W.P. & Lynch, W.(1999), Critical success factors in critical chain project management. Proceedings of the 30th Annual Project Management Institute, Seminars & Symposium. CD-ROM, Newton Square, PA: Project Management Institute. 7. Goldratt, Eliyahu M., The Goal, North River Press, Croton-on Hudson, New York, 1984 8. Goldratt, Eliyahu M., THE HAYSTACK SYNDROME, North River Press, Croton-on Hudson, New York, 1990 9. http://www.toc-goldratt.in/product/TOC-Insights, Project Management and Engineering Insights. 10. Project Management Institute Standards Committee, A Guide to the Project Management Body of Knowledge, 1996. 1212 | P a g e