
Recommended
More Related Content
What's hot
What's hot (19)
Viewers also liked
Viewers also liked (19)
Similar to Buddha Yoga Long Term 17 Yr Tack Record
Similar to Buddha Yoga Long Term 17 Yr Tack Record (20)
Buddha Yoga Long Term 17 Yr Tack Record
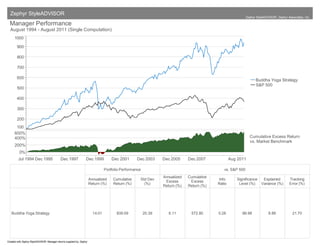
- 1. Zephyr StyleADVISOR Zephyr StyleADVISOR: Zephyr Associates, Inc. Manager Performance August 1994 - August 2011 (Single Computation) 1000 900 800 700 600 Buddha Yoga Strategy S&P 500 500 400 300 200 100 600% 400% Cumulative Excess Return vs. Market Benchmark 200% 0% Jul 1994 Dec 1995 Dec 1997 Dec 1999 Dec 2001 Dec 2003 Dec 2005 Dec 2007 Aug 2011 Portfolio Performance vs. S&P 500 Annualized Cumulative Annualized Cumulative Std Dev Info Significance Explained Tracking Excess Excess Return (%) Return (%) (%) Ratio Level (%) Variance (%) Error (%) Return (%) Return (%) Buddha Yoga Strategy 14.01 839.09 20.39 6.11 572.80 0.28 86.98 8.89 21.70 Created with Zephyr StyleADVISOR. Manager returns supplied by: Zephyr
- 2. Zephyr StyleADVISOR Zephyr StyleADVISOR: Zephyr Associates, Inc. Manager vs Benchmark: Return August 1994 - August 2011 (not annualized if less than 1 year) 20 15 10 Return Buddha Yoga Strategy S&P 500 5 0 -5 YTD 1 year 2 years 3 years 4 years 5 years 10 years 15 years Since Inception Manager vs Benchmark: Return August 1994 - August 2011 (not annualized if less than 1 year) Since YTD 1 year 2 years 3 years 4 years 5 years 10 years 15 years Inception Buddha Yoga Strategy 1.80% 11.63% 12.48% 1.09% 3.25% 4.18% 8.69% 10.07% 14.01% S&P 500 -1.77% 18.50% 11.50% 0.54% -2.52% 0.78% 2.70% 6.13% 7.90% Created with Zephyr StyleADVISOR. Manager returns supplied by: Zephyr
- 3. Zephyr StyleADVISOR Zephyr StyleADVISOR: Zephyr Associates, Inc. Calendar Year Return As of August 2011 30% 20% 10% 0% Buddha Yoga Strategy -10% S&P 500 -20% -30% -40% YTD 2010 2009 2008 2007 2006 2005 2004 2003 2002 YTD 2010 2009 2008 2007 2006 2005 2004 2003 2002 Buddha Yoga Strategy 1.80% 11.05% 3.93% -13.96% 16.50% 14.10% 8.69% 13.79% 19.92% 9.10% S&P 500 -1.77% 15.06% 26.46% -37.00% 5.49% 15.79% 4.91% 10.88% 28.68% -22.10% Created with Zephyr StyleADVISOR. Manager returns supplied by: Zephyr
- 4. Zephyr StyleADVISOR Zephyr StyleADVISOR: Zephyr Associates, Inc. Manager Style Asset Allocation Buddha Yoga Strategy August 1994 - August 2011 (Single Computation) August 1994 - August 2011 (Single Computation) Large Citigroup 3-month T-bill 57.9% Russell 1000 Value Russell 1000 Growth 1 Russell 1000 Value 42.1% 0 Buddha Yoga Strategy Russell 1000 Growth 0.0% S&P 500 Buddha Yoga Strategy Zephyr Large Core Universe (Monthly) Russell Generic Corners Russell 2000 Value 0.0% -1 Russell 2000 Value Russell 2000 Growth Russell 2000 Growth 0.0% Small Value -1 0 1 Growth 0% 20% 40% 60% 80% 100% Manager Style Asset Allocation Buddha Yoga Strategy August 1994 - August 2011 (36-Month Moving Windows, Computed Monthly) August 1994 - August 2011 (36-Month Moving Windows, Computed Monthly) Large 100% Russell 1000 Value Russell 1000 Growth 80% 1 60% Citigroup 3-month T-bill 0 Russell 1000 Value Buddha Yoga Strategy Russell 1000 Growth Russell Generic Corners Russell 2000 Value 40% Russell 2000 Growth -1 Russell 2000 Value Russell 2000 Growth 20% Small 0% Jul 1997 Dec 1999 Dec 2001 Dec 2003 Dec 2005 Dec 2007 Aug 2011 Value -1 0 1 Growth Created with Zephyr StyleADVISOR. Manager returns supplied by: Zephyr
- 5. Zephyr StyleADVISOR Zephyr StyleADVISOR: Zephyr Associates, Inc. Risk / Return August 1994 - August 2011 (Single Computation) 16% 14% 12% 10% Return Buddha Yoga Strategy 8% Market Benchmark: S&P 500 Zephyr Large Core Universe (Monthly) 6% Cash Equivalent: Citigroup 3-month T-bill 4% 2% 0% 0% 5% 10% 15% 20% Standard Deviation Beta Alpha R-Squared R-Squared Tracking Error Return Std Dev Downside Risk Sharpe vs. vs. Market vs. Market vs. Style vs. Market Observs. (%) (%) (%) Ratio Market (%) (%) (%) (%) Buddha Yoga Strategy 14.01 20.39 15.39 0.3874 12.59 8.89 17.60 0.5249 21.7036 205 S&P 500 7.90 15.69 12.03 1.0000 0.00 100.00 99.50 0.2924 0.0000 205 Created with Zephyr StyleADVISOR. Manager returns supplied by: Zephyr
- 6. Zephyr StyleADVISOR Zephyr StyleADVISOR: Zephyr Associates, Inc. Upside / Downside August 1994 - August 2011 (Single Computation) 200 150 Upside% 100 Buddha Yoga Strategy S&P 500 50 0 0 50 100 150 200 Downside% Average Return (%) # of Months Month (%) 1-Year (%) Market Benchmark (%) vs. Market Up Down Up Down Up Down Best Worst Best Worst R-Squared Market Market Capture Capture Buddha Yoga Strategy 122 83 2.25 -0.44 24.70 -35.42 73.05 -41.32 56.6 17.6 8.89 S&P 500 131 74 3.42 -4.00 9.78 -16.79 53.62 -43.32 100.0 100.0 100.00 Created with Zephyr StyleADVISOR. Manager returns supplied by: Zephyr
- 7. Zephyr StyleADVISOR Zephyr StyleADVISOR: Zephyr Associates, Inc. Multi-Statistic August 1994 - August 2011 14 12 10 8 6 Buddha Yoga Strategy S&P 500 4 2 0 Alpha Beta Excess Return Sharpe Information Ratio Pain vs. vs. vs. Ratio vs. Ratio Market Market Market Market Multi-Statistic (Custom Table) August 1994 - August 2011: Summary Statistics Alpha Beta Excess Return Information Ratio Sharpe Pain vs. vs. vs. vs. Ratio Ratio Market Market Market Market Buddha Yoga Strategy 12.59% 0.39 6.11% 0.52 0.28 1.19 S&P 500 0.00% 1.00 0.00% 0.29 0.00 0.35 Created with Zephyr StyleADVISOR. Manager returns supplied by: Zephyr
- 8. Zephyr StyleADVISOR Zephyr StyleADVISOR: Zephyr Associates, Inc. Manager vs Benchmark: Multi-Statistic August 1994 - August 2011 (not annualized if less than 1 year) 25% Standard Deviation 20% 15% Buddha Yoga Strategy 10% S&P 500 5% 0% YTD 1 year 2 years 3 years 4 years 5 years 10 years 15 years 16% Downside Deviation (MAR = 0.00%) 14% 12% 10% 8% Buddha Yoga Strategy 6% S&P 500 4% 2% 0% YTD 1 year 2 years 3 years 4 years 5 years 10 years 15 years 1.4 1.2 1 Sharpe Ratio 0.8 0.6 Buddha Yoga Strategy 0.4 S&P 500 0.2 0 -0.2 YTD 1 year 2 years 3 years 4 years 5 years 10 years 15 years Created with Zephyr StyleADVISOR. Manager returns supplied by: Zephyr
- 9. Zephyr StyleADVISOR Zephyr StyleADVISOR: Zephyr Associates, Inc. Histogram of Returns August 1994 - August 2011 25 20 Percentage of Months (%) 15 Buddha Yoga Strategy 10 S&P 500 5 0 < -36 -36 to -34 -34 to -32 -32 to -30 -30 to -28 -28 to -26 -26 to -24 -24 to -22 -22 to -20 -20 to -18 -18 to -16 -16 to -14 -14 to -12 -12 to -10 -10 to -8 -8 to -6 -6 to -4 -4 to -2 -2 to 0 0 to 2 2 to 4 4 to 6 6 to 8 8 to 10 10 to 12 12 to 14 14 to 16 16 to 18 18 to 20 20 to 22 22 to 24 > 24 Returns Range (%) Histogram of Returns (Custom Table) August 1994 - August 2011: Summary Statistics # of Average Downside # of Average Upside Sortino Standard Omega Skewness Kurtosis Down Down Deviation Up Up Deviation Ratio Deviation (MAR = 0.00%) Periods Return (MAR = 0.00%) Periods Return (MAR = 0.00%) (MAR = 0.00%) Buddha Yoga Strategy -1.08 7.75 20.39% 83 -3.74% 13.49% 122 4.70% 15.85% 1.84 1.04 S&P 500 -0.71 0.98 15.69% 74 -4.00% 10.80% 131 3.42% 11.62% 1.51 0.73 Created with Zephyr StyleADVISOR. Manager returns supplied by: Zephyr
- 10. Zephyr StyleADVISOR Zephyr StyleADVISOR: Zephyr Associates, Inc. Excess Return vs. Market Benchmark / Time August 1994 - August 2011 (36-Month Moving Windows, Computed Monthly) 40% 30% Excess Return vs. S&P 500 20% 10% 0% Buddha Yoga Strategy -10% -20% -30% Jul 1997 Dec 1999 Dec 2001 Dec 2003 Dec 2005 Dec 2007 Dec 2009 Aug 2011 Time Std Dev of Excess Return vs. Market Benchmark / Time August 1994 - August 2011 (36-Month Moving Windows, Computed Monthly) 45% Std Dev of Excess Return vs. S&P 500 40% 35% 30% 25% 20% Buddha Yoga Strategy 15% 10% 5% 0% Jul 1997 Dec 1999 Dec 2001 Dec 2003 Dec 2005 Dec 2007 Dec 2009 Aug 2011 Time Created with Zephyr StyleADVISOR. Manager returns supplied by: Zephyr
- 11. Zephyr StyleADVISOR Zephyr StyleADVISOR: Zephyr Associates, Inc. Excess Return vs. Market Benchmark / Batting Average vs. Market Benchmark August 1994 - August 2011 (Single Computation) 7% 6% Excess Return vs. S&P 500 5% 4% 3% Buddha Yoga Strategy 2% 1% 0% 0% 10% 20% 30% 40% 50% 60% 70% 80% 90% 100% Batting Average vs. S&P 500 Batting Average vs. Market Benchmark / Time August 1994 - August 2011 (36-Month Moving Windows, Computed Monthly) 100% 90% Batting Average vs. S&P 500 80% 70% 60% 50% Buddha Yoga Strategy 40% 30% 20% 10% 0% Jul 1997 Dec 1999 Dec 2001 Dec 2003 Dec 2005 Dec 2007 Dec 2009 Aug 2011 Time Created with Zephyr StyleADVISOR. Manager returns supplied by: Zephyr
- 12. Zephyr StyleADVISOR Zephyr StyleADVISOR: Zephyr Associates, Inc. Drawdown August 1994 - August 2011 0% -10% -20% Buddha Yoga Strategy -30% S&P 500 -40% -50% Jul 1994 Dec 1995 Dec 1997 Dec 1999 Dec 2001 Dec 2003 Dec 2005 Dec 2007 Aug 2011 Max Max Max Max Gain Max Pain Pain Omega High Water To High Drawdown Drawdown Drawdown Drawdown to Loss Drawdown Index Ratio (MAR = 0.00%) Mark Date Water Mark Begin Date End Date Length Recovery Date Ratio Buddha Yoga Strategy -48.03% Jan 2000 Mar 2000 3 Jan 2004 8.97% 1.19 1.84 1.25 May 2011 3.91% S&P 500 -50.95% Nov 2007 Feb 2009 16 N/A 13.20% 0.35 1.51 0.85 Oct 2007 16.70% Created with Zephyr StyleADVISOR. Manager returns supplied by: Zephyr
- 13. Zephyr StyleADVISOR Zephyr StyleADVISOR: Zephyr Associates, Inc. Manager vs Zephyr Large Core Universe (Monthly): Return August 1994 - August 2011 (not annualized if less than 1 year) 25 20 15 10 Buddha Yoga Strategy Return S&P 500 5th to 25th Percentile 5 25th Percentile to Median Median to 75th Percentile 75th to 95th Percentile 0 -5 -10 YTD 1 year 2 years 3 years 4 years 5 years 10 years 15 years Manager vs Zephyr Large Core Universe (Monthly): Return August 1994 - August 2011 (not annualized if less than 1 year) YTD 1 year 2 years 3 years 4 years 5 years 10 years 15 years 386 mng 382 mng 371 mng 363 mng 355 mng 334 mng 233 mng 125 mng Median -1.78% 18.49% 11.40% 0.76% -1.83% 1.30% 3.78% 6.85% Buddha Yoga Strategy 1.80% 11.63% 12.48% 1.09% 3.25% 4.18% 8.69% 10.07% S&P 500 -1.77% 18.50% 11.50% 0.54% -2.52% 0.78% 2.70% 6.13% Created with Zephyr StyleADVISOR. Manager returns supplied by: Zephyr
- 14. Zephyr StyleADVISOR Zephyr StyleADVISOR: Zephyr Associates, Inc. Manager vs Zephyr Large Core Universe (Monthly): Return Rank August 1994 - August 2011 (36-Month Moving Windows, Computed Monthly) 0% 25% Return Rank Buddha Yoga Strategy S&P 500 Median 5th to 25th Percentile 25th Percentile to Median Median to 75th Percentile 75th to 95th Percentile 75% 100% Jul 1997 Dec 1999 Dec 2004 Dec 2009 Aug 2011 Manager vs Zephyr Large Core Universe (Monthly): Return Rank August 1994 - August 2011 (36-Month Moving Windows, Computed Monthly) Sep 1998 Nov 1999 Jan 2001 Mar 2002 May 2003 Jul 2004 Oct 2005 Dec 2006 Feb 2008 Apr 2009 Jun 2010 Aug 2011 130 mng 155 mng 190 mng 211 mng 247 mng 275 mng 312 mng 346 mng 363 mng 379 mng 390 mng 363 mng Buddha Yoga Strategy 3.63% 10.98% 100.00% 59.87% 0.36% 0.00% 82.91% 39.66% 5.31% 2.38% 0.55% 39.44% S&P 500 38.88% 34.99% 69.41% 87.47% 88.21% 83.63% 72.72% 75.48% 75.79% 71.82% 69.71% 61.69% Created with Zephyr StyleADVISOR. Manager returns supplied by: Zephyr
- 15. Zephyr StyleADVISOR Zephyr StyleADVISOR: Zephyr Associates, Inc. Manager vs Zephyr Large Core Universe (Monthly): Multi-Statistic August 1994 - August 2011 (not annualized if less than 1 year) 10% 8% 6% 4% Buddha Yoga Strategy S&P 500 Alpha 2% 0% 5th to 25th Percentile 25th Percentile to Median -2% Median to 75th Percentile -4% 75th to 95th Percentile -6% -8% YTD 1 year 2 years 3 years 4 years 5 years 10 years 15 years 2 1.5 Information Ratio 1 Buddha Yoga Strategy 0.5 S&P 500 0 -0.5 5th to 25th Percentile 25th Percentile to Median -1 Median to 75th Percentile -1.5 75th to 95th Percentile -2 YTD 1 year 2 years 3 years 4 years 5 years 10 years 15 years 2 1.5 Sharpe Ratio Buddha Yoga Strategy 1 S&P 500 0.5 5th to 25th Percentile 25th Percentile to Median 0 Median to 75th Percentile 75th to 95th Percentile -0.5 YTD 1 year 2 years 3 years 4 years 5 years 10 years 15 years Created with Zephyr StyleADVISOR. Manager returns supplied by: Zephyr
- 16. Zephyr StyleADVISOR Zephyr StyleADVISOR: Zephyr Associates, Inc. Omega August 1994 - August 2011 2 1.8 1.6 1.4 Omega 1.2 Buddha Yoga Strategy S&P 500 1 0.8 0.6 0.4 0% 5% 10% 15% 20% 25% Annual MAR Created with Zephyr StyleADVISOR. Manager returns supplied by: Zephyr
- 17. Zephyr StyleADVISOR Zephyr StyleADVISOR: Zephyr Associates, Inc. Annualized Excess Return / Standard Deviation of Excess Return (vs. S&P 500) August 1994 - August 2011 (Single Computation) 7% 6% 5% Excess Return 4% 3% Buddha Yoga Strategy 2% 1% 0% 0% 5% 10% 15% 20% Standard Deviation of Excess Return Annualized Excess Return / Standard Deviation of Excess Return (vs. S&P 500) August 1994 - August 2011 (36-Month Moving Windows, Computed Monthly) 40% 30% 20% Excess Return 10% 0% Buddha Yoga Strategy -10% -20% -30% 0% 5% 10% 15% 20% 25% 30% 35% 40% Standard Deviation of Excess Return Created with Zephyr StyleADVISOR. Manager returns supplied by: Zephyr
- 18. Zephyr StyleADVISOR Zephyr StyleADVISOR: Zephyr Associates, Inc. Correlation Matrix: Returns vs. S&P 500 August 1994 - August 2011 (1) (2) 1) Buddha Yoga Strategy 1.00 2) S&P 500 0.30 1.00 Created with Zephyr StyleADVISOR. Manager returns supplied by: Zephyr
- 19. Zephyr StyleADVISOR Zephyr StyleADVISOR: Zephyr Associates, Inc. Periodic Returns January 2007 - August 2011 Jan Feb Mar Q1 Apr May Jun Q2 Jul Aug Sep Q3 Oct Nov Dec Q4 Year 2011 -1.96 0.76 -2.33 -3.52 5.72 3.70 -2.46 6.93 -5.33 4.22 - -1.33 - - - - 1.80 2010 1.00 3.39 0.79 5.25 -1.62 -2.43 -1.16 -5.13 3.00 -1.54 1.97 3.41 5.99 -3.42 5.07 7.55 11.05 Buddha Yoga Strategy 2009 -10.71 -11.02 -0.91 -21.28 4.63 6.54 -1.02 10.33 8.67 -1.62 6.32 13.66 0.04 7.32 -1.95 5.27 3.93 2008 -9.19 1.75 4.12 -3.79 -3.42 -0.30 -7.46 -10.90 7.30 6.38 -1.12 12.87 -7.45 -0.83 -3.11 -11.07 -13.96 2007 1.34 -2.32 3.27 2.23 -0.46 -0.48 -3.06 -3.97 0.16 5.38 6.85 12.78 -0.42 6.71 -0.98 5.22 16.50 2011 2.37 3.43 0.04 5.92 2.96 -1.13 -1.67 0.10 -2.03 -5.43 - -7.36 - - - - -1.77 2010 -3.60 3.10 6.03 5.39 1.58 -7.99 -5.23 -11.43 7.01 -4.51 8.92 11.29 3.80 0.01 6.68 10.76 15.06 S&P 500 2009 -8.43 -10.65 8.76 -11.01 9.57 5.59 0.20 15.93 7.56 3.61 3.73 15.61 -1.86 6.00 1.93 6.04 26.46 2008 -6.00 -3.25 -0.43 -9.44 4.87 1.30 -8.43 -2.73 -0.84 1.45 -8.91 -8.37 -16.79 -7.18 1.06 -21.94 -37.00 2007 1.51 -1.96 1.12 0.64 4.43 3.49 -1.66 6.28 -3.10 1.50 3.74 2.03 1.59 -4.18 -0.69 -3.33 5.49 Created with Zephyr StyleADVISOR. Manager returns supplied by: Zephyr