2. Abdullah Alhuzaim and R. Bruce Madigan
http://www.iaeme.com/IJMET/index.asp 125 editor@iaeme.com
Cite this Article: Abdullah Alhuzaim and R. Bruce Madigan. Investigate and
Optimize the Pulsing Effect of Thermo Cycle of Low Carbon Steel Alloy
Deposit in Plasma ARC Welding Additive Manufacturing, International
Journal of Mechanical Engineering and Technology, 6(10), 2015, pp. 124-
139.
http://www.iaeme.com/currentissue.asp?JType=IJMET&VType=6&IType=10
INTRODUCTION
The main driving forces to advance are cost reduction and flexibility in both
manufacturing and product design (Ref.1). Layer creation is a precise and time-
consuming step in all layer-based rapid prototyping (RP) processes. Great difficulties
in achieving accurate deposition of the layered base material are encountered in most
processes. The deposition of the layered base material is often the clue to a successful
or failing process (Ref.2).
Additive manufacturing offers the potential to save significant amounts of energy
and resources (Ref.1, 3) and overcome some limitations of traditional manufacturing
methods such as casting, forging and machining. The use of the Plasma Arc welding
process for additive manufacturing promises to produce low cost products from
vitally important metal alloys (Ref.4). Previous work has demonstrated that it possible
to produce relatively complex part shapes and that it is possible to boost metal
deposition rate to increase productivity (Ref.5). Attention is now being turned to
attaining acceptable mechanical properties and fine geometric features in additively
manufactured deposits (Ref.6, 7). While the general processing parameters required to
produce certain microstructures and hence mechanical properties in low carbon steel
alloys are well known, it is difficult to achieve both high productivity and acceptable
mechanical properties simultaneously in additively-manufactured. A significant
amount of work is being conducted to characterize additive manufacturing process
parameters for different alloys. Fusion welding processes like electron beam welding,
laser welding, plasma arc welding and gas tungsten arc welding subject the additively
manufactured deposit to repetitive and cumulative thermal cycles that cause complex
transformations in steel alloys. The work presented here begins to focus on the next
important next step for the PAW process: deposit thermal management to control
deposit temperature and therefore microstructure development and resulting
mechanical properties.
INVESTIGATION OVERVIEW
Experimental PAW deposits of alloy 1018 were made to build two walls to
understand and optimize the range of build parameters including welding parameters
and shot delivery parameters. All build parameters held consistent except the wait-
time between layers. Wait-time between layers was used to allow the deposit to cool
varying amounts and therefore control solidification and cooling rates thereby
controlling deposit microstate.
WELD SEQUENCE OPERATION
As the experiments progressed, a series of changes in equipment and procedures were
implemented to optimize the build process. In this experiment, a computer controls
the entire build process. The process equipment consists of the control computer shot
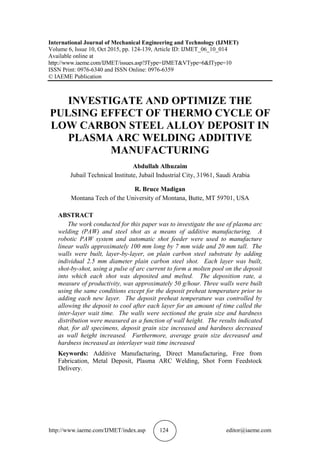
feeder, the robot and the PAW unit. Figure 1 shows the different stages a single cycle
goes through.
3. Investigate and Optimize The Pulsing Effect of Thermo Cycle of Low Carbon Steel Alloy
Deposit In Plasma ARC Welding Additive Manufacturing
http://www.iaeme.com/IJMET/index.asp 126 editor@iaeme.com
Figure 1 Graphic of program’s continuous cycle
For each shot delivered to the weld pool the following sequence of events were
executed by the control computer
The robot was moved to the location where the next shot was to be placed and motion
was stopped.
The shot feeder was actuated to release a single shot.
When the shot detected sensed the release of a shot, a time delay was implemented as
the shot traversed the shot delivery path.
As the shot approached the weld area, the arc current was change to the peak value to
prepare a weld pool for the shot to enter.
The arc current was held at the peak time to melt the shot
After the peak time, the arc current was returned to the background level.
The robot was moved to the next location and the entire sequence was repeated.
EXPERIMENTAL DEPOSIT BUILD PROCEDURE
The substrate was clamped to a positioning fixture within the Robot the substrate was
fixed on the positioner, and the torch standoff distance was set by adjusting the arm
torch positioner. The various essential PAW parameters were then set and shown in
the Results and Discussion section for each wall specimen. The essential PAW
parameter ranges used to manufacture the weld metal specimens for the additive
manufacturing processes are given in Table 1. Welding parameters are detailed in
Appendix A. Figure 2 shows the experimental setup design with shot feeder.
Figure 2 Experimental setup design with shot feeder
4. Abdullah Alhuzaim and R. Bruce Madigan
http://www.iaeme.com/IJMET/index.asp 127 editor@iaeme.com
Linear wall weld metal deposits were constructed on A36 low-carbon steel
substrate. Figure 3 shows the positioning of the PAW torch and shot delivery tube
above the substrate prior to welding.
Figure 3 Positioning of the PAW torch and the shot delivery tube above substrate
prior to welding
As Figure 3 shows, the substrate was fixed on the positioner, and the torch
standoff distance was set. The various essential PAW parameters were then set. The
essential PAW parameter ranges and are shown in appendix A.
The linear walls were built by placing individual weld layers on top of one
another. Successive weld layers were placed one atop the previous layer. The
idealized weld metal deposit linear wall build progression is displayed in Figure 4.
Figure 4 Idealized weld metal deposit build progression
After completing the first deposit layer, the appropriate wait-time was allowed to
pass for the deposit temperature to cool. The time between layers is referred to as the
inter-layer wait time, . Figure 5 shows the formation of the straight weld metal
deposit after accumulating several layers on the substrate.
Figure 5 Example of a multi-layer linear wall deposit
5. Investigate and Optimize The Pulsing Effect of Thermo Cycle of Low Carbon Steel Alloy
Deposit In Plasma ARC Welding Additive Manufacturing
http://www.iaeme.com/IJMET/index.asp 128 editor@iaeme.com
Optimization of shot feed and arc current pulsing
Video system was used to investigate and optimize the shot feeding and arc current
pulsing timing and sequencing. Figure 6 shows the steps of the thermal cycle to build
a deposit and captured by the video system
Robot Move Arc on at background level Arc on at pulse level
Waiting for shot Shot leaving the tube pool Shot hitting the weld pool
Shot melting Arc on at background level Weld pool solidification
Figure 6 Optimization of shot feed and arc current pulsing
Prior to the start of the building, the pilot arc is turned on. Then the main arc is
turned on at the background level. When the shot is detected, the arc current is pulse
after the pulse delay time. Then, the shot will land on the weld pool and melt. The arc
current is returned to the background level. Then, the robot will move the substrate (2
mm in this experiment) and repeat the cycle again. Timing in this process is critical
and mainly depends on the shot feeder.
METALLOGRAPHIC INVESTIGATION OF LINEAR WALL
DEPOSITIONS
After the walls were built, they were subjected to metallographic inspection. First the
walls were sectioned both transversely (perpendicular to the long axis of the wall) and
longitudinally (parallel to the long axis of the wall). The sections were then mounted,
polished and etched to reveal the grain microstructure. The sections were then
photographed and subjected to micro-hardness measurements. Grain size was
determined from the photographs. Then both grain size and hardness values were
converted to wall height and inter-layer wait-time.
6. Abdullah Alhuzaim and R. Bruce Madigan
http://www.iaeme.com/IJMET/index.asp 129 editor@iaeme.com
GRAIN SIZE MEASUREMENT
The microscopic pictures were shots at 140X magnification. The scale is 500 μm (0.5
mm) Ten grains were measured from each picture and the measurements were
averaged.
HARDNESS
A Rockwell Harness Tester was used to indent the sample to determine the hardness.
An average B-scale hardness number was obtained using a 1/16” steel ball and a load
of 100kg. The first reading was from the middle of the substrate, and the rest of
reading was from the HAZ, all the way to the surface of the wall with approximately
1mm pitch from the center of the indenters. Figure 7 shows the indenter progressing
upward in a cross section cut of one of the specimen.
Figure 7 Indenter progressing upward in cross section cut of one of the specimen
RESULTS AND DISCUSSION
Two linear wall weld metal specimens made from the A36 steel alloy were built using
1018 steel shots filler metal throughout this research. Here the results are presented
and discussed in regards to all of the weld specimens that were constructed. tt is the
time to produce a layer. δ is a coefficient to make the inter-layer wait time a function
of the time to produce a layer. δtt is the inter-layer wait-time. Essential process
parameters, dimensions, photographs of the specimens, mechanical properties plots of
Tdep in relation to the number of weld tracks in the weld metal deposit (nt), and weld
metal microstructures are presented and discussed. nt, Tdep after a minimum δtt of 1
minute and a maximum δtt of 10 minutes, and any important comments pertaining to
the weld tracks that were made are shown in Appendix A: Raw Specimen Data.
Linear wall Specimen #1
The waiting time between layers was 1 minute. The a erage temperature for the
specimen before building the next layer was 00C. The PAW essential process
parameters used to manufacture the Specimen#1 are shown in Table 1. Specimen#1
was built using 1018 steel. Specimen #1 was cut into longitudinal and transverse
sections. As shown in Figure 8, the transverse section was taken from the between of
segment 1M and 1. The longitudinal section was taken from top of segment 1M.
7. Investigate and Optimize The Pulsing Effect of Thermo Cycle of Low Carbon Steel Alloy
Deposit In Plasma ARC Welding Additive Manufacturing
http://www.iaeme.com/IJMET/index.asp 130 editor@iaeme.com
Figure 8 Location of transverse section and longitudinal section on specimen # 1
The deposit grains change structure from a relatively microstructure and small
grain size near the substrate to a very coarse microstructure with a large grain size
near the tip of the deposit. Figure 9 shows specimen #1 grains change.
Figure 9 Transverse macro section of baseline specimen #2 with example
micrographs and grain size at deposit heights
The microstructure of the specimen near the substrate consisted of pearlite
colonies (dark contrast) and ferrite grains (light contrast). Both ferrite and pearlite
grains were nearly equiaxed grains, ranging from 5 to 50 μm in size.
The microstructure of the specimen near the surface, the light-colored region of
the microstructure, is the ferrite. The grain boundaries between the ferrite grains can
be seen quite clearly. The dark regions are the pearlite. It is made up from a fine
mixture of ferrite and iron carbide, which can be seen as a "wormy" texture. Both
ferrite and pearlite grains were columnar grains which are long, thin, coarse grains,
ranging from 300 to 430 μm in size. Figure 10 shows the growth in grain size of
Specimen #1.
8. Abdullah Alhuzaim and R. Bruce Madigan
http://www.iaeme.com/IJMET/index.asp 131 editor@iaeme.com
Figure 10 Grain size number for 1-minute specimen
Figure 10 shows that grain size is a function of deposit height. Figure 10, also
shows the results of a regression analysis performed using grain size as function of
deposit height. The data and regression fit line show that grain size increase with
increasing deposit height. Furthermore, as deposit height increase, the rate that grain
size increases with each added layer also increases. The regression correlation
coefficient of R²= 0.7627 shows a good fit between data and fit line.
As the deposit height increase, the heat flow conditions for remaining heat from
and therefore determining the temperature of the deposit change. As the deposit
height increases, the solidification and cooling rate decrease and the grains in higher
layer grow larger than those in lower layers.
Linear wall Specimen #2
The waiting time between layers was 10 minutes. The average temperature for the
specimen before building the next layer was 0C. The PAW essential process
parameters used to manufacture the Specimen #2 are shown in Table 1. Specimen #2
was built using 1018 steel. Specimen #2 was built with wait time of 10 minutes
between each layer. Specimen #2 was cut into longitudinal and transverse sections. As
shown in Figure 11, the transverse section was taken from the segment next to
segment 5. The longitudinal section was taken from top of the large center segment.
Figure 11 Location of transverse section and longitudinal section on specimen #
The deposit grains change structure from a relatively microstructure and small
grain size near the substrate to a very coarse microstructure with a large grain size
near the tip of the deposit. Figure 12 shows specimen #2 grains change.
9. Investigate and Optimize The Pulsing Effect of Thermo Cycle of Low Carbon Steel Alloy
Deposit In Plasma ARC Welding Additive Manufacturing
http://www.iaeme.com/IJMET/index.asp 132 editor@iaeme.com
Figure 12 Macro section of weld metal specimen 10 min wait time
The microstructure of the specimen near the substrate consisted of pearlite
colonies (dark contrast) and ferrite grains (light contrast). Both ferrite and pearlite
grains were nearly equiaxed grains, ranging from 18 to 5 μm in size.
The microstructure of the specimen near the surface, the light-colored region of
the microstructure, is the ferrite. The grain boundaries between the ferrite grains can
be seen quite clearly. The dark regions are the pearlite. It is made up from a fine
mixture of ferrite and iron carbide, which can be seen as a "wormy" texture. Both
ferrite and pearlite grains were columnar grains which are long, thin, coarse grains,
ranging from 0 to 3 0 μm in size. Figure 13 shows the growth in grain size of
Specimen #2.
Figure 13 Grain size number for 10-minute specimen
Figure 13 shows that grain size is a function of deposit height. Figure 13, also
shows the results of a regression analysis performed using grain size as function of
deposit height. The data and regression fit line show that grain size increase with
increasing deposit height. Furthermore, as deposit height increase, the rate that grain
size increases with each added layer also increases. The regression correlation
coefficient of R²= 0.9042 shows a good fit between data and fit line.
As the deposit height increase, the heat flow conditions for remaining heat from
and therefore determining the temperature of the deposit change. As the deposit
height increases, the solidification and cooling rate decrease and the grains in higher
layer grow larger than those in lower layers.
10. Abdullah Alhuzaim and R. Bruce Madigan
http://www.iaeme.com/IJMET/index.asp 133 editor@iaeme.com
HARDNESS RESULTS
The hardness-HRB results of the two specimens are plotted in Figure 14. A regression
analysis was performed for HRB as a function of deposit height on all two specimens.
The equations of the hardness trend lines are displayed in the graph. For all
specimens, hardness decreases nearly linearly with increasing deposit height.
Specimen #1 was completed with an inter-layer wait time of 1 minute and specimen
#2 was completed with a 10 minutes inter-layer weight time, the average deposit
temperature for specimen #1 was greater than that of specimen #2.
Figure 14 Hardness test regression analysis shows decrease in all specimens as a
function of Deposition Height
The decrease in hardness with increasing deposit height is a direct result of the
observed increase in grain size with increasing deposit height.
PREDICTION OF TENSILE STRENGTH
Hardness values can be used to estimate tensile strength. The conversion chart use to
predict tensile strength from HRB values included in Appendix A, Table 3 (Ref.8).
Figure 15 shows the results of regression analysis of tensile strength on the three
specimens.
Figure 15 Tensile strength regression analysis shows decrease in specimens
Figure 15 reveals that estimated ultimate tensile strength for all specimens
decrease with increasing deposit height. The decrease in tensile strength with
increasing wall height follows directly from observation that grain size increases with
wall height. The tensile strength and grain size data shown have followed the Hall-
Patch relationship. (Ref.9)
(1)
11. Investigate and Optimize The Pulsing Effect of Thermo Cycle of Low Carbon Steel Alloy
Deposit In Plasma ARC Welding Additive Manufacturing
http://www.iaeme.com/IJMET/index.asp 134 editor@iaeme.com
where tensile strength ( ) is inversely proportional to grain size (GS). The data
presented here demonstrates that it is possible to control deposit strength effectively
using inter-later wait-time. As inter-layer wait-time increases, strength increases. The
cost of increasing strength is lowered productivity. Analysis for all specimens is
located in Appendix A, Table 3.
CONCLUSION
Metallographic results of the linear wall specimens revealed useful information
relating to the thermal history experienced by the specimens during manufacturing.
Cross-sections of the weld metal specimens showed an overall increase in the grain
size, along with a coarsening microstructure, as the height of the linear wall specimen
increased. The coarse microstructure, along with the large grain size, corresponds to
the increase in temperature of the linear wall specimen deposit. As the weld metal
deposit temperature increases, solidification and cooling rates decrease, grain growth
increases, and the microstructure coarsens.
The influence of deposit temperature on deposit microstructure has been shown.
As deposit temperature increases, grain structure coarsens and grain growth occurs,
which leads to poorer mechanical properties. For all the two linear wall specimens,
grain size increases with height of deposit because of the decreases in solidification
and cooling rate. Moreover, one-minute (60 second) inter-layer time produces larger
grain size than ten-minute (600 second) waiting time.
Hardness results of the linear wall specimens also revealed useful information
relating to the thermal history experienced by the specimens during manufacturing.
The results show an overall decrease in hardness. The decrease in hardness
corresponds to the increase in grain size.
For the three specimens, hardiness decreases nearly linearly with increasing
deposit height because of the increase in grain size with height. Tensile strength of the
material increases with longer inter-layer wait-time. However, an increase in the
strength can reduce the productivity. The decrease in hardness with increasing deposit
height is a direct result of the observed increase in grain size with increasing deposit
height
ACKNOWLEDGMENTS
This work was sponsored in-part by the Royal Commission for Jubail and Yanbu
under scholarship number (1039/20/6)
REFERENCE
[1] Charles, Corinne. Modelling Microstructure Evolution of Weld Deposited Ti-
6Al-4V. Luleå, Sweden: Luleå University of Technology, 2008.
[2] Kruth, J. P., M. C. Leu, and T. Nakagawa. Progress in Additive Manufacturing
and Rapid Prototyping. s.l: Elsevier, 1998. pp. 525-540
[3] Killander, Lena Apelskog and G. Sohlenius. Future Direct Manufacturing of
Metal Parts with Free-Form Fabrication. Centro, Rio de Janeiro: Elsevier
Science, 1995. pp. 451-454.
[4] Journal of Material Processing Technology. June 2012, Vol. 212, pp. 1377-1389.
[5] Research and Development in Rapids Prototyping and Tooling in the United
States. leu, M.C Zhang, W. Beijing : Rapid Prototyping and Manufacturing,
1998.
12. Abdullah Alhuzaim and R. Bruce Madigan
http://www.iaeme.com/IJMET/index.asp 135 editor@iaeme.com
[6] Material Incress Manufacturing by Rapid Prototyping Techniques. Kruth, J.
Leuven, Belgium: Katholieke Universiteit Leuven/Belgium, 1991. CIRP Annals.
pp. 603-614.
[7] Tensile Strength to Hardness Conversion Chart. Mwsco. [Online] [Cited:
February 23, 2014.] http://www.mwsco.com/kb/articles/19990630e.htm.
[8] FINDLEY, KIP O. Colorado School of Mines. [Online] April 3ed, 2014. [Cited:
April 5th, 2014.] http://inside.mines.edu/HallPetchEquation.
[9] Alhuzaim, Abdullah F. Investigation in the Use of Plasma Arc Welding and
Alternative Feedstock Delivery Method in Additive Manufactur E. Butte, MT:
Montana Tech of the University of Montana, 2014. Available at
http://www.abdullahalhuzaim.com/wp-content/uploads/2014/05/Additive-
Manufacture.pdf.
[10] Vipul V.Ruiwale and Dr. Rajesh U. Sambhe. Application of Additive
Manufacturing Technology for Manufacturing Medical Implants: A Review,
International Journal of Mechanical Engineering and Technology, 6(4), 2015,
pp. 45 – 55.
[11] Mr. Shukla B.A. and Prof. Phafat N.G. Experimental Study of Co2 Arc Welding
Parameters on Weld Strength For AISI 1022 Steel Plates Using Response Surface
Methodology, International Journal of Mechanical Engineering and Technology,
4(6), 2015, pp. 37 - 42.
APPENDIX A
Table 1 Essential Variable for PAW
Parameter Value/Range
Automation Level Mechanized/Robotic
Electrode Setback Gauge 1
Orifice Diameter 2.4mm
Shielding Gas Argon @ 18CFH
Plasma Gas Argon @ 2CFH
Voltage Vp = 20V Vb =16V
Amperage Ip = 50A Ib = 9A
Current Type DCEN
Tungsten Type/Size/Prep W+Th,La,Cs / 2.4mm / Pointed with landing
Travel Speed Actual 22.22mm/min Theoretical 20mm/min
Torch Stand-off 4mm
Filler Material 1018 Steel
Base Material Substrate A36 Steel
Transfer Mode Transferred Arc
Welding Mode Melt-In
Table 2 Properties Used to Solve the Analytical Heat Flow Model
Model Property Value1
mo (g) 2607.400000
Δmt (g) 3.280500
Ao (m2) 0.011966
ΔAt (m ) 1.280000E-04
cp [J/(g∙°C)] 0.050000
14. Abdullah Alhuzaim and R. Bruce Madigan
http://www.iaeme.com/IJMET/index.asp 137 editor@iaeme.com
APPENDIX B
Glossary of Terms
Term Definition
A Ampere
Aarc Arc area (mm2)
AC Alternating current
Adep Cumulative deposit area (in².)
Ain Inner surface area of deposit (in².)
AM Additive manufacturing
Ao Original substrate area (in².)
A36 Plain carbon steel alloy
CAD Computer-aided design
Cb Columbium
CC Constant current
DC Direct current
DCEN Direct current electrode negative
DM Direct manufacturing
Eg Thermal energy generation in a control volume (J)
Ein Thermal and mechanical energy entering a control volume (J)
Eout Thermal and mechanical energy leaving a control volume (J)
FFF Free-form fabrication
HAZ Heat-affected zone
hcond Conduction heat transfer coefficient [W/(m ∙K)]
hconv Con ection heat transfer coefficient [W/(m ∙K)]
hcp Hexagonal close-packed
hspec1 Specimen 1 height (mm.)
hspec2 Specimen 2 height (mm.)
ht Weld track height (mm.)
Iarc Arc current (A)
In. Inch
J Joule
K Kelvin
kg Kilogram
ksi 1,000 pounds per square inch
lb. Pound
LM Layered manufacturing
m Meter
MD Metal deposition
mdep Cumulative deposit mass (kg)
min Minute
mm Millimeter
mo Original substrate mass (kg)
nl Layer “n” in the deposit
Nl Number of layers per deposit
15. Investigate and Optimize The Pulsing Effect of Thermo Cycle of Low Carbon Steel Alloy
Deposit In Plasma ARC Welding Additive Manufacturing
http://www.iaeme.com/IJMET/index.asp 138 editor@iaeme.com
Term Definition
nt Track “n” in the deposit
Nt Number of tracks per layer
Parc Arc power (W)
PAW Plasma arc welding
PD Power density (W/mm2)
psi Pounds per square inch
Q Deposit thermal energy lost (J)
Qcond Deposit thermal energy lost via conduction (J)
Qconv Deposit thermal energy lost via convection (J)
Qdep Accumulated deposit thermal energy (J)
Qrad Deposit thermal energy lost via radiation (J)
Qweld Deposit thermal energy gained via PAW (J)
RM Rapid manufacturing
RP Rapid prototyping
s Second
sl Substrate length (mm.)
sw Substrate width (mm.)
sh Substrate height (mm.)
SMD Shaped metal deposition
sv Substrate volume (mm³)
Tdep Deposit temperature (°C)
Texp Experimental deposit surface temperature (°C)
Tfluid Fluid temperature (°C) (used in Mathcad analytical heat flow model solution)
To Original deposit surface temperature (°C)
Ts Deposit temperature (°C) (used in Mathcad analytical heat flow model solution)
tspec Specimen thickness (mm.)
Tsur Surrounding/ambient temperature (°C)
tt Time to weld one track (s)
V Voltage
W Tungsten
W Watt
wt% Weight percent
δtt Wait time between weld tracks (min)
ΔAt Area added to substrate after each weld track (mm.2)
ΔEst Change in thermal and mechanical energy stored in a control volume (J)
Δmt Mass added to substrate after each weld track (kg)
ε Emissivity
ζ Scale factor to modify the convection heat transfer coefficient
ζhcon Modified effecti e con ection heat transfer coefficient [W/(m ∙K)]
λ Scale factor to modify the PAW heat transfer efficiency
η Modified effective PAW heat transfer efficiency (%)
μm Micrometer (1 x 10⁻⁶ m)
ξ Scale factor to modify the conduction heat transfer coefficient
ξhcond Modified effecti e conduction heat transfer coefficient [W/(m ∙K)]
16. Abdullah Alhuzaim and R. Bruce Madigan
http://www.iaeme.com/IJMET/index.asp 139 editor@iaeme.com
Term Definition
π Mathematical constant (≈ 3.14)
ρ Density (g/cm3)
σ Stefan-Boltzmann constant [5.67 x 10⁻⁸ W/(m ∙K4)]
Σ Summation
ψ Scale factor to modify the magnitude of heat lost due to radiation
σ Modified effective Stefan-Boltzmann constant [W/(m ∙K4)]