
Recommended
Recommended
More Related Content
Similar to Note The following table appears in the printed Annual Report.docx
Similar to Note The following table appears in the printed Annual Report.docx (20)
More from henrymartin15260
More from henrymartin15260 (20)
Recently uploaded
Recently uploaded (20)
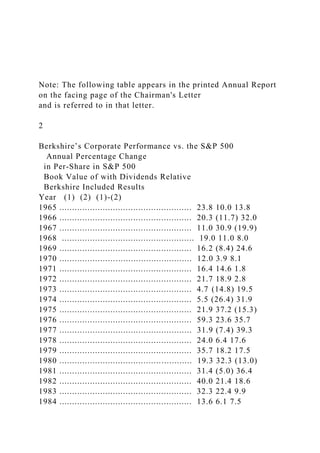
Note The following table appears in the printed Annual Report.docx
- 1. Note: The following table appears in the printed Annual Report on the facing page of the Chairman's Letter and is referred to in that letter. 2 Berkshire’s Corporate Performance vs. the S&P 500 Annual Percentage Change in Per-Share in S&P 500 Book Value of with Dividends Relative Berkshire Included Results Year (1) (2) (1)-(2) 1965 .................................................... 23.8 10.0 13.8 1966 .................................................... 20.3 (11.7) 32.0 1967 .................................................... 11.0 30.9 (19.9) 1968 .................................................... 19.0 11.0 8.0 1969 .................................................... 16.2 (8.4) 24.6 1970 .................................................... 12.0 3.9 8.1 1971 .................................................... 16.4 14.6 1.8 1972 .................................................... 21.7 18.9 2.8 1973 .................................................... 4.7 (14.8) 19.5 1974 .................................................... 5.5 (26.4) 31.9 1975 .................................................... 21.9 37.2 (15.3) 1976 .................................................... 59.3 23.6 35.7 1977 .................................................... 31.9 (7.4) 39.3 1978 .................................................... 24.0 6.4 17.6 1979 .................................................... 35.7 18.2 17.5 1980 .................................................... 19.3 32.3 (13.0) 1981 .................................................... 31.4 (5.0) 36.4 1982 .................................................... 40.0 21.4 18.6 1983 .................................................... 32.3 22.4 9.9 1984 .................................................... 13.6 6.1 7.5
- 2. 1985 .................................................... 48.2 31.6 16.6 1986 .................................................... 26.1 18.6 7.5 1987 .................................................... 19.5 5.1 14.4 1988 .................................................... 20.1 16.6 3.5 1989 .................................................... 44.4 31.7 12.7 1990 .................................................... 7.4 (3.1) 10.5 1991 .................................................... 39.6 30.5 9.1 1992 .................................................... 20.3 7.6 12.7 1993 .................................................... 14.3 10.1 4.2 1994 .................................................... 13.9 1.3 12.6 1995 .................................................... 43.1 37.6 5.5 1996 .................................................... 31.8 23.0 8.8 1997 .................................................... 34.1 33.4 .7 1998 .................................................... 48.3 28.6 19.7 1999 .................................................... .5 21.0 (20.5) 2000 .................................................... 6.5 (9.1) 15.6 2001 .................................................... (6.2) (11.9) 5.7 2002 .................................................... 10.0 (22.1) 32.1 2003 .................................................... 21.0 28.7 (7.7) 2004 .................................................... 10.5 10.9 (.4) 2005 .................................................... 6.4 4.9 1.5 2006 .................................................... 18.4 15.8 2.6 2007 .................................................... 11.0 5.5 5.5 Compounded Annual Gain – 1965-2007 21.1% 10.3% 10.8 Overall Gain – 1964-2007 400,863% 6,840% Notes: Data are for calendar years with these exceptions: 1965 and 1966, year ended 9/30; 1967, 15 months ended 12/31. Starting in 1979, accounting rules required insurance companies to value the equity securities they hold at market rather than at the lower of cost or market, which was previously the requirement. In this table, Berkshire’s results through 1978 have been restated to conform to the changed rules. In all other respects, the results are calculated using
- 3. the numbers originally reported. The S&P 500 numbers are pre-tax whereas the Berkshire numbers are after-tax. If a corporation such as Berkshire were simply to have owned the S&P 500 and accrued the appropriate taxes, its results would have lagged the S&P 500 in years when that index showed a positive return, but would have exceeded the S&P 500 in years when the index showed a negative return. Over the years, the tax costs would have caused the aggregate lag to be substantial. BERKSHIRE HATHAWAY INC. To the Shareholders of Berkshire Hathaway Inc.: Our gain in net worth during 2007 was $12.3 billion, which increased the per-share book value of both our Class A and Class B stock by 11%. Over the last 43 years (that is, since present management took over) book value has grown from $19 to $78,008, a rate of 21.1% compounded annually.* Overall, our 76 operating businesses did well last year. The few that had problems were primarily those linked to housing, among them our brick, carpet and real estate brokerage operations. Their setbacks are minor and temporary. Our competitive position in these businesses remains strong, and we have first- class CEOs who run them right, in good times or bad.
- 4. Some major financial institutions have, however, experienced staggering problems because they engaged in the “weakened lending practices” I described in last year’s letter. John Stumpf, CEO of Wells Fargo, aptly dissected the recent behavior of many lenders: “It is interesting that the industry has invented new ways to lose money when the old ways seemed to work just fine.” You may recall a 2003 Silicon Valley bumper sticker that implored, “Please, God, Just One More Bubble.” Unfortunately, this wish was promptly granted, as just about all Americans came to believe that house prices would forever rise. That conviction made a borrower’s income and cash equity seem unimportant to lenders, who shoveled out money, confident that HPA – house price appreciation – would cure all problems. Today, our country is experiencing widespread pain because of that erroneous belief. As house prices fall, a huge amount of financial folly is being exposed. You only learn who has been swimming naked when the tide goes out – and what we are witnessing at some of our largest financial institutions is an ugly sight. Turning to happier thoughts, we can report that Berkshire’s newest acquisitions of size, TTI and Iscar, led by their CEOs, Paul Andrews and Jacob Harpaz respectively, performed magnificently in 2007. Iscar is as impressive a manufacturing operation as I’ve seen, a view I reported last year and that was
- 5. confirmed by a visit I made in the fall to its extraordinary plant in Korea. Finally, our insurance business – the cornerstone of Berkshire – had an excellent year. Part of the reason is that we have the best collection of insurance managers in the business – more about them later. But we also were very lucky in 2007, the second year in a row free of major insured catastrophes. That party is over. It’s a certainty that insurance-industry profit margins, including ours, will fall significantly in 2008. Prices are down, and exposures inexorably rise. Even if the U.S. has its third consecutive catastrophe-light year, industry profit margins will probably shrink by four percentage points or so. If the winds roar or the earth trembles, results could be far worse. So be prepared for lower insurance earnings during the next few years. Yardsticks Berkshire has two major areas of value. The first is our investments: stocks, bonds and cash equivalents. At yearend these totaled $141 billion (not counting those in our finance or utility operations, which we assign to our second bucket of value). *All per-share figures used in this report apply to Berkshire’s A shares. Figures for the B shares are 1/30th of those shown for the A. 3
- 6. Insurance float – money we temporarily hold in our insurance operations that does not belong to us – funds $59 billion of our investments. This float is “free” as long as insurance underwriting breaks even, meaning that the premiums we receive equal the losses and expenses we incur. Of course, insurance underwriting is volatile, swinging erratically between profits and losses. Over our entire history, however, we’ve been profitable, and I expect we will average breakeven results or better in the future. If we do that, our investments can be viewed as an unencumbered source of value for Berkshire shareholders. Berkshire’s second component of value is earnings that come from sources other than investments and insurance. These earnings are delivered by our 66 non- insurance companies, itemized on page 76. In our early years, we focused on the investment side. During the past two decades, however, we have put ever more emphasis on the development of earnings from non- insurance businesses. The following tables illustrate this shift. In the first we tabulate per-share investments at 14-year intervals. We exclude those applicable to minority interests. Year Per-Share Investments Years
- 7. Compounded Annual Gain in Per-Share Investments 1965 $ 4 1979 577 1965-1979 42.8% 1993 13,961 1979-1993 25.6% 2007 90,343 1993-2007 14.3% For the entire 42 years, our compounded annual gain in per- share investments was 27.1%. But the trend has been downward as we increasingly used our available funds to buy operating businesses. Here’s the record on how earnings of our non-insurance businesses have grown, again on a per- share basis and after applicable minority interests. Year Per Share Pre-Tax Earnings Years Compounded Annual Gain in Per- Share Pre-Tax Earnings 1965 $ 4 1979 18 1965-1979 11.1%
- 8. 1993 212 1979-1993 19.1% 2007 4,093 1993-2007 23.5% For the entire period, the compounded annual gain was 17.8%, with gains accelerating as our focus shifted. Though these tables may help you gain historical perspective and be useful in valuation, they are completely misleading in predicting future possibilities. Berkshire’s past record can’t be duplicated or even approached. Our base of assets and earnings is now far too large for us to make outsized gains in the future. Charlie Munger, my partner at Berkshire, and I will continue to measure our progress by the two yardsticks I have just described and will regularly update you on the results. Though we can’t come close to duplicating the past, we will do our best to make sure the future is not disappointing. * * * * * * * * * * * * In our efforts, we will be aided enormously by the managers who have joined Berkshire. This is an unusual group in several ways. First, most of them have no financial need to work. Many sold us their businesses for large sums and run them because they love doing so, not because they need the money. Naturally they wish to be paid fairly, but money alone is not the reason they work hard and productively. 4
- 9. A second, somewhat related, point about these managers is that they have exactly the job they want for the rest of their working years. At almost any other company, key managers below the top aspire to keep climbing the pyramid. For them, the subsidiary or division they manage today is a way station – or so they hope. Indeed, if they are in their present positions five years from now, they may well feel like failures. Conversely, our CEOs’ scorecards for success are not whether they obtain my job but instead are the long-term performances of their businesses. Their decisions flow from a here-today, here-forever mindset. I think our rare and hard-to-replicate managerial structure gives Berkshire a real advantage. Acquisitions Though our managers may be the best, we will need large and sensible acquisitions to get the growth in operating earnings we wish. Here, we made little progress in 2007 until very late in the year. Then, on Christmas day, Charlie and I finally earned our paychecks by contracting for the largest cash purchase in Berkshire’s history. The seeds of this transaction were planted in 1954. That fall, only three months into a new job, I was sent by my employers, Ben Graham and Jerry Newman, to a shareholders’ meeting of Rockwood Chocolate in Brooklyn. A young fellow had recently taken control of this company, a manufacturer of assorted cocoa-based items. He had then initiated a one-of-a- kind tender, offering 80 pounds of cocoa
- 10. beans for each share of Rockwood stock. I described this transaction in a section of the 1988 annual report that explained arbitrage. I also told you that Jay Pritzker – the young fellow mentioned above – was the business genius behind this tax-efficient idea, the possibilities for which had escaped all the other experts who had thought about buying Rockwood, including my bosses, Ben and Jerry. At the meeting, Jay was friendly and gave me an education on the 1954 tax code. I came away very impressed. Thereafter, I avidly followed Jay’s business dealings, which were many and brilliant. His valued partner was his brother, Bob, who for nearly 50 years ran Marmon Group, the home for most of the Pritzker businesses. Jay died in 1999, and Bob retired early in 2002. Around then, the Pritzker family decided to gradually sell or reorganize certain of its holdings, including Marmon, a company operating 125 businesses, managed through nine sectors. Marmon’s largest operation is Union Tank Car, which together with a Canadian counterpart owns 94,000 rail cars that are leased to various shippers. The original cost of this fleet is $5.1 billion. All told, Marmon has $7 billion in sales and about 20,000 employees. We will soon purchase 60% of Marmon and will acquire virtually all of the balance within six years. Our initial outlay will be $4.5 billion, and the price of our later purchases will be based on a formula tied to earnings. Prior to our entry into the picture, the Pritzker family received substantial consideration from Marmon’s distribution of cash, investments and certain businesses.
- 11. This deal was done in the way Jay would have liked. We arrived at a price using only Marmon’s financial statements, employing no advisors and engaging in no nit-picking. I knew that the business would be exactly as the Pritzkers represented, and they knew that we would close on the dot, however chaotic financial markets might be. During the past year, many large deals have been renegotiated or killed entirely. With the Pritzkers, as with Berkshire, a deal is a deal. Marmon’s CEO, Frank Ptak, works closely with a long-time associate, John Nichols. John was formerly the highly successful CEO of Illinois Tool Works (ITW), where he teamed with Frank to run a mix of industrial businesses. Take a look at their ITW record; you’ll be impressed. 5 Byron Trott of Goldman Sachs – whose praises I sang in the 2003 report – facilitated the Marmon transaction. Byron is the rare investment banker who puts himself in his client’s shoes. Charlie and I trust him completely. You’ll like the code name that Goldman Sachs assigned the deal. Marmon entered the auto business in 1902 and exited it in 1933. Along the way it manufactured the Wasp, a car that won the first Indianapolis 500 race, held in 1911. So this deal was labeled “Indy 500.” * * * * * * * * * * * *
- 12. In May 2006, I spoke at a lunch at Ben Bridge, our Seattle- based jewelry chain. The audience was a number of its vendors, among them Dennis Ulrich, owner of a company that manufactured gold jewelry. In January 2007, Dennis called me, suggesting that with Berkshire’s support he could build a large jewelry supplier. We soon made a deal for his business, simultaneously purchasing a supplier of about equal size. The new company, Richline Group, has since made two smaller acquisitions. Even with those, Richline is far below the earnings threshold we normally require for purchases. I’m willing to bet, however, that Dennis – with the help of his partner, Dave Meleski – will build a large operation, earning good returns on capital employed. Businesses – The Great, the Good and the Gruesome Let’s take a look at what kind of businesses turn us on. And while we’re at it, let’s also discuss what we wish to avoid. Charlie and I look for companies that have a) a business we understand; b) favorable long-term economics; c) able and trustworthy management; and d) a sensible price tag. We like to buy the whole business or, if management is our partner, at least 80%. When control-type purchases of quality aren’t available, though, we are also happy to simply buy small portions of great businesses by way of stock- market purchases. It’s better to have a part interest in the Hope Diamond than to own all of a rhinestone. A truly great business must have an enduring “moat” that protects excellent returns on invested
- 13. capital. The dynamics of capitalism guarantee that competitors will repeatedly assault any business “castle” that is earning high returns. Therefore a formidable barrier such as a company’s being the low- cost producer (GEICO, Costco) or possessing a powerful world- wide brand (Coca-Cola, Gillette, American Express) is essential for sustained success. Business history is filled with “Roman Candles,” companies whose moats proved illusory and were soon crossed. Our criterion of “enduring” causes us to rule out companies in industries prone to rapid and continuous change. Though capitalism’s “creative destruction” is highly beneficial for society, it precludes investment certainty. A moat that must be continuously rebuilt will eventually be no moat at all. Additionally, this criterion eliminates the business whose success depends on having a great manager. Of course, a terrific CEO is a huge asset for any enterprise, and at Berkshire we have an abundance of these managers. Their abilities have created billions of dollars of value that would never have materialized if typical CEOs had been running their businesses. But if a business requires a superstar to produce great results, the business itself cannot be deemed great. A medical partnership led by your area’s premier brain surgeon may enjoy outsized and growing earnings, but that tells little about its future. The partnership’s moat will go when the surgeon goes. You can count, though, on the moat of the Mayo Clinic to endure, even though you can’t name its CEO.
- 14. 6 Long-term competitive advantage in a stable industry is what we seek in a business. If that comes with rapid organic growth, great. But even without organic growth, such a business is rewarding. We will simply take the lush earnings of the business and use them to buy similar businesses elsewhere. There’s no rule that you have to invest money where you’ve earned it. Indeed, it’s often a mistake to do so: Truly great businesses, earning huge returns on tangible assets, can’t for any extended period reinvest a large portion of their earnings internally at high rates of return. Let’s look at the prototype of a dream business, our own See’s Candy. The boxed-chocolates industry in which it operates is unexciting: Per-capita consumption in the U.S. is extremely low and doesn’t grow. Many once-important brands have disappeared, and only three companies have earned more than token profits over the last forty years. Indeed, I believe that See’s, though it obtains the bulk of its revenues from only a few states, accounts for nearly half of the entire industry’s earnings. At See’s, annual sales were 16 million pounds of candy when Blue Chip Stamps purchased the company in 1972. (Charlie and I controlled Blue Chip at the time and later merged it into Berkshire.) Last year See’s sold 31 million pounds, a growth rate of only 2% annually. Yet its durable competitive advantage, built by the See’s family over a 50-year period, and strengthened subsequently by Chuck Huggins and Brad Kinstler, has produced extraordinary results
- 15. for Berkshire. We bought See’s for $25 million when its sales were $30 million and pre-tax earnings were less than $5 million. The capital then required to conduct the business was $8 million. (Modest seasonal debt was also needed for a few months each year.) Consequently, the company was earning 60% pre-tax on invested capital. Two factors helped to minimize the funds required for operations. First, the product was sold for cash, and that eliminated accounts receivable. Second, the production and distribution cycle was short, which minimized inventories. Last year See’s sales were $383 million, and pre-tax profits were $82 million. The capital now required to run the business is $40 million. This means we have had to reinvest only $32 million since 1972 to handle the modest physical growth – and somewhat immodest financial growth – of the business. In the meantime pre-tax earnings have totaled $1.35 billion. All of that, except for the $32 million, has been sent to Berkshire (or, in the early years, to Blue Chip). After paying corporate taxes on the profits, we have used the rest to buy other attractive businesses. Just as Adam and Eve kick-started an activity that led to six billion humans, See’s has given birth to multiple new streams of cash for us. (The biblical command to “be fruitful and multiply” is one we take seriously at Berkshire.) There aren’t many See’s in Corporate America. Typically, companies that increase their earnings from $5 million to $82 million require, say, $400 million or so of capital investment to finance their growth. That’s because growing businesses have both working
- 16. capital needs that increase in proportion to sales growth and significant requirements for fixed asset investments. A company that needs large increases in capital to engender its growth may well prove to be a satisfactory investment. There is, to follow through on our example, nothing shabby about earning $82 million pre-tax on $400 million of net tangible assets. But that equation for the owner is vastly different from the See’s situation. It’s far better to have an ever- increasing stream of earnings with virtually no major capital requirements. Ask Microsoft or Google. One example of good, but far from sensational, business economics is our own FlightSafety. This company delivers benefits to its customers that are the equal of those delivered by any business that I know of. It also possesses a durable competitive advantage: Going to any other flight-training provider than the best is like taking the low bid on a surgical procedure. 7 Nevertheless, this business requires a significant reinvestment of earnings if it is to grow. When we purchased FlightSafety in 1996, its pre-tax operating earnings were $111 million, and its net investment in fixed assets was $570 million. Since our purchase, depreciation charges have totaled $923 million. But capital expenditures have totaled $1.635 billion, most of that for simulators to match the new airplane models that are constantly being introduced. (A simulator can cost us more than $12 million, and we have
- 17. 273 of them.) Our fixed assets, after depreciation, now amount to $1.079 billion. Pre-tax operating earnings in 2007 were $270 million, a gain of $159 million since 1996. That gain gave us a good, but far from See’s-like, return on our incremental investment of $509 million. Consequently, if measured only by economic returns, FlightSafety is an excellent but not extraordinary business. Its put-up-more-to-earn-more experience is that faced by most corporations. For example, our large investment in regulated utilities falls squarely in this category. We will earn considerably more money in this business ten years from now, but we will invest many billions to make it. Now let’s move to the gruesome. The worst sort of business is one that grows rapidly, requires significant capital to engender the growth, and then earns little or no money. Think airlines. Here a durable competitive advantage has proven elusive ever since the days of the Wright Brothers. Indeed, if a farsighted capitalist had been present at Kitty Hawk, he would have done his successors a huge favor by shooting Orville down. The airline industry’s demand for capital ever since that first flight has been insatiable. Investors have poured money into a bottomless pit, attracted by growth when they should have been repelled by it. And I, to my shame, participated in this foolishness when I had Berkshire buy U.S. Air preferred stock in 1989. As the ink was drying on our check, the company went into a tailspin, and before long our preferred dividend was no longer being paid. But we then got very lucky. In one of the recurrent, but always
- 18. misguided, bursts of optimism for airlines, we were actually able to sell our shares in 1998 for a hefty gain. In the decade following our sale, the company went bankrupt. Twice. To sum up, think of three types of “savings accounts.” The great one pays an extraordinarily high interest rate that will rise as the years pass. The good one pays an attractive rate of interest that will be earned also on deposits that are added. Finally, the gruesome account both pays an inadequate interest rate and requires you to keep adding money at those disappointing returns. * * * * * * * * * * * * And now it’s confession time. It should be noted that no consultant, board of directors or investment banker pushed me into the mistakes I will describe. In tennis parlance, they were all unforced errors. To begin with, I almost blew the See’s purchase. The seller was asking $30 million, and I was adamant about not going above $25 million. Fortunately, he caved. Otherwise I would have balked, and that $1.35 billion would have gone to somebody else. About the time of the See’s purchase, Tom Murphy, then running Capital Cities Broadcasting, called and offered me the Dallas-Fort Worth NBC station for $35 million. The station came with the Fort Worth paper that Capital Cities was buying, and under the “cross-ownership” rules Murph had to divest it. I knew that TV stations were See’s-like businesses that required
- 19. virtually no capital investment and had excellent prospects for growth. They were simple to run and showered cash on their owners. Moreover, Murph, then as now, was a close friend, a man I admired as an extraordinary manager and outstanding human being. He knew the television business forward and backward and would not have called me unless he felt a purchase was certain to work. In effect Murph whispered “buy” into my ear. But I didn’t listen. 8 In 2006, the station earned $73 million pre-tax, bringing its total earnings since I turned down the deal to at least $1 billion – almost all available to its owner for other purposes. Moreover, the property now has a capital value of about $800 million. Why did I say “no”? The only explanation is that my brain had gone on vacation and forgot to notify me. (My behavior resembled that of a politician Molly Ivins once described: “If his I.Q. was any lower, you would have to water him twice a day.”) Finally, I made an even worse mistake when I said “yes” to Dexter, a shoe business I bought in 1993 for $433 million in Berkshire stock (25,203 shares of A). What I had assessed as durable competitive advantage vanished within a few years. But that’s just the beginning: By using Berkshire stock, I compounded this error hugely. That move made the cost to
- 20. Berkshire shareholders not $400 million, but rather $3.5 billion. In essence, I gave away 1.6% of a wonderful business – one now valued at $220 billion – to buy a worthless business. To date, Dexter is the worst deal that I’ve made. But I’ll make more mistakes in the future – you can bet on that. A line from Bobby Bare’s country song explains what too often happens with acquisitions: “I’ve never gone to bed with an ugly woman, but I’ve sure woke up with a few.” * * * * * * * * * * * * Now, let’s examine the four major operating sectors of Berkshire. Each sector has vastly different balance sheet and income account characteristics. Therefore, lumping them together impedes analysis. So we’ll present them as four separate businesses, which is how Charlie and I view them. Insurance The best anecdote I’ve heard during the current presidential campaign came from Mitt Romney, who asked his wife, Ann, “When we were young, did you ever in your wildest dreams think I might be president?” To which she replied, “Honey, you weren’t in my wildest dreams.” When we first entered the property/casualty insurance business in 1967, my wildest dreams did not envision our current operation. Here’s how we did in the first five years after purchasing National Indemnity:
- 21. Year Underwriting Profit (Loss) Float (in millions) 1967 $ 0.4 $18.5 1968 0.6 21.3 1969 0.1 25.4 1970 (0.4) 39.4 1971 1.4 65.6 To put it charitably, we were a slow starter. But things changed. Here’s the record of the last five years: Year Underwriting Profit (Loss) Float (in millions) 2003 $1,718 $44,220 2004 1,551 46,094 2005 53 49,287 2006 3,838 50,887 2007 3,374 58,698 This metamorphosis has been accomplished by some extraordinary managers. Let’s look at what each has achieved. 9 • GEICO possesses the widest moat of any of our insurers, one carefully protected and expanded by Tony Nicely, its CEO. Last year – again – GEICO had the best
- 22. growth record among major auto insurers, increasing its market share to 7.2%. When Berkshire acquired control in 1995, that share was 2.5%. Not coincidentally, annual ad expenditures by GEICO have increased from $31 million to $751 million during the same period. Tony, now 64, joined GEICO at 18. Every day since, he has been passionate about the company – proud of how it could both save money for its customers and provide growth opportunities for its associates. Even now, with sales at $12 billion, Tony feels GEICO is just getting started. So do I. Here’s some evidence. In the last three years, GEICO has increased its share of the motorcycle market from 2.1% to 6%. We’ve also recently begun writing policies on ATVs and RVs. And in November we wrote our first commercial auto policy. GEICO and National Indemnity are working together in the commercial field, and early results are very encouraging. Even in aggregate, these lines will remain a small fraction of our personal auto volume. Nevertheless, they should deliver a growing stream of underwriting profits and float. • General Re, our international reinsurer, is by far our largest source of “home-grown” float – $23 billion at yearend. This operation is now a huge asset for Berkshire. Our ownership, however, had a shaky start.
- 23. For decades, General Re was the Tiffany of reinsurers, admired by all for its underwriting skills and discipline. This reputation, unfortunately, outlived its factual underpinnings, a flaw that I completely missed when I made the decision in 1998 to merge with General Re. The General Re of 1998 was not operated as the General Re of 1968 or 1978. Now, thanks to Joe Brandon, General Re’s CEO, and his partner, Tad Montross, the luster of the company has been restored. Joe and Tad have been running the business for six years and have been doing first-class business in a first-class way, to use the words of J. P. Morgan. They have restored discipline to underwriting, reserving and the selection of clients. Their job was made more difficult by costly and time- consuming legacy problems, both in the U.S. and abroad. Despite that diversion, Joe and Tad have delivered excellent underwriting results while skillfully repositioning the company for the future. • Since joining Berkshire in 1986, Ajit Jain has built a truly great specialty reinsurance operation from scratch. For one-of-a-kind mammoth transactions, the world now turns to him. Last year I told you in detail about the Equitas transfer of huge, but capped, liabilities to Berkshire for a single premium of $7.1 billion. At this very early date, our experience has been good. But
- 24. this doesn’t tell us much because it’s just one straw in a fifty- year-or-more wind. What we know for sure, however, is that the London team who joined us, headed by Scott Moser, is first-rate and has become a valuable asset for our insurance business. • Finally, we have our smaller operations, which serve specialized segments of the insurance market. In aggregate, these companies have performed extraordinarily well, earning above- average underwriting profits and delivering valuable float for investment. Last year BoatU.S., headed by Bill Oakerson, was added to the group. This company manages an association of about 650,000 boat owners, providing them services similar to those offered by AAA auto clubs to drivers. Among the association’s offerings is boat insurance. Learn more about this operation by visiting its display at the annual meeting. 10 Below we show the record of our four categories of property/casualty insurance. Underwriting Profit Yearend Float (in millions) Insurance Operations 2007 2006 2007 2006
- 25. General Re ....................... $ 555 $ 526 $23,009 $22,827 BH Reinsurance ............... 1,427 1,658 23,692 16,860 GEICO ............................. 1,113 1,314 7,768 7,171 Other Primary................... 279 340* 4,229 4,029* $3,374 $3,838 $58,698 $50,887 * Includes Applied Underwriters from May 19, 2006. Regulated Utility Business Berkshire has an 87.4% (diluted) interest in MidAmerican Energy Holdings, which owns a wide variety of utility operations. The largest of these are (1) Yorkshire Electricity and Northern Electric, whose 3.8 million electric customers make it the third largest distributor of electricity in the U.K.; (2) MidAmerican Energy, which serves 720,000 electric customers, primarily in Iowa; (3) Pacific Power and Rocky Mountain Power, serving about 1.7 million electric customers in six western states; and (4) Kern River and Northern Natural pipelines, which carry about 8% of the natural gas consumed in the U.S. Our partners in ownership of MidAmerican are Walter Scott, and its two terrific managers, Dave Sokol and Greg Abel. It’s unimportant how many votes each party has; we make major moves only when we are unanimous in thinking them wise. Eight years of working with Dave, Greg and Walter have underscored my original belief: Berkshire couldn’t have better partners. Somewhat incongruously, MidAmerican also owns the second largest real estate brokerage firm in
- 26. the U.S., HomeServices of America. This company operates through 20 locally-branded firms with 18,800 agents. Last year was a slow year for residential sales, and 2008 will probably be slower. We will continue, however, to acquire quality brokerage operations when they are available at sensible prices. Here are some key figures on MidAmerican’s operation: Earnings (in millions) 2007 2006 U.K. utilities ............................................................................................... ........ $ 337 $ 338 Iowa utility ............................................................................................... .......... 412 348 Western utilities (acquired March 21, 2006) ..................................................... 692 356 Pipelines ............................................................................................... .............. 473 376 HomeServices.......................................................................... ........................... 42 74 Other (net) ............................................................................................... ........... 130 245 Earnings before corporate interest and taxes ...................................................... 2,086 1,737 Interest, other than to Berkshire ......................................................................... (312) (261) Interest on Berkshire junior debt ........................................................................ (108) (134) Income tax ...............................................................................................
- 27. ........... (477) (426) Net earnings.................................................................................. ...................... $ 1,189 $ 916 Earnings applicable to Berkshire* ...................................................................... $ 1,114 $ 885 Debt owed to others...................................................................................... ...... 19,002 16,946 Debt owed to Berkshire ...................................................................................... 821 1,055 *Includes interest earned by Berkshire (net of related income taxes) of $70 in 2007 and $87 in 2006. 11 We agreed to purchase 35,464,337 shares of MidAmerican at $35.05 per share in 1999, a year in which its per-share earnings were $2.59. Why the odd figure of $35.05? I originally decided the business was worth $35.00 per share to Berkshire. Now, I’m a “one- price” guy (remember See’s?) and for several days the investment bankers representing MidAmerican had no luck in getting me to increase Berkshire’s offer. But, finally, they caught me in a moment of weakness, and I caved, telling them I would go to $35.05. With that, I explained, they could tell their client they had wrung the last nickel out of me. At the time, it hurt.
- 28. Later on, in 2002, Berkshire purchased 6,700,000 shares at $60 to help finance the acquisition of one of our pipelines. Lastly, in 2006, when MidAmerican bought PacifiCorp, we purchased 23,268,793 shares at $145 per share. In 2007, MidAmerican earned $15.78 per share. However, 77¢ of that was non-recurring – a reduction in deferred tax at our British utility, resulting from a lowering of the U.K. corporate tax rate. So call normalized earnings $15.01 per share. And yes, I’m glad I wilted and offered the extra nickel. Manufacturing, Service and Retailing Operations Our activities in this part of Berkshire cover the waterfront. Let’s look, though, at a summary balance sheet and earnings statement for the entire group. Balance Sheet 12/31/07 (in millions) Assets Liabilities and Equity Cash and equivalents .............................. $ 2,080 Notes payable ............................ $ 1,278 Accounts and notes receivable ............... 4,488 Other current liabilities.............. 7,652 Inventory ................................................ 5,793 Total current liabilities .............. 8,930 Other current assets ................................ 470 Total current assets ................................. 12,831 Goodwill and other intangibles............... 14,201 Deferred taxes............................ 828 Fixed assets............................................. 9,605 Term debt and
- 29. other liabilities... 3,079 Other assets............................................. 1,685 Equity ........................................ 25,485 $38,322 $38,322 Earnings Statement (in millions) 2007 2006 2005 Revenues .................................................................................... $59,100 $52,660 $46,896 Operating expenses (including depreciation of $955 in 2007, $823 in 2006 and $699 in 2005).......................................... 55,026 49,002 44,190 Interest expense .......................................................................... 127 132 83 Pre-tax earnings .......................................................................... 3,947* 3,526* 2,623* Income taxes and minority interests ........................................... 1,594 1,395 977 Net income ................................................................................. $ 2,353 $ 2,131 $ 1,646 *Does not include purchase-accounting adjustments. This motley group, which sells products ranging from lollipops to motor homes, earned a pleasing 23% on average tangible net worth last year. It’s noteworthy also that these operations used only minor
- 30. financial leverage in achieving that return. Clearly we own some terrific businesses. We purchased many of them, however, at large premiums to net worth – a point reflected in the goodwill item shown on the balance sheet – and that fact reduces the earnings on our average carrying value to 9.8%. 12 Here are a few newsworthy items about companies in this sector: • Shaw, Acme Brick, Johns Manville and MiTek were all hurt in 2007 by the sharp housing downturn, with their pre-tax earnings declining 27%, 41%, 38%, and 9% respectively. Overall, these companies earned $941 million pre-tax compared to $1.296 billion in 2006. Last year, Shaw, MiTek and Acme contracted for tuck-in acquisitions that will help future earnings. You can be sure they will be looking for more of these. • In a tough year for retailing, our standouts were See’s, Borsheims and Nebraska Furniture Mart. Two years ago Brad Kinstler was made CEO of See’s. We very seldom move managers from one
- 31. industry to another at Berkshire. But we made an exception with Brad, who had previously run our uniform company, Fechheimer, and Cypress Insurance. The move could not have worked out better. In his two years, profits at See’s have increased more than 50%. At Borsheims, sales increased 15.1%, helped by a 27% gain during Shareholder Weekend. Two years ago, Susan Jacques suggested that we remodel and expand the store. I was skeptical, but Susan was right. Susan came to Borsheims 25 years ago as a $4-an-hour saleswoman. Though she lacked a managerial background, I did not hesitate to make her CEO in 1994. She’s smart, she loves the business, and she loves her associates. That beats having an MBA degree any time. (An aside: Charlie and I are not big fans of resumes. Instead, we focus on brains, passion and integrity. Another of our great managers is Cathy Baron Tamraz, who has significantly increased Business Wire’s earnings since we purchased it early in 2006. She is an owner’s dream. It is positively dangerous to stand between Cathy and a business prospect. Cathy, it should be noted, began her career as a cab driver.) Finally, at Nebraska Furniture Mart, earnings hit a record as our Omaha and Kansas City stores each had sales of about $400 million. These, by some margin, are the two top home furnishings stores in the country. In a disastrous year for many furniture
- 32. retailers, sales at Kansas City increased 8%, while in Omaha the gain was 6%. Credit the remarkable Blumkin brothers, Ron and Irv, for this performance. Both are close personal friends of mine and great businessmen. • Iscar continues its wondrous ways. Its products are small carbide cutting tools that make large and very expensive machine tools more productive. The raw material for carbide is tungsten, mined in China. For many decades, Iscar moved tungsten to Israel, where brains turned it into something far more valuable. Late in 2007, Iscar opened a large plant in Dalian, China. In effect, we’ve now moved the brains to the tungsten. Major opportunities for growth await Iscar. Its management team, led by Eitan Wertheimer, Jacob Harpaz, and Danny Goldman, is certain to make the most of them. • Flight services set a record in 2007 with pre-tax earnings increasing 49% to $547 million. Corporate aviation had an extraordinary year worldwide, and both of our companies – as runaway leaders in their fields – fully participated. FlightSafety, our pilot training business, gained 14% in revenues and 20% in pre-tax earnings. We estimate that we train about 58% of U.S. corporate pilots. Bruce Whitman, the company’s CEO, inherited this leadership position in 2003 from Al Ueltschi, the father of advanced flight
- 33. training, and has proved to be a worthy successor. 13 At NetJets, the inventor of fractional-ownership of jets, we also remain the unchallenged leader. We now operate 487 planes in the U.S. and 135 in Europe, a fleet more than twice the size of that operated by our three major competitors combined. Because our share of the large-cabin market is near 90%, our lead in value terms is far greater. The NetJets brand – with its promise of safety, service and security – grows stronger every year. Behind this is the passion of one man, Richard Santulli. If you were to pick someone to join you in a foxhole, you couldn’t do better than Rich. No matter what the obstacles, he just doesn’t stop. Europe is the best example of how Rich’s tenacity leads to success. For the first ten years we made little financial progress there, actually running up cumulative losses of $212 million. After Rich brought Mark Booth on board to run Europe, however, we began to gain traction. Now we have real momentum, and last year earnings tripled. In November, our directors met at NetJets headquarters in Columbus and got a look at the sophisticated operation there. It is responsible for 1,000 or so flights a day in all kinds of weather, with customers expecting top-notch service. Our directors came away impressed by the facility and its capabilities – but even more impressed by Rich and his
- 34. associates. Finance and Finance Products Our major operation in this category is Clayton Homes, the largest U.S. manufacturer and marketer of manufactured homes. Clayton’s market share hit a record 31% last year. But industry volume continues to shrink: Last year, manufactured home sales were 96,000, down from 131,000 in 2003, the year we bought Clayton. (At the time, it should be remembered, some commentators criticized its directors for selling at a cyclical bottom.) Though Clayton earns money from both manufacturing and retailing its homes, most of its earnings come from an $11 billion loan portfolio, covering 300,000 borrowers. That’s why we include Clayton’s operation in this finance section. Despite the many problems that surfaced during 2007 in real estate finance, the Clayton portfolio is performing well. Delinquencies, foreclosures and losses during the year were at rates similar to those we experienced in our previous years of ownership. Clayton’s loan portfolio is financed by Berkshire. For this funding, we charge Clayton one percentage point over Berkshire’s borrowing cost – a fee that amounted to $85 million last year. Clayton’s 2007 pre-tax earnings of $526 million are after its paying this fee. The flip side of this transaction is that Berkshire recorded $85 million as income, which is included in “other” in the following table.
- 35. Pre-Tax Earnings (in millions) 2007 2006 Trading – ordinary income ............................. $ 272 $ 274 Life and annuity operation ............................ (60) 29 Leasing operations ........................................ 111 182 Manufactured-housing finance (Clayton)....... 526 513 Other............................................................... 157 159 Income before capital gains............................ 1,006 1,157 Trading – capital gains .................................. 105 938 $1,111 $2,095 The leasing operations tabulated are XTRA, which rents trailers, and CORT, which rents furniture. Utilization of trailers was down considerably in 2007 and that led to a drop in earnings at XTRA. That company also borrowed $400 million last year and distributed the proceeds to Berkshire. The resulting higher interest it is now paying further reduced XTRA’s earnings. 14 Clayton, XTRA and CORT are all good businesses, very ably run by Kevin Clayton, Bill Franz and Paul Arnold. Each has made tuck-in acquisitions during Berkshire’s ownership. More will come. Investments We show below our common stock investments at yearend, itemizing those with a market value of
- 36. at least $600 million. 12/31/07 Percentage of Shares Company Company Owned Cost* Market (in millions) 151,610,700 American Express Company ................... 13.1 $ 1,287 $ 7,887 35,563,200 Anheuser-Busch Companies, Inc............. 4.8 1,718 1,861 60,828,818 Burlington Northern Santa Fe.................. 17.5 4,731 5,063 200,000,000 The Coca-Cola Company ........................ 8.6 1,299 12,274 17,508,700 Conoco Phillips ....................................... 1.1 1,039 1,546 64,271,948 Johnson & Johnson.................................. 2.2 3,943 4,287 124,393,800 Kraft Foods Inc........................................ 8.1 4,152 4,059 48,000,000 Moody’s Corporation .............................. 19.1 499 1,714 3,486,006 POSCO .................................................... 4.5 572 2,136 101,472,000 The Procter & Gamble Company ............ 3.3 1,030 7,450 17,170,953 Sanofi-Aventis......................................... 1.3 1,466 1,575
- 37. 227,307,000 Tesco plc.................................................. 2.9 1,326 2,156 75,176,026 U.S. Bancorp ........................................... 4.4 2,417 2,386 17,072,192 USG Corp ................................................ 17.2 536 611 19,944,300 Wal-Mart Stores, Inc. .............................. 0.5 942 948 1,727,765 The Washington Post Company .............. 18.2 11 1,367 303,407,068 Wells Fargo & Company ......................... 9.2 6,677 9,160 1,724,200 White Mountains Insurance Group Ltd. .. 16.3 369 886 Others ...................................................... 5,238 7,633 Total Common Stocks ............................. $39,252 $74,999 *This is our actual purchase price and also our tax basis; GAAP “cost” differs in a few cases because of write-ups or write-downs that have been required. Overall, we are delighted by the business performance of our investees. In 2007, American Express, Coca-Cola and Procter & Gamble, three of our four largest holdings, increased per-share earnings by 12%, 14% and 14%. The fourth, Wells Fargo, had a small decline in earnings because of the popping of the real estate bubble. Nevertheless, I believe its intrinsic value increased, even if only by a minor amount. In the strange world department, note that American Express and Wells Fargo were both
- 38. organized by Henry Wells and William Fargo, Amex in 1850 and Wells in 1852. P&G and Coke began business in 1837 and 1886 respectively. Start-ups are not our game. I should emphasize that we do not measure the progress of our investments by what their market prices do during any given year. Rather, we evaluate their performance by the two methods we apply to the businesses we own. The first test is improvement in earnings, with our making due allowance for industry conditions. The second test, more subjective, is whether their “moats” – a metaphor for the superiorities they possess that make life difficult for their competitors – have widened during the year. All of the “big four” scored positively on that test. 15 We made one large sale last year. In 2002 and 2003 Berkshire bought 1.3% of PetroChina for $488 million, a price that valued the entire business at about $37 billion. Charlie and I then felt that the company was worth about $100 billion. By 2007, two factors had materially increased its value: the price of oil had climbed significantly, and PetroChina’s management had done a great job in building oil and gas reserves. In the second half of last year, the market value of the company rose to $275 billion, about what we thought it was worth compared to other giant oil companies. So we sold our holdings for $4 billion. A footnote: We paid the IRS tax of $1.2 billion on our PetroChina gain. This sum paid all costs of
- 39. the U.S. government – defense, social security, you name it – for about four hours. * * * * * * * * * * * * Last year I told you that Berkshire had 62 derivative contracts that I manage. (We also have a few left in the General Re runoff book.) Today, we have 94 of these, and they fall into two categories. First, we have written 54 contracts that require us to make payments if certain bonds that are included in various high-yield indices default. These contracts expire at various times from 2009 to 2013. At yearend we had received $3.2 billion in premiums on these contracts; had paid $472 million in losses; and in the worst case (though it is extremely unlikely to occur) could be required to pay an additional $4.7 billion. We are certain to make many more payments. But I believe that on premium revenues alone, these contracts will prove profitable, leaving aside what we can earn on the large sums we hold. Our yearend liability for this exposure was recorded at $1.8 billion and is included in “Derivative Contract Liabilities” on our balance sheet. The second category of contracts involves various put options we have sold on four stock indices (the S&P 500 plus three foreign indices). These puts had original terms of either 15 or 20 years and were struck at the market. We have received premiums of $4.5 billion, and we recorded a liability at yearend of $4.6 billion. The puts in these contracts are exercisable only at their expiration dates, which occur between 2019 and 2027, and Berkshire will then need to make a payment
- 40. only if the index in question is quoted at a level below that existing on the day that the put was written. Again, I believe these contracts, in aggregate, will be profitable and that we will, in addition, receive substantial income from our investment of the premiums we hold during the 15- or 20-year period. Two aspects of our derivative contracts are particularly important. First, in all cases we hold the money, which means that we have no counterparty risk. Second, accounting rules for our derivative contracts differ from those applying to our investment portfolio. In that portfolio, changes in value are applied to the net worth shown on Berkshire’s balance sheet, but do not affect earnings unless we sell (or write down) a holding. Changes in the value of a derivative contract, however, must be applied each quarter to earnings. Thus, our derivative positions will sometimes cause large swings in reported earnings, even though Charlie and I might believe the intrinsic value of these positions has changed little. He and I will not be bothered by these swings – even though they could easily amount to $1 billion or more in a quarter – and we hope you won’t be either. You will recall that in our catastrophe insurance business, we are always ready to trade increased volatility in reported earnings in the short run for greater gains in net worth in the long run. That is our philosophy in derivatives as well. * * * * * * * * * * * * The U.S. dollar weakened further in 2007 against major currencies, and it’s no mystery why: Americans like buying products made elsewhere more than the
- 41. rest of the world likes buying products made in the U.S. Inevitably, that causes America to ship about $2 billion of IOUs and assets daily to the rest of the world. And over time, that puts pressure on the dollar. 16 When the dollar falls, it both makes our products cheaper for foreigners to buy and their products more expensive for U.S. citizens. That’s why a falling currency is supposed to cure a trade deficit. Indeed, the U.S. deficit has undoubtedly been tempered by the large drop in the dollar. But ponder this: In 2002 when the Euro averaged 94.6¢, our trade deficit with Germany (the fifth largest of our trading partners) was $36 billion, whereas in 2007, with the Euro averaging $1.37, our deficit with Germany was up to $45 billion. Similarly, the Canadian dollar averaged 64¢ in 2002 and 93¢ in 2007. Yet our trade deficit with Canada rose as well, from $50 billion in 2002 to $64 billion in 2007. So far, at least, a plunging dollar has not done much to bring our trade activity into balance. There’s been much talk recently of sovereign wealth funds and how they are buying large pieces of American businesses. This is our doing, not some nefarious plot by foreign governments. Our trade equation guarantees massive foreign investment in the U.S. When we force-feed $2 billion daily to the rest of the world, they must invest in something here. Why should we complain when they choose stocks over bonds?
- 42. Our country’s weakening currency is not the fault of OPEC, China, etc. Other developed countries rely on imported oil and compete against Chinese imports just as we do. In developing a sensible trade policy, the U.S. should not single out countries to punish or industries to protect. Nor should we take actions likely to evoke retaliatory behavior that will reduce America’s exports, true trade that benefits both our country and the rest of the world. Our legislators should recognize, however, that the current imbalances are unsustainable and should therefore adopt policies that will materially reduce them sooner rather than later. Otherwise our $2 billion daily of force-fed dollars to the rest of the world may produce global indigestion of an unpleasant sort. (For other comments about the unsustainability of our trade deficits, see Alan Greenspan’s comments on November 19, 2004, the Federal Open Market Committee’s minutes of June 29, 2004, and Ben Bernanke’s statement on September 11, 2007.) * * * * * * * * * * * * At Berkshire we held only one direct currency position during 2007. That was in – hold your breath – the Brazilian real. Not long ago, swapping dollars for reals would have been unthinkable. After all, during the past century five versions of Brazilian currency have, in effect, turned into confetti. As has been true in many countries whose currencies have periodically withered and died, wealthy Brazilians sometimes stashed large sums in the U.S. to preserve their wealth. But any Brazilian who followed this apparently prudent course would have lost half his net worth
- 43. over the past five years. Here’s the year-by-year record (indexed) of the real versus the dollar from the end of 2002 to yearend 2007: 100; 122; 133; 152; 166; 199. Every year the real went up and the dollar fell. Moreover, during much of this period the Brazilian government was actually holding down the value of the real and supporting our currency by buying dollars in the market. Our direct currency positions have yielded $2.3 billion of pre- tax profits over the past five years, and in addition we have profited by holding bonds of U.S. companies that are denominated in other currencies. For example, in 2001 and 2002 we purchased €310 million Amazon.com, Inc. 6 7/8 of 2010 at 57% of par. At the time, Amazon bonds were priced as “junk” credits, though they were anything but. (Yes, Virginia, you can occasionally find markets that are ridiculously inefficient – or at least you can find them anywhere except at the finance departments of some leading business schools.) The Euro denomination of the Amazon bonds was a further, and important, attraction for us. The Euro was at 95¢ when we bought in 2002. Therefore, our cost in dollars came to only $169 million. Now the bonds sell at 102% of par and the Euro is worth $1.47. In 2005 and 2006 some of our bonds were called and we received $253 million for them. Our remaining bonds were valued at $162 million at yearend. Of our $246 million of realized and unrealized gain, about $118 million is attributable to the fall in the dollar. Currencies do matter. 17
- 44. At Berkshire, we will attempt to further increase our stream of direct and indirect foreign earnings. Even if we are successful, however, our assets and earnings will always be concentrated in the U.S. Despite our country’s many imperfections and unrelenting problems of one sort or another, America’s rule of law, market-responsive economic system, and belief in meritocracy are almost certain to produce ever- growing prosperity for its citizens. * * * * * * * * * * * * As I have told you before, we have for some time been well- prepared for CEO succession because we have three outstanding internal candidates. The board knows exactly whom it would pick if I were to become unavailable, either because of death or diminishing abilities. And that would still leave the board with two backups. Last year I told you that we would also promptly complete a succession plan for the investment job at Berkshire, and we have indeed now identified four candidates who could succeed me in managing investments. All manage substantial sums currently, and all have indicated a strong interest in coming to Berkshire if called. The board knows the strengths of the four and would expect to hire one or more if the need arises. The candidates are young to middle-aged, well-to- do to rich, and all wish to work for Berkshire for reasons that go beyond compensation. (I’ve reluctantly discarded the notion of my continuing to manage the portfolio after my death – abandoning my hope to give new meaning to the term “thinking
- 45. outside the box.”) Fanciful Figures – How Public Companies Juice Earnings Former Senator Alan Simpson famously said: “Those who travel the high road in Washington need not fear heavy traffic.” If he had sought truly deserted streets, however, the Senator should have looked to Corporate America’s accounting. An important referendum on which road businesses prefer occurred in 1994. America’s CEOs had just strong-armed the U.S. Senate into ordering the Financial Accounting Standards Board to shut up, by a vote that was 88-9. Before that rebuke the FASB had shown the audacity – by unanimous agreement, no less – to tell corporate chieftains that the stock options they were being awarded represented a form of compensation and that their value should be recorded as an expense. After the senators voted, the FASB – now educated on accounting principles by the Senate’s 88 closet CPAs – decreed that companies could choose between two methods of reporting on options. The preferred treatment would be to expense their value, but it would also be allowable for companies to ignore the expense as long as their options were issued at market value. A moment of truth had now arrived for America’s CEOs, and their reaction was not a pretty sight. During the next six years, exactly two of the 500 companies in the S&P chose the preferred route. CEOs of the rest opted for the low road, thereby ignoring a large and obvious expense in order to report higher
- 46. “earnings.” I’m sure some of them also felt that if they opted for expensing, their directors might in future years think twice before approving the mega-grants the managers longed for. It turned out that for many CEOs even the low road wasn’t good enough. Under the weakened rule, there remained earnings consequences if options were issued with a strike price below market value. No problem. To avoid that bothersome rule, a number of companies surreptitiously backdated options to falsely indicate that they were granted at current market prices, when in fact they were dished out at prices well below market. Decades of option-accounting nonsense have now been put to rest, but other accounting choices remain – important among these the investment-return assumption a company uses in calculating pension expense. It will come as no surprise that many companies continue to choose an assumption that allows them to report less-than-solid “earnings.” For the 363 companies in the S&P that have pension plans, this assumption in 2006 averaged 8%. Let’s look at the chances of that being achieved. 18 The average holdings of bonds and cash for all pension funds is about 28%, and on these assets returns can be expected to be no more than 5%. Higher yields, of course, are obtainable but they carry with them a risk of commensurate (or greater) loss.
- 47. This means that the remaining 72% of assets – which are mostly in equities, either held directly or through vehicles such as hedge funds or private-equity investments – must earn 9.2% in order for the fund overall to achieve the postulated 8%. And that return must be delivered after all fees, which are now far higher than they have ever been. How realistic is this expectation? Let’s revisit some data I mentioned two years ago: During the 20th Century, the Dow advanced from 66 to 11,497. This gain, though it appears huge, shrinks to 5.3% when compounded annually. An investor who owned the Dow throughout the century would also have received generous dividends for much of the period, but only about 2% or so in the final years. It was a wonderful century. Think now about this century. For investors to merely match that 5.3% market-value gain, the Dow – recently below 13,000 – would need to close at about 2,000,000 on December 31, 2099. We are now eight years into this century, and we have racked up less than 2,000 of the 1,988,000 Dow points the market needed to travel in this hundred years to equal the 5.3% of the last. It’s amusing that commentators regularly hyperventilate at the prospect of the Dow crossing an even number of thousands, such as 14,000 or 15,000. If they keep reacting that way, a 5.3% annual gain for the century will mean they experience at least 1,986 seizures during the next 92 years. While anything is possible, does anyone really believe this is the most likely outcome?
- 48. Dividends continue to run about 2%. Even if stocks were to average the 5.3% annual appreciation of the 1900s, the equity portion of plan assets – allowing for expenses of .5% – would produce no more than 7% or so. And .5% may well understate costs, given the presence of layers of consultants and high- priced managers (“helpers”). Naturally, everyone expects to be above average. And those helpers – bless their hearts – will certainly encourage their clients in this belief. But, as a class, the helper-aided group must be below average. The reason is simple: 1) Investors, overall, will necessarily earn an average return, minus costs they incur; 2) Passive and index investors, through their very inactivity, will earn that average minus costs that are very low; 3) With that group earning average returns, so must the remaining group – the active investors. But this group will incur high transaction, management, and advisory costs. Therefore, the active investors will have their returns diminished by a far greater percentage than will their inactive brethren. That means that the passive group – the “know- nothings” – must win. I should mention that people who expect to earn 10% annually from equities during this century – envisioning that 2% of that will come from dividends and 8% from price appreciation – are implicitly forecasting a level of about 24,000,000 on the Dow by 2100. If your adviser talks to you about double- digit returns from equities, explain this math to him – not that it will faze him. Many helpers are apparently direct descendants of the queen in Alice in Wonderland, who said: “Why, sometimes I’ve believed as many as six impossible things before breakfast.” Beware the glib
- 49. helper who fills your head with fantasies while he fills his pockets with fees. Some companies have pension plans in Europe as well as in the U.S. and, in their accounting, almost all assume that the U.S. plans will earn more than the non-U.S. plans. This discrepancy is puzzling: Why should these companies not put their U.S. managers in charge of the non-U.S. pension assets and let them work their magic on these assets as well? I’ve never seen this puzzle explained. But the auditors and actuaries who are charged with vetting the return assumptions seem to have no problem with it. 19 What is no puzzle, however, is why CEOs opt for a high investment assumption: It lets them report higher earnings. And if they are wrong, as I believe they are, the chickens won’t come home to roost until long after they retire. After decades of pushing the envelope – or worse – in its attempt to report the highest number possible for current earnings, Corporate America should ease up. It should listen to my partner, Charlie: “If you’ve hit three balls out of bounds to the left, aim a little to the right on the next swing.” * * * * * * * * * * * * Whatever pension-cost surprises are in store for shareholders down the road, these jolts will be surpassed many times over by those experienced by taxpayers. Public pension promises are huge and, in
- 50. many cases, funding is woefully inadequate. Because the fuse on this time bomb is long, politicians flinch from inflicting tax pain, given that problems will only become apparent long after these officials have departed. Promises involving very early retirement – sometimes to those in their low 40s – and generous cost-of-living adjustments are easy for these officials to make. In a world where people are living longer and inflation is certain, those promises will be anything but easy to keep. * * * * * * * * * * * * Having laid out the failures of an “honor system” in American accounting, I need to point out that this is exactly the system existing at Berkshire for a truly huge balance-sheet item. In every report we make to you, we must guesstimate the loss reserves for our insurance units. If our estimate is wrong, it means that both our balance sheet and our earnings statement will be wrong. So naturally we do our best to make these guesses accurate. Nevertheless, in every report our estimate is sure to be wrong. At yearend 2007, we show an insurance liability of $56 billion that represents our guess as to what we will eventually pay for all loss events that occurred before yearend (except for about $3 billion of the reserve that has been discounted to present value). We know of many thousands of events and have put a dollar value on each that reflects what we believe we will pay, including the associated costs (such as attorney’s fees) that we will incur in the payment process. In some cases, among them claims for certain serious injuries covered by worker’s compensation, payments will be made for 50 years or more.
- 51. We also include a large reserve for losses that occurred before yearend but that we have yet to hear about. Sometimes, the insured itself does not know that a loss has occurred. (Think of an embezzlement that remains undiscovered for years.) We sometimes hear about losses from policies that covered our insured many decades ago. A story I told you some years back illustrates our problem in accurately estimating our loss liability: A fellow was on an important business trip in Europe when his sister called to tell him that their dad had died. Her brother explained that he couldn’t get back but said to spare nothing on the funeral, whose cost he would cover. When he returned, his sister told him that the service had been beautiful and presented him with bills totaling $8,000. He paid up but a month later received a bill from the mortuary for $10. He paid that, too – and still another $10 charge he received a month later. When a third $10 invoice was sent to him the following month, the perplexed man called his sister to ask what was going on. “Oh,” she replied, “I forgot to tell you. We buried Dad in a rented suit.” At our insurance companies we have an unknown, but most certainly large, number of “rented suits” buried around the world. We try to estimate the bill for them accurately. In ten or twenty years, we will even be able to make a good guess as to how inaccurate our present guess is. But even that guess will be subject to surprises. I personally believe our stated reserves are adequate, but I’ve been wrong several times in the past. 20
- 52. The Annual Meeting Our meeting this year will be held on Saturday, May 3rd. As always, the doors will open at the Qwest Center at 7 a.m., and a new Berkshire movie will be shown at 8:30. At 9:30 we will go directly to the question-and-answer period, which (with a break for lunch at the Qwest’s stands) will last until 3:00. Then, after a short recess, Charlie and I will convene the annual meeting at 3:15. If you decide to leave during the day’s question periods, please do so while Charlie is talking. The best reason to exit, of course is to shop. We will help you do that by filling the 194,300- square-foot hall that adjoins the meeting area with the products of Berkshire subsidiaries. Last year, the 27,000 people who came to the meeting did their part, and almost every location racked up record sales. But you can do better. (If necessary, I’ll lock the doors.) This year we will again showcase a Clayton home (featuring Acme brick, Shaw carpet, Johns Manville insulation, MiTek fasteners, Carefree awnings and NFM furniture). You will find that this 1,550- square-foot home, priced at $69,500, delivers exceptional value. And after you purchase the house, consider also acquiring the Forest River RV and pontoon boat on display nearby. GEICO will have a booth staffed by a number of its top counselors from around the country, all of them ready to supply you with auto insurance quotes. In most
- 53. cases, GEICO will be able to give you a special shareholder discount (usually 8%). This special offer is permitted by 45 of the 50 jurisdictions in which we operate. (One supplemental point: The discount is not additive if you qualify for another, such as that given certain groups.) Bring the details of your existing insurance and check out whether we can save you money. For at least 50% of you, I believe we can. On Saturday, at the Omaha airport, we will have the usual array of aircraft from NetJets available for your inspection. Stop by the NetJets booth at the Qwest to learn about viewing these planes. Come to Omaha by bus; leave in your new plane. And take all the hair gel and scissors that you wish on board with you. Next, if you have any money left, visit the Bookworm, where you will find about 25 books and DVDs – all discounted – led again by Poor Charlie’s Almanack. Without any advertising or bookstore placement, Charlie’s book has now remarkably sold nearly 50,000 copies. For those of you who can’t make the meeting, go to poorcharliesalmanack.com to order a copy. An attachment to the proxy material that is enclosed with this report explains how you can obtain the credential you will need for admission to the meeting and other events. As for plane, hotel and car reservations, we have again signed up American Express (800- 799-6634) to give you special help. Carol Pedersen, who handles these matters, does a terrific job for us each year, and I thank her for it. Hotel rooms can be hard to find, but work with Carol and you will get one.
- 54. At Nebraska Furniture Mart, located on a 77-acre site on 72nd Street between Dodge and Pacific, we will again be having “Berkshire Weekend” discount pricing. We initiated this special event at NFM eleven years ago, and sales during the “Weekend” grew from $5.3 million in 1997 to $30.9 million in 2007. This is more volume than most furniture stores register in a year. To obtain the Berkshire discount, you must make your purchases between Thursday, May 1st and Monday, May 5th inclusive, and also present your meeting credential. The period’s special pricing will even apply to the products of several prestigious manufacturers that normally have ironclad rules against discounting but which, in the spirit of our shareholder weekend, have made an exception for you. We appreciate their cooperation. NFM is open from 10 a.m. to 9 p.m. Monday through Saturday, and 10 a.m. to 6 p.m. on Sunday. On Saturday this year, from 5:30 p.m. to 8 p.m., NFM is having a Baja Beach Bash featuring beef and chicken tacos. 21 http://www.poorcharliesalmanack.com/ At Borsheims, we will again have two shareholder-only events. The first will be a cocktail reception from 6 p.m. to 10 p.m. on Friday, May 2nd. The second, the main gala, will be held on Sunday, May 4th, from 9 a.m. to 4 p.m. On Saturday, we will be open until 6 p.m.
- 55. We will have huge crowds at Borsheims throughout the weekend. For your convenience, therefore, shareholder prices will be available from Monday, April 28th through Saturday, May 10th. During that period, please identify yourself as a shareholder by presenting your meeting credentials or a brokerage statement that shows you are a Berkshire holder. On Sunday, in a tent outside of Borsheims, a blindfolded Patrick Wolff, twice U.S. chess champion, will take on all comers – who will have their eyes wide open – in groups of six. Nearby, Norman Beck, a remarkable magician from Dallas, will bewilder onlookers. Additionally, we will have Bob Hamman and Sharon Osberg, two of the world’s top bridge experts, available to play bridge with our shareholders on Sunday afternoon. Gorat’s will again be open exclusively for Berkshire shareholders on Sunday, May 4th, and will be serving from 4 p.m. until 10 p.m. Last year Gorat’s, which seats 240, served 915 dinners on Shareholder Sunday. The three-day total was 2,487 including 656 T-bone steaks, the entrée preferred by the cognoscenti. Please remember that to come to Gorat’s on that day, you must have a reservation. To make one, call 402-551-3733 on April 1st (but not before). We will again have a reception at 4 p.m. on Saturday afternoon for shareholders who have come from outside of North America. Every year our meeting draws many people from around the globe, and Charlie and I want to be sure we personally greet those who have come so far. Last year we enjoyed meeting more than 400 of you from many dozens of countries. Any shareholder who comes from other
- 56. than the U.S. or Canada will be given a special credential and instructions for attending this function. * * * * * * * * * * * * At 84 and 77, Charlie and I remain lucky beyond our dreams. We were born in America; had terrific parents who saw that we got good educations; have enjoyed wonderful families and great health; and came equipped with a “business” gene that allows us to prosper in a manner hugely disproportionate to that experienced by many people who contribute as much or more to our society’s well-being. Moreover, we have long had jobs that we love, in which we are helped in countless ways by talented and cheerful associates. Every day is exciting to us; no wonder we tap-dance to work. But nothing is more fun for us than getting together with our shareholder-partners at Berkshire’s annual meeting. So join us on May 3rd at the Qwest for our annual Woodstock for Capitalists. We’ll see you there. February 2008 Warren E. Buffett Chairman of the Board 22