SlideShare a Scribd company logo
1 of 52
Biofuel contribution to mitigate fossil fuel CO2 emissions:
Comparing sugar cane ethanol in Brazil with corn
ethanol and discussing land use for food production
and deforestation
Luiz Pinguelli Rosa,a� Christiano Pires de Campos,b� and
Maria Silvia Muylaert de Araujoc�
COPPE/UFRJ, Cidade Universitária Centro de Tecnologia,
Bloco G, sala 101 Ilha do
Fundão, CP 68501, 21945-970 Rio de Janeiro, Rio de Janeiro,
Brazil
�Received 8 October 2008; accepted 30 April 2009; published
online 30 June 2009�
This paper compares the use of sugar cane and corn for the
production of ethanol,
with a focus on global warming and the current international
debate about land use
competition for food and biofuel production. The indicators
used to compare the
products are CO2 emissions, energy consumption, sugar cane
coproducts, and de-
forestation. The life cycle emission inventory as a
methodological tool is taken into
account. The sustainability of socioeconomic development and
the developing
countries’ need to overcome barriers form the background
against which the Bra-
zilian government energy plans are analyzed. © 2009 American
Institute of
Physics. �DOI: 10.1063/1.3139803�
I. INTRODUCTION
The use of biofuel as a substitute for fossil fuel has became a
crucial issue today for several
reasons, including �a� the increasing price of the oil barrel and
the limited oil resources in the
world, �b� the increase in fossil fuel consumption in
developing countries, particularly in China, as
a result of high economic growth, �c� environmental
constraints, mainly greenhouse gas �GHG�
emissions and climate change, �d� the challenges of
sustainable development and the elimination
of extreme poverty in developing countries, and �e� the
potential impacts of biofuels on crops for
food supply, as well as on deforestation.
A literature review was developed to consider the results of
recent publications about the role
of the biofuel production in the world for programs of GHG
emission reductions and sustainable
environmental performance. “Depending on the methodology
used to account for the local pol-
lutant emissions and the global greenhouse gases emissions
during the production and consump-
tion of both the fossil and biofuels, the results can show huge
differences. If it is taken into
account a life cycle inventory approach to compare the different
fuel sources, these results can
present controversies. For example, a comparison study
involving the American oil diesel and
soybean diesel developed by the National Renewable Energy
Laboratory presents CO2 emissions
for the biodiesel which are almost 20% of the emissions for the
oil diesel: 136 g CO2 / bhp-h for
the biodiesel from soybean and 633 g CO2 / bhp-h for the oil
diesel.”
1
According to other authors2 the quite relevant issue of the
carbon content and the related GHG
emission factors also shows huge differences. It is very
important “to determine the size of carbon
pools in native habitats and the amount of carbon lost from
these pools when converted to crop
production.3 The relevant carbon pools differed depending on
the native habitat and the biofuel
crop.” A study developed by Fargione et al. about land clearing
and the biofuel carbon debt says
a�Electronic mail: [email protected] Tel.: 55-21-25627024.
Tel./FAX: 55-21-22701580.
b�Electronic mail: [email protected] Tel.: 55-21-38656188.
c�Electronic mail: [email protected] Tel.: 55-21-22993080.
JOURNAL OF RENEWABLE AND SUSTAINABLE ENERGY
1, 033111 �2009�
1, 033111-11941-7012/2009/1�3�/033111/21/$25.00 © 2009
American Institute of Physics
http://dx.doi.org/10.1063/1.3139803
that “when not presented in the literature, dry forest biomass
was assumed to be 50% carbon, and
US grasslands dry biomass was assumed to be 45% carbon.”4 It
is important to highlight that these
percentages can result in significant errors and need further
research.
Another recent study shows that agricultural crops most
commonly used at present for biofuel
production and climate protection can readily lead to enhanced
greenhouse warming. This state-
ment relates to N2O. “When the extra N2O emission from
biofuel production is calculated in
‘CO2-equivalent’ global warming terms, and compared with the
quasicooling effect of ‘saving’
emissions of fossil fuel derived CO2, the outcome is that the
production of commonly used
biofuels, such as biodiesel from rapeseed and bioethanol from
corn �maize�, depending on N
fertilizer uptake efficiency by the plants, can contribute as
much or more to global warming by
N2O emissions than cooling by fossil fuel savings.”
5
Oil still ranks first place among the primary sources of energy,
representing 35% of total
primary energy in the world, followed by coal, with more than
20%, and natural gas, with a
slightly lower percentage. Combined, these three fossil fuels
were responsible for three quarters of
the world’s energy budget.6 Biomass was dominant throughout
the 19th century, being surpassed
by coal at the transition from the 19th to the 20th century, and
then by oil by the mid-1900s.6
Although its share went down over time, until the 1970s, it has
remained nearly constant over the
past few decades, at about 10%. One of the reasons for this was
the increase in liquid biofuels as
substitutes for oil, compensating for the decrease in the
traditional uses as firewood.
The oil barrel price went up from US$10 in 1999 to US$70 in
2006, reaching over US$100 in
2007 and US$140 in 2008, and then coming down to less than
US$100. One factor that explains
this behavior is the forecast of limited world oil reserves and
production in the near future.7
Although such forecast is uncertain, it does influence
policymakers and the market.
Other factors that influence the oil economy and related policies
include the increase in energy
consumption �EC� in developing countries, especially in
China, and the Organisation for Eco-
nomic Co-operation and Development �OECD� dependence on
oil import. Last but not least, we
should also mention environmental pressures related to global
warming as a result of present and
historical GHG emissions from fossil fuels.8–11
Besides the Asian developing countries, after more than a
decade of hard monetarist restric-
tions and a very low development rate, several Latin America
countries, including Brazil, have had
significant economic growth over the past years. Nonetheless,
in spite of the recent income im-
provement of part of the poor, social inequality persists in many
countries. Left-wing or center-left
political parties did win governmental elections in several Latin
American countries, and the
resulting political changes that were implemented implied a
more direct role of the government in
the energy sector.
The next section discusses the increasing GHG emissions from
fossil fuels in the world and
shows that, according to the 2007 IPCC Report, CO2 from fossil
fuels is the main contributing
factor for global warming �Sec. II�. Section III introduces the
case of Brazil, considering energy
uses and GHG emissions in the country. Section IV deals with
biofuel production in Brazil.
Section V discusses sugar cane ethanol in Brazil and compares
it with corn ethanol. Section VI
deals with land use, competition with food production, and
deforestation. Section VII includes the
final comments.
II. WORLD CO2 EMISSIONS FROM FOSSIL FUELS
According to the IPCC Fourth Assessment Report,12 there was
a 70% increase in the world’s
GHG emissions during the 1970–2004 period. CO2 emissions
increased to 80%; 77% of GHG
emissions in 2004 were anthropogenic. The highest
contributions for the increase in GHG emis-
sions during the period came from the electric energy system
�145%�, followed by transportation
�120%�, industry �65%�, and change in land uses and
deforestation �40%�. The combined per
capita emission from the US and Canada was 27 tons of CO2
equivalent, while in Latin America,
it was 8 tons and in Africa, 4 tons.
Therefore, we could state that CO2 is responsible for most GHG
emissions, while energy
033111-2 Rosa et al. J. Renewable Sustainable Energy 1,
033111 �2009�
continues to be the most important source of emissions,
including electricity generation, transpor-
tation, and industrial activities. Here is the present situation in
the world:
�1� Until now, the developed countries have not reduced their
emissions in order to reach the
goals of the Kyoto Protocol, whose period of commitment
started in 2008 and will end in
2012.
�2� Developing countries tend to increase their emission as
their economy grows because they
follow the developed countries’ consumption patterns.
Figures 1 and 2 illustrate both statements. Figure 1 shows the
energy per capita in different
countries. The horizontal axis �X� in Fig. 1 shows the gross
domestic product �GDP� per capita,
while the vertical axis �Y� shows the energy intensity of the
economy �energy per GDP� in such a
FIG. 1. Energy per capita �E / population = E / GDP � GDP /
population� Data are from 1980, 1985, 1990, 1995, 2000, and
2005. Source: Calculated from Ref. 13.
FIG. 2. CO2 Emissions per capita from energy �CO2 /
population = E / population � CO2 / E� Data are from 1980,
1985, 1990,
1995, 2000, and 2005. Source: Calculated from Ref. 13.
033111-3 Ethanol, climate change, land use... J. Renewable
Sustainable Energy 1, 033111 �2009�
way that the product XY = energy per capita, represented by the
hyperbolas at constant values. The
points represent the years 1980, 1985, 1990, 1995, 2000, and
2005 for each country �see legend�.
As shown, developed countries have higher GDP per capita and
higher energy per capita. The
courses followed by them from 1980 to 2005 are quite parallel
to the hyperbolas of constant
energy per capita, which means that this rate will remain the
same along this period. Spain, on the
other hand, has shown a significant increase in energy per
capita. There was a reduction in the
intensity of energy in most developed countries, but the GDP
per capita growth was high. The
GDP is expressed in current dollars; nevertheless, the growth of
GDP per capita over this 25 year
period was impressive.
In the developing countries, the situation is quite different: very
low GDP per capita �X axis�
and very low energy per capita �hyperbolas near XY axis�.
Figure 1 shows an increase in energy
per capita, but GDP per capita in general remained very low.
Figure 2 shows CO2 emission per capita from EC in different
countries. The horizontal axis
�X� represents energy per capita, while the vertical axis �Y�
depicts the carbon intensity of the
energy system in such a way that the product XY = CO2
emission per capita, represented by the
hyperbolas at constant values. The points represent the same
years and the same countries as Fig.
1.
The developed countries have higher energy per capita and
higher CO2 emission per capita
from the energy system. Their CO2 emissions per capita from
1980 to 2005 are not as simple as
for energy per capita. Developing countries have very low
energy per capita �X axis� and very low
CO2 emission per capita from energy transformation
�hyperbolas closer to XY axis�. There was a
trend to increase CO2 per capita.
III. ENERGY USES AND GHG EMISSIONS IN BRAZIL
In developing countries, EC in the higher income classes is
often high; however, once the
majority of the population is poor, their EC level is very low.
Therefore, there is strong inequality
in EC and GHG emissions by family within each country,
mirroring inequality in income distri-
bution. The same inequality existing between developed
countries and developing ones is repro-
duced within each country between the high income and the low
income classes.14 Such is the case
of Brazil. As of 2003, an estimated 12 million Brazilians did not
have access to electricity, 88% of
which are rural residents. In most of the north region of Brazil
�in the Amazon�, there is no grid.
There are isolated systems burning diesel oil for electricity
generation, which in 2006 spent US$2
billion in subsidies. The governmental program Luz para todos
�Power for All� is reducing such
discrepancies.15
One in every eight Brazilians owns a car.16 According to Table
I, the consumption of energy
by cars in 2007 in Brazil was 22.49 Mtoe �megatons of oil
equivalent� �13.87 Mtoe of gasoline
+8.62 Mtoe of ethanol�, while the consumption of diesel oil in
transportation for that same year
was 28.83 Mtoe,17 from which it is estimated that roughly 10
Mtoe were consumed for public
transportation of passengers. Therefore, 12.5% of the Brazilians
consume in their cars more than
twice the fuel consumed for public transportation, which is used
mainly by 87.5% of the popula-
tion, i.e., by those families that do not own a car. The above
calculation does not include the
electric energy use in public transportation or the use of diesel
in private cars because they were
considered insignificant in Brazil. Assuming that CO2 emission
from ethanol is zero and CO2
TABLE I. EC in transport �Brazil, 2007�. Source: Ref. 17.
Mtoe
Diesel 28.83
Gasoline 13.87
Ethanol 8.62
Othersa 5.58
aIncludes fuel oil, aviation kerosene, natural gas, and
electricity.
033111-4 Rosa et al. J. Renewable Sustainable Energy 1,
033111 �2009�
emission from gasoline is approximately equal to that from
diesel, CO2 emission from every car
owner is 9.7 times higher than that of an individual that does
not own a car.
The recent discovery of large oil fields in Brazil by Petrobras—
the so-called Pre-sal area in off
shore deep waters—places the country in a very unique
situation, entirely different from the world
trend. Brazilian oil reserves may reach �30 – 80� � 109
barrels, as compared to the current 14
� 109 barrels. However, in Brazil, renewable energy is an
important component of the energy
matrix. In 2006, renewable energy amounted to 42%, while its
shares in the rest of the world were
about 10% and 5% in the OECD countries �Fig. 3�.
The renewable energy sources used in large scale in Brazil are
hydroelectric energy, alcohol
�ethanol� from sugar cane, sugar cane bagasse, firewood, and
charcoal �Fig. 4�. Lines in Fig. 4
depict the energy fluxes from energy sources to consumption
sectors in the boxes located in the
middle. Boxes at the top represent fossil energy, including
nuclear energy, while renewable
sources are at the bottom, some of them used in large scale.
FIG. 3. Renewable and fossil fuel energy. Source: Ref. 17.
FIG. 4. Energy flows from source to consumption: fossil and
renewable energy in Brazil.
033111-5 Ethanol, climate change, land use... J. Renewable
Sustainable Energy 1, 033111 �2009�
Among the primary energy sources in the top section of Fig. 4,
oil, natural gas, and coal are
responsible for CO2 emissions, but nuclear is not, unless the
entire life cycle is taken into account.
Another important observation is that, among the renewable
energy sources in the bottom, hydro-
electric energy emits GHG. Although hydropower plant
emissions are not included in national
inventories of GHG emissions, experimental measures carried
out in hydropower reservoirs by a
COPPE research group found methane and carbon dioxide
emissions, although generally at levels
far lower than those of thermopower plants.18
There are in Brazil programs for alternative sources and
conservation of energy to avoid GHG
emissions involving oil and electricity government-owned
companies: �1� the programs for con-
servation of energy adopted by Eletrobras and Petrobras; �2� a
program implemented by Eletrobras
to buy electric energy from wind, biomass, and small hydro
�3.3 GW� started in 2003; �3� a blend
of biodiesel in diesel oil, according to regulations, starting from
2% and increasing to 3%, involv-
ing Petrobras and private companies; and �4� incentives for
flex-fuel vehicles that use either
ethanol or gasoline in any proportion.
IV. BIOFUELS IN BRAZIL AND AUTOMOTIVE ETHANOL
There are different sources of biofuels, including �1� forest
resources �deforestation and forest
management�, �2� energy agriculture �forest plantation,
sugar cane, corn, vegetable oils�, �3� ag-
riculture wastes �sugar cane bagasse, rice waste, and others,
animal wastes�, and �4� urban wastes
�solid waste and garbage�. Table II indicates the biomass raw
materials with the corresponding
technologies, products, and uses in Brazil, as well as the fossil
fuels that are replaced.
In rural areas, direct combustion of firewood is important for
cooking. This kind of firewood
use is not equivalent to deforestation because families in rural
areas often collect branches of trees,
without destroying them.
The use of charcoal in steel industry is important for avoiding
GHG emissions. For each ton
of steel, about 2 tons of CO2 are emitted from coke and coal.
Charcoal use in steel production
avoids that emission and allows a capture of 1 ton of CO2 from
the atmosphere due to the carbon
fixed in forest plantation stock. Therefore, the net balance when
replacing coke with charcoal is
the subtraction of 3 tons of CO2 from the atmosphere for each
ton of steel. This means that if
TABLE II. Uses of bioenergy in Brazil.
Technology Biomass raw material Products Main use
Substitution of fossil fuels
Combustion Firewood Heat Cooking LPG
Sugar cane, bagasse, and trash Industry Fuel oil
Electric power Natural gas
Wastesa
Bioconversion:
• Fermentation Sugar cane Ethanol Transport Gasolineb
• Anaerobic digestion Wastes Biogas Potential use Natural gas
Chemical and thermal:
• Pyrolysis Wood Charcoal Industry Coal and oil
• Gasification Biomass Synthesis gas Industry Natural gas
• Esterification
Vegetable oil
and other materialsc Biodiesel Transport Diesel
• Cracking Vegetable oil Diesel R&D Diesel
• Hbiod Vegetable oil Diesel Pilot Diesel
Hydrolysis �2nd generation� Biomass Ethanol R&D Gasolineb
aIncludes urban solid wastes, lixivia from the pulp and paper
industry, waste from rice, and others.
bIt can also be a diesel oil substitute with the use of some
additives; in Brazil, gasoline is blended with 25% of ethanol,
besides the use of pure ethanol in flex-fuel vehicles.
cIncludes animal fat waste, garbage, and microalgae �R&D�.
dTechnology of Petrobras for processing vegetable oil in oil
refineries.
033111-6 Rosa et al. J. Renewable Sustainable Energy 1,
033111 �2009�
one-third of steel would be produced with charcoal, the steel
industry in Brazil could have zero net
emissions. However, nearly half of the firewood for charcoal
used in steel production comes from
deforestation and only half comes from forest plantation. This is
a problem that has yet to be
solved.
Ethanol is the most important biofuel in Brazil. The Brazilian
Alcohol Program started in 1975
after the first oil shock, and, in its first phase, consisted of
using ethanol as an additive to gasoline.
After the second oil shock in 1979, there was a second phase in
which, besides its use as an
additive to gasoline, ethanol replaced gasoline in cars whose
Otto cycle engines were adapted
accordingly. The historical factors contributing for the policy of
incentives to start the Alcohol
Program included the need of reducing the commercial balance
deficit, affected by crude oil
imports. Besides, the program also created new jobs in the sugar
cane agroindustry and reduced air
pollution through the elimination of plumb as an additive to
gasoline once ethanol allows high
compression in the engine.
By 1985, more than 90% of new car sales were of ethanol fueled
cars, but in the 1990s there
was a shortage of ethanol in the country. A temporary solution
was the adoption of a ternary mix
composed of ethanol, methanol, and gasoline to supply part of
the market.19,20 The result was the
lack of consumer confidence in ethanol and the consequent
reduction in new car sales with ethanol
fueled engines to 11% in 1990, 2% in 1995, and only 1% in
2000.21 The reasons for the ethanol
shortage were the decrease in crude oil price and the lack of
continuity in the governmental policy
regarding ethanol.
From 2003 on, flex-fuel car production in Brazil ramped up the
automotive use of ethanol.
The flex-fuel cars were initially produced in the US in the
1980s, but the technology developed by
Brazilian automotive industry engineers in the country is
innovative.22 It uses sensors already
existing in the car and matches their readings against
information stored in an on board computer
to adjust the engine to the fuel. The American flex-fuel cars
used a special sensor to identify the
fuel and adjust the engine accordingly, but it was expensive and
unpractical for Brazil, where the
car fleet is dominated by small and middle sized compact, low-
cost cars.22
Figure 5 depicts ethanol consumption in Brazil. The total
ethanol consumption exceeded 15
� 109 l in 1998, progressively decreasing to 10 � 109 l in
2001, then going up again. It reached
17 � 109 l in 2006, and in 2007 ethanol production exceeded 20
� 109 l, of which 3.3 � 109 l
were exported.17 Figure 6 shows the evolution of new car sales.
It points out the dominance of
ethanol-fueled cars in the mid-1980s, a decrease in the 1990s,
and the exponential growth of
flex-fuel cars after 2003, encouraged by the high relative price
of gasoline due to the raise in the
crude oil price internationally, as well as by global warming-
related pressures, among other fac-
tors.
FIG. 5. Evolution of ethanol consumption in Brazil ��109 l /
year�. Source: Ref. 17.
033111-7 Ethanol, climate change, land use... J. Renewable
Sustainable Energy 1, 033111 �2009�
The cost of ethanol in Brazil went down from US$20/GJ in 1980
to US$6/GJ in 2006,
corresponding to US$40/barrel of oil23 following a learning
curve. Therefore, while subsidies were
necessary to start the program, they are no longer needed.
V. LIFE CYCLE CO2 AVOIDED WITH THE USE OF
ETHANOL AS A SUBSTITUTE FOR
GASOLINE
A. Net avoided GHG emissions: Comparing sugar cane ethanol
with corn ethanol
A problem regarding ethanol in some OECD countries, as well
as in China, is the fact that
corn ethanol is used in some countries. From the perspective of
global warming and GHG
emissions—for instance, CO2 emissions from fossil fuel
burning—corn ethanol is less effective
than sugar cane ethanol as a substitute for gasoline.
The advantage of biofuels is that, as biomass grows, it captures
the CO2 emitted by biofuel
combustion in car engines from the atmosphere. However, the
production of 1.3 GJ of ethanol
from corn uses up 1 GJ of fossil fuel.24 That is, from each
energy unit transformed in heat through
corn ethanol combustion, 0.77 energy unit is spent for the
production of ethanol from corn. The
issue is the consumption of fuel oil for ethanol distillation, as
shown in Fig. 7. The variables are
as follows:
• A, emissions from fossil fuels to make the equipment and for
the construction of buildings for
corn and ethanol production in a life cycle analysis;
• B, emissions from fossil fuels to produce fertilizers and other
materials;
• C, emissions from fossil fuels in corn production �includes
emissions from diesel oil in
tractors, mechanization equipment, and trucks for
transportation� and from the soil;
• D, capture of CO2 from the atmosphere as corn grows;
• E, emissions from fossil fuels in ethanol distillation;
• F, emissions from electricity generation in the grid for ethanol
production;
• G, emissions from ethanol combustion in cars; and
• H, gross avoided emissions from the use of ethanol as gasoline
substitute in a life cycle
analysis.
Figure 7 shows that there is a balance between CO2 capture
from the atmosphere in corn
plantation �D� and CO2 emissions �G� from ethanol
combustion in cars:
FIG. 6. Sales of gasoline, alcohol, and flex-fuel cars in Brazil.
Source: Ref. 21.
033111-8 Rosa et al. J. Renewable Sustainable Energy 1,
033111 �2009�
balance of CO2 capture by corn: D = G . �1�
However, there are emissions from fossil fuel use in the
production of corn and ethanol. Therefore,
if H is the CO2 that would be emitted by the use of ethanol as a
gasoline substitute:
net avoided CO2 by corn ethanol: N = H − A − B − C − E − F .
�2�
On the other hand, sugar cane has enough of biomass surplus to
generate heat and electricity
in the ethanol production process �Fig. 8�. For each 1 GJ of
fossil fuel consumed in sugar cane and
ethanol production, there is an average of 9 GJ of ethanol �it
can reach 11 GJ at best�.24 Therefore,
for each unit of energy transformed in heat when sugar cane
ethanol is burned in car engines, only
0.11 unit of energy from fossil fuel is spent for the production
of ethanol. Besides the bagasse,
sugar cane has a significant amount of trash �leaves and top�,
which is often burned before
harvesting in order to facilitate the job of workers, but trash can
be recovered when mechanization
is used instead of manpower in the harvesting of sugar cane.
The use of mechanization in sugar
cane plantations is increasing in the State of São Paulo, but this
reduces employment levels.
The variables represented in Fig. 8 are as follows:
• A, emissions from fossil fuel to make the equipment and for
the construction of buildings for
cane and ethanol production in a life cycle analysis;
• B, emissions from fossil fuel to produce fertilizers and other
materials;
• C, emissions from fossil fuel in sugar cane production �it
includes emissions from diesel oil
in tractors, mechanized harvesting, and trucks for
transportation� and from soil �N2O�, as
well as CH4 and N2O emissions from burning sugar cane
�trash� before harvesting;
• C�, CO2 emissions from burning sugar cane before
harvesting;
• D, capture of CO2 from the atmosphere while sugar cane
grows;
• E, emissions from sugar cane bagasse combustion in ethanol
production;
• F, emissions from bagasse combustion for electricity
generation;
FIG. 7. GHG emissions from corn ethanol production and
avoided CO2 emissions.
033111-9 Ethanol, climate change, land use... J. Renewable
Sustainable Energy 1, 033111 �2009�
• G, emissions in ethanol combustion in cars;
• H, gross avoided emissions of the use of ethanol as a gasoline
substitute in a life cycle
analysis; and
• H�, gross avoided emissions of fossil fuel for electric
generation in the grid, which is re-
placed by electric energy sold by the distilleries using the
surplus of bagasse �and trash� after
their self-consumption in ethanol production.
As shown in Fig. 8, CO2 capture while sugar cane grows �D�
is equal to the CO2 emitted when
ethanol is burned in car engines �G� plus CO2 emission from
the burning of sugar cane before
harvesting �C�� plus emissions from bagasse combustion in
ethanol distillation �E� and in elec-
tricity generation �F� for ethanol production:
balance of CO2 capture by sugar cane: D = C� + E + F + G .
�3�
However, there are emissions in sugar cane and ethanol
production to be subtracted from the gross
avoided emission H + H� in such a way that
net avoided CO2 by sugar cane ethanol: N = H + H� − A − B −
C . �4�
In the production of ethanol from corn, the unbalanced emission
is A + B + C + E + F in Eq. �2�,
while for sugar cane ethanol it is A + B + C in Eq. �4�. So,
assuming that variables A, B, and C in
Eq. �2� are not too different, respectively, from A, B, and C in
Eq. �4�, it is clear that net avoided
CO2 from sugar cane ethanol is higher than net avoided CO2
from corn ethanol:
N�sugar cane� � N�corn� . �5�
To calculate the net avoided CO2 emissions, we must subtract,
from the gross avoided CO2
emissions due to the use of ethanol as fossil fuel substitute, the
emissions of CO2 from fossil fuels
used in the sugar cane and ethanol production process, as well
as other GHG emitted for the
production of sugar cane and ethanol.
We must also express the mass of each non-CO2 GHG in terms
of equivalent CO2 emissions.
For that end, we have used here the global warming power
�GWP� for each GHG as provided in
the IPCC 1995 Report, incorporated by the UN Climate
Convention as a kind of regulation for
FIG. 8. GHG emissions from sugar cane ethanol production and
avoided CO2 emissions.
033111-10 Rosa et al. J. Renewable Sustainable Energy 1,
033111 �2009�
policymakers and adopted in national inventories and by the
Clean Development Mechanism
�CDM�. The GWP figures have been evaluated by IPCC
reports according to the definition by
Lashof and Ahuja.25 This definition provides the relative effect
of each GHG in thermal radiation
forcing on Earth’s surface using CO2 as a reference: GWP
�CO2� = 1. However, it does not repre-
sent the relative effect of each GHG in global temperature
increase due to anthropogenic GHG.12
Therefore, 1 kg of gas X corresponds to GWP�X , T� kg
equivalent of CO2, where T indicates the
period of time for which the GWP is calculated �usually, T =
100 years�.
There is in the literature a range of values for emissions in
sugar cane production �it is usual
to express alternatively the emission in terms of mass of carbon
in the molecule; for instance, the
mass of C in CO2 is 12 / �12 + 2 � 16� = 12 / 44 of the CO2
mass and the mass of C in CH4 is
12 / �12 + 4 � 1� = 12 / 16 of the CH4 mass� and for avoided
CO2 depending on the case and on the
methodology used. For instance, different papers consider
alternatively the following:
�a� the best situation, a particular case or the average of a set
of farmers and distilleries over a
period of time;
�b� either only the gross avoided emission H from the use of
ethanol as a gasoline substitute or
the gross avoided emission H + H�, including the gross avoided
emission H� of fossil fuel for
electric generation in the grid;
�c� either only the direct EC or the life cycle analysis,
including emissions in ethanol production
and in gasoline production to calculate H; and
�d� hydrated ethanol, anhydrous ethanol, or a mix of them in
the market.
Sometimes it is not clear which of the possible alternatives was
chosen, generating confusion in
quotations.
B. Numerical results from field research data on sugar cane
ethanol
A detailed life cycle analysis was presented in a report funded
by the Secretary of Environ-
ment of the State of São Paulo.26 The report was based on three
surveys, the first one covering
26–31 distilleries, the second one 17–22, and the third one
including a larger set of 98 distilleries
all over the country. Using this report as a reference, it is
possible to calculate representative
values for emissions from sugar cane and ethanol production in
percentages of CO2 equivalent
�Table III�.
The GHG emissions in sugar cane and ethanol production and
the CO2 that is avoided by
ethanol �kg CO2 equivalent / m3 of ethanol� are presented in
Table IV. The calculation of the
figures in Table IV deserves a detailed technical explanation.
The lower heat value of ethanol is
compensated by higher compression rate and better efficiency of
the engine. In the use of anhy-
drous ethanol as a gasoline additive, in a 25% proportion in
Brazil �E25�, 1 l of ethanol corre-
sponds to 1 l of gasoline. In the case of hydrated ethanol, the
proportion is 1.3 l of ethanol �E100�
TABLE III. GHG emissions in sugar cane ethanol production
�percentages of CO2 equivalent�. Based on data from Ref.
26.
Source of emission Kind of emission Percentage
From life cycle �A�: equipment, buildings, etc. In sugar cane
production 6.6
In ethanol production 9.5
From fertilizers, etc. �B� In sugar cane production 20.6
From burning sugar cane before harvest �C� CH4 19.1
N2O 18.2
From soil �C� N2O 6.9
From fossil fuel consumption �C� CO2 19.1
Adding up �according to Fig. 10� A 16.1
B 20.6
C 63.3
033111-11 Ethanol, climate change, land use... J. Renewable
Sustainable Energy 1, 033111 �2009�
to 1 l of E25, which means 1 l of ethanol for 0.77 l of E25 or
0.77 � 0.75 = 0.577 l of gasoline. The
direct emission factor of gasoline is 0.0693 kg CO2 / MJ.
27 but in life cycle it becomes
0.0817 kg CO2 / MJ.
28 Using the above data, it is possible to calculate the net
avoided CO2 in
terms of percentage of fossil fuel CO2 emissions:
P = 1 − �A + B + C�/�H + H�� . �6�
The results are presented in Table IV as follows:
Average Best value
Percentage of avoided CO2
For anhydrous ethanol 86.5% 88.2%
For hydrated ethanol 80.7% 84.1%
Instead of the hypothesis of the use of bagasse as a substitute
for fuel oil to calculate H�, the
emissions from electric power generation in Brazilian
interconnected grid established for the CDM
can be applied. More recent data on the average emissions can
be obtained from Macedo et al.,3
considering the 2005/2006 harvest. Their case study focused on
a set of Brazilian distilleries that
process 100 Mton of sugar cane per year. The results are as
follows:
�a� For sugar cane and ethanol production, the total GHG
emissions using GWP �Ref. 29� are
A + B + C = 436 kg CO2 equivalent / m3 of ethanol.
�b� The net CO2 avoided emissions N = H + H� − �A + B +
C� = 2323 kg CO2 / m3 of
anhydrous ethanol �formula �4��.
�c� Applying formula �6�, the percentage of fossil fuel CO2
emission avoided due to anhydrous
ethanol is P = 84.1%.
The results above, although smaller than those of Table IV,
confirm that a very high percentage of
GHG emission is avoided by the use of sugar cane ethanol as a
substitute for gasoline.
We have estimated below the difference between the
percentages of avoided CO2 emission by
TABLE IV. Energy gain, GHG emissions, and percentage of
CO2 that is avoided by the ethanol industry in Brazil. Based
on data extracted from Ref. 26.
Results from 2002/2003 harvest Average Best value scenario
EC �Mcal/ton sugar cane�
Sugar cane 48.2 45.8
Ethanol production 11.8 9.5
Total 60.0 55.3
EP �Mcal/ton sugar cane� �ethanol + electric energy from
bagasse surplus� 499.4 565.7
Energy gain �EP/EC� 8.3 10.2
GHG emissions �kg CO2 equivalent/ton cane�
From fossil fuel consumption 19.2 17.7
Others 15.3 15.3
Total 34.5 33.0
Total GHG emission �kg CO2 equivalent / m3 of ethanol�
�A + B + C in Fig. 10� 405.8 358.7
Net avoided CO2 �kg CO2 / m3 of ethanol� from gasoline
and fuel oil for electric energy
N = H + H� − �A + B + C� in Fig. 8
For anhydrous ethanol 2600 2700
For hydrated ethanol 1700 1900
033111-12 Rosa et al. J. Renewable Sustainable Energy 1,
033111 �2009�
sugar cane ethanol and by corn ethanol, predicted by inequality
�5�. In the hypothesis of burning
fossil fuel for EC at the distillery, as in the case of corn
ethanol, the percentage P should be
calculated by
P = 1 − �A + B + C + E + F�/H . �7�
In Brazil, nearly 1 ton of bagasse is consumed to produce 2 m3
of ethanol,30 which means
about 20 900 MJ / m3. Assuming that this value is the self-
consumption of energy at the distillery
�from bagasse combustion� and that, instead of bagasse,
natural gas is burned, whose emission in
life cycle is 0.095 kg CO2 equivalent / MJ,
28 E + F = 20 900 � 0.095 = 1985 kg CO2 equivalent,
and using formula �7�, for a first approximation, the
percentage of GHG emission that is avoided
is reduced to P = 12%.
The above calculation simulates the percentage of CO2 that is
avoided in case fossil fuel is
burned to produce ethanol. This is what occurs for the
production of corn ethanol �Fig. 7�. Even
though emissions factors A, B, and C in ethanol production are
not the same for corn and sugar
cane as raw material, this figure makes it clear that the
percentage of CO2 that is avoided by corn
ethanol is lower than that of sugar cane ethanol. If P is doubled,
its value will nonetheless be small
�24%�. Actually, the value of P for corn ethanol can be a little
bit higher depending on the
efficiency of energy transformation in corn ethanol production.
C. Potential of energy efficiency and harvest mechanization for
avoiding GHG
1. Potential to improve the energy gain from ethanol, bagasse,
and trash
The energy balance of sugar cane ethanol can be improved by
�a� increasing sugar cane productivity in tons of sugar cane
per hectare,
�b� increasing the amount of ethanol produced from each ton
of sugar cane,
�c� using more trash, which means increasing mechanization
to reduce sugar cane burning
before harvesting, and
�d� improving efficiency in bagasse and trash energy
transformation in heat and in mechanical
and electric energies.
The sugar cane productivity went up from 2024 l per hectare in
1975 to 5931 l per hectare in
2005.31 The production in the 1975–2006 period increased from
89 � 106 metric tons to 426
� 106 metric tons.32 The results for recent years are shown in
Table V.
55% of sugar cane was used for producing 17.7 Mm3 of ethanol
in 2006, that is, 233 Mton
with 75.7 l/ton of sugar cane. In 2007/2008, the production is
20.3 Mm3 of ethanol and the
forecast for 2008/2009 is 24 Mm3, from which 58% of sugar
cane will be for used for ethanol
production.33 The best value is 92 l/ton of sugar cane.33
Should a change in the national average
in 2006 occur, reaching the best value above, there should be a
21% increase. It is expected that
CO2 saving H �formula �6�� through the use of ethanol as a
substitute for gasoline could increase
in the same proportion.
The energy generated from bagasse and trash �top and leaves�
is quite significant. Each ton of
sugar cane has 280 kg of bagasse with 50% of humidity and
2130 kcal/kg,30 providing 596 Mcal
per ton of sugar cane. Assuming the same average value for
trash, the energy of bagasse and trash
is more than double that of ethanol energy �Table VI�
calculated with 92 l with 0.8 kg/l and heat
value of 6500 kcal/kg.30
TABLE V. Sugar cane and ethanol production and productivity.
Source: Ref. 33.
Year
Processed cane
�Mton�
Ethanol
�Mm3�
Productivity
�l/ton�
2003 359.3 14.5 74.8
2006 426.0 17.7 75.7
033111-13 Ethanol, climate change, land use... J. Renewable
Sustainable Energy 1, 033111 �2009�
In 2006, the bagasse production reached 121.0 Mton: 71.5 Mton
�59.1%� for sugar production,
42.0 Mton �34.7%� for ethanol production, and 7.5 Mton
�6.2%� for electric power, part of it to the
grid.30 Trash is not computed. Therefore, 94% of bagasse is
used to make heat and mechanical
work for sugar and ethanol production. If there is a reduction of
20% in this percentage through
efficiency improvement, the energy of bagasse available for
electric power increases by a factor of
0.25 / 0.062 = 4.
Besides, if 50% of trash is used, thermal energy for electric
generation will increase by a
factor of 0.75 / 0.062 = 12. Nowadays only a small part of
electric energy from bagasse is sold to
the grid, the avoided GHG emission H� due to electric energy
sale to the grid will be multiplied
by a factor of more than 12.
If H� goes up, the amount of CO2 avoided will be higher than
the amount avoided from the
use of ethanol as a gasoline substitute. The percentage P� of
avoided CO2 using H as basis, instead
of H + H�, in the denominator of Eq. �6�, is given by the
following formula:
P� = 1 − �A + B + C − H��/H . �8�
By comparing Eq. �8� with Eq. �7�, it is clear that the
additive term E + F �emissions from fossil
fuel consumption in corn ethanol� is replaced in the numerator
by a subtractive term H� �emission
avoided by fossil fuel saving in electric power generation to the
grid by sugar cane bagasse
surplus�.
It is clear that, if H� � A + B + C in Eq. �8�, P� � 1. The
electric installed capacity using bagasse
in 2006 was 2.6 GW,30 85% �2.2 GW� of which were for self-
consumption and 15% �only 0.4
GW� were sold to the grid. In that same year, 8357 GW h were
produced from sugar cane bagasse,
from which 1256 GW h to the grid.30 In the hypothesis of
increasing the electric power generation
from bagasse by a factor of 4, as pointed above, the installed
capacity could become 10.4 GW and
10.4 − 2.2 = 8.2 GW could be sold to the grid, 20 times the
current value of 0.4 GW.
So, the electric energy from bagasse to the grid in 2006 could
grow by a factor of 20,
becoming 25 120 GW h. Assuming that natural gas will be
replaced, with a life cycle emission of
0.095 kg CO2/MJ �Ref. 28� and 40% of efficiency, the
avoided CO2 calculation gives 2.13
� 109 kg of CO2. Once for that year the production of ethanol
was 17.7 Mm
3, the avoided CO2
could be 1200 kg CO2 / m3 of ethanol. The bagasse computed
for electric generation in the es-
timate above did come from ethanol and sugar production
because this industry is integrated.
Considering that 55% of sugar cane is used for ethanol
production, H�
= 660 kg CO2 / m3 of ethanol. Using this figure in formula
�8�, as well as the average values in
Table IV, the result is P� = 1.10, that is, 110%. Therefore, as
well as balancing the full emissions
of sugar cane and ethanol production, for each ton of CO2
avoided through the use of ethanol as
a substitute for gasoline, more 100 kg of CO2 could be avoided
due to the use of bagasse surplus
for electric power.
In 2007, bagasse used for electric power was 8.1 Mton,17 and
the installed capacity was 2.8
GW. However, direct sale of electric energy from bagasse in
2007 was about 25% of the installed
capacity,34 that is, 0.7 GW. In 2008, a bid for electric power in
the grid added 2.2 GW of installed
capacity using bagasse, and operations should start in the
coming years.15 The power predicted by
the bid, added to that realized in 2007, totals 2.9 GW, 35% of
the potential of 8.2 GW, calculated
with the above assumptions and without major technological
changes.
TABLE VI. Energy from 1 Mton of sugar cane considering heat
values. Source: Ref. 24.
Mcal/ton of cane
92 l of ethanol �best value� 478
280 kg of bagasse with 50% of humidity 596
280 kg of trash with 50% of humidity 596
033111-14 Rosa et al. J. Renewable Sustainable Energy 1,
033111 �2009�
2. Scenario for energy per ton of sugar cane and avoided GHG
by mechanization
Focusing only on ethanol production and referring to Table V
and to Ref. 21, bagasse con-
sumption for heat and mechanical work in ethanol production
amounts to 42 � 2130 / �426
� 0.55� = 382 Mcal / ton of sugar cane. Subtracting this value
from 596 Mcal �Table V�, 214 Mcal
of bagasse per ton of sugar cane in ethanol production can be
used for electric energy. By the same
token, 68.2 Mcal of bagasse per ton of sugar cane were used for
electric power generation in 2006.
Considering the use of 1 l of ethanol �average of hydrated and
anhydrous� instead of 0.79 l of
gasoline, with heat value of 10 400 kcal/kg and density of 0.74
kg/l, the correspondent energy is
0.79 � 0.74 � 10 400 = 6080 kcal per liter of ethanol or 75.7 �
6080 = 460 000 kcal / ton of sugar
cane. In the case of 92 l/ton of sugar cane, the equivalent
energy will be 559 Mcal /ton of sugar
cane.
However, trash recovering is limited because trash is also used
to protect and fertilize the soil
and because mechanization to avoid cane burning cannot be
used in more than 50% of the area
with the available technology due to declivity. On the other
hand, the burning of bagasse and trash
could be done with improved thermodynamic efficiency. Based
on such considerations, we were
able to build a future scenario, presented in Table VII, as
compared to 2006.
The scenario of Table VII does not take into account potential
improvements of efficiency in
energy transformation that could increase bagasse surplus, for
instance, by changing low-
efficiency steam systems for electric power. In many cases, low
pressure steam is used.
It is reasonable to get more mechanical and electric energy per
ton of sugar cane with higher
efficiency by decreasing bagasse self-consumption. As a rule,
22 bars of steam pressure are used,
which can be increased to 60 or 80 bars, improving efficiency
by a factor of 2. The self-
consumption of bagasse in ethanol production in some cases is
90% for heat in distillation of
ethanol, 5% for mechanical work, and 5% for electric power. If
efficiency is improved in the
conversion of heat in mechanical and electric energy, the
surplus of bagasse will be higher and
there will be more electric power to the grid per ton of bagasse.
Therefore, H� could be higher
again.
The mechanization of harvesting, used in such a way to avoid
the burning of sugar cane will
allow not only a higher value for H� due to the use of trash in
electric power generation but also
a lower value of emission C in Eq. �6� or Eq. �8�. However,
because of the slopes on part of the
lands used for sugar cane plantations, it is impossible to reach
100% of mechanization. If mecha-
nization is increased by 50% in relation to the case study
presented in Table III, there could be a
reduction of 0.5 � 37.3% = 18.6% in CO2 equivalent emission
of CH4 and N2O from the burning of
sugar cane.
On the other hand, the use of 50% more harvesting equipment
will increase emissions from
diesel oil in the same proportion. Assuming that half of fossil
fuel consumption in Table III is
diesel oil, the correspondent emission that represents 0.5 �
.19.1% = 9.5% will increase by 0.5
� 9.5 = 4.75%. The net result should be an emission reduction
of 18.6 − 4.75 = 13.85%. Diesel oil
TABLE VII. Energy from 1 Mton of sugar cane.
Mcal per ton of cane
Brazil 2006 Future scenario Variation
Ethanol �energy of gasoline replaced� 460a 559b 21%
Bagasse for electric energy �partly to grid� 68 214c 314%
Trash for electric energy �entirely to grid� 298d Infinite
Total 528 1071 102%
aConsidering 75.7 l of ethanol per ton of sugar cane �Brazilian
average in 2006�.
bWith the best value of 92 l of ethanol per ton of sugar cane.
cSelf-consumption of 377 Mcal /ton of sugar cane subtracted.
d50% of total mass.
033111-15 Ethanol, climate change, land use... J. Renewable
Sustainable Energy 1, 033111 �2009�
can be eliminated by fueling diesel engines with either biodiesel
or ethanol with additive. The
variation of indirect energy in life cycle of harvesting
equipment �variable A in Table III� is not
considered in this approximation.
The problem of increasing the mechanization of harvesting is
the resulting reduction in work-
ers in sugar cane plantations. In 2005, there were 414 000
workers in sugar cane agriculture,
439 000 in sugar production, and 128 000 in the ethanol
industry.35 However, manual harvesting
of sugar cane is a very hard job that may cause diseases by
physical stress. Besides, the burning
of sugar cane causes air pollution, which, in turn, is a factor for
respiratory conditions for the local
population.
VI. DISCUSSION ABOUT LAND USE, ETHANOL
COMPETITION WITH FOOD, AND
DEFORESTATION
A. Land uses and deforestation
The issue of food crop displacement due to biofuel competition
was raised recently by Far-
gione et al.4 The paper shows that land use for biofuel increases
GHG in atmosphere due to
emissions from land use change in the US. The authors used a
model for estimating the planted
area due to biofuel production.
This problem is not new in Brazil. The displacement of food
crops by sugar cane in São Paulo
was pointed out a long time ago by Homem de Mello.36,37 In
fact, there is indeed displacement of
food crops, but its dimensions are very different in the case of
sugar cane in Brazil and in corn in
the US �Table VIII�. The US share in world corn production is
higher than the share of Brazil in
global sugar cane production, while the area used for corn
production in the US is five times the
area for sugar cane production in Brazil.
The area used for sugar cane production in Brazil is 7 � 106
ha—about 45% for sugar and
55% for ethanol—which means that about 4 � 106 ha are used
to produce ethanol. For comparison
purposes, soy bean uses 21 � 106 ha and cattle pastures occupy
177 � 106 ha. According to data
from the Brazilian Institute of Geography and Statistics,16 the
country has 152 Mha useful for
agricultural purposes. Therefore, sugar cane for ethanol
production uses only 2.6% of the area
useful for agriculture, without taking into account the recovery
of pasture lands that are being
degraded.
According to this same source, only 62 Mha are used for food
crops, biofuels, and other crops.
Therefore, there are 90 Mha available for the expansion of
agriculture without deforestation.
The Brazilian area of native vegetation is 440 Mha; most of it is
located in the Amazonian rain
forest, in the north region of the country. The production of
sugar cane is concentrated in the
southeast, mainly in São Paulo, followed by the middle west
region, with some contributions from
the south and northeast regions, but only 0.3% from the north
region, where the Amazon is located
�see Table IX�. The present impact of sugar cane for ethanol
on deforestation is low, as compared
to soybean for the external and internal markets, which includes
biodiesel production.
Two points should be noted about biofuels and deforestation:
TABLE VIII. Corn in the US � Sugar cane in Brazil. Source:
Refs. 16, 32, and 38.
US corn Brazil sugar cane
Percentage of world production �%� 54 33
Area occupied �Mha� 35 7
TABLE IX. Ethanol production in Brazil per region. Source:
Ref. 39.
Southeast: 72% Northeast: 7%
Middle West: 13% North: 0.3%
South:�7.7%
033111-16 Rosa et al. J. Renewable Sustainable Energy 1,
033111 �2009�
�a� The presence of sugar cane in the middle west region
�13%� impacts the savanna in the
Brazilian Cerrado, although this kind of vegetation is less dense
than rain forest.
�b� The situation of soybean, mainly for exportation but used
also for biodiesel, is different
because its presence in the north region is high, although
biodiesel production in Brazil is
relatively small in comparison with ethanol production.
One of the goals of the Biodiesel Program was the use of castor
oil, palm oil, sunflower, and
other raw materials produced by small farmers. However, the
present situation is the dominance of
large soybean plantations supplying vegetable oil for biodiesel.
The drivers of deforestation are 4, mainly in the rain forest:
�a� wood extraction,
�b� cattle pasture,
�c� soybean plantations, and
�d� mineral resources exploration.
There are different ways of calculating deforested areas
depending on whether or not reforested
areas are considered because they were deforested areas at some
point. In some studies, the
deforested areas considered are only the ones that really
changed land use definitely, as in the case
of agriculture or pasture. In other studies, the accidental
burning of biomass is considered defor-
estation. Another issue that can result in different figures is the
vegetal classification used in the
calculation of carbon emissions, as biomass density can be quite
different.
B. Potential sugar cane expansion and the external market
The next issue concerning possible impacts of the potential
expansion of sugar cane produc-
tion is related to ethanol exports as a substitute for gasoline in
OECD countries. The European car
fleet features a growing proportion of diesel engines, although
there is a non-negligible consump-
tion of gasoline either with or without ethanol as additive. Part
of the car fleet of Sweden uses a
blend of 80% ethanol and 20% gasoline �E80�.
Table X shows the countries with more significant ethanol
production as well as the countries
to which Brazil exports. Only the US and Brazil use ethanol as
gasoline substitute in a large scale.
In 2006, the US ranked first place in ethanol production,
followed by Brazil. However, the
percentage of ethanol blended to gasoline is very low in the US
because gasoline consumption is
very high, which makes the US the largest importer of ethanol
from Brazil. Therefore, the most
important potential market for Brazilian ethanol is the American
market, where Otto cycle engines
are predominant in the car fleet. There are other potential
importers, such as Japan, where Petro-
bras created a joint venture with Mitsubishi to export ethanol.
China also uses corn to produce
ethanol for cars. In 2006, there were 310 ethanol distilleries in
Brazil, and 77 new plants were
planned, with investments of over US$14 billions.32 Foreign
investors are being attracted to
ethanol agrobusiness in Brazil.
TABLE X. Ethanol in 2006. Source: Ref. 40.
Production Volume of Brazilian exports
USA 18 378 � 106 l EUA 1749 � 106 l
Brazil 17 000 Netherlands 344
China 3 850 Japan 228
India 1 900 Sweden 201
France 950 El Salvador 183
Germany 765 Jamaica 133
Russia 647 Venezuela 103
Canada 579
Spain 462
South Africa 386 Total 3 417 � 106 l
033111-17 Ethanol, climate change, land use... J. Renewable
Sustainable Energy 1, 033111 �2009�
Presently, the North American market is not open to Brazilian
ethanol. However, in spite of
the weak result of international trade negotiations at
multilateral level to open it, there are some
reasons to believe that the present situation in the US will
change, including
�a� the inefficacy of corn ethanol to mitigate global warming
�see Sec. V above�,
�b� the higher competition of corn ethanol with food
agriculture �see this section�,
�c� the lower productivity per hectare and higher cost of corn
ethanol �see Table XI�, and
�d� the prediction of increasing the percentage of ethanol to
20% of car fuel �see scenario
below�.
Based on that, it is reasonable to develop a scenario for future
ethanol demand to be supplied
through international trade. The gasoline consumption in the US
is about 10 � 106 barrels / day.
Considering the hypothesis in �d�, with 20% of ethanol and
1.3 l of ethanol for 1 l of gasoline, the
future demand will reach 140 � 109 l of ethanol/year, seven
times the current Brazilian ethanol
production.
The necessary land area, with the same technology and average
productivity, should be mul-
tiplied by 7, resulting in 28 Mha for sugar cane, 30.4% of the
land available for the expansion of
agriculture in Brazil. This percentage is not small if we consider
the need of land for food
production and other crops, including biofuels, for the internal
market and for export to other
countries besides the US. If this demand is doubled, in order to
supply European countries and
Japan, the area needed for sugar cane would reach 56 Mha,
which is too large indeed. Besides,
there are the problems of a very large monoculture. Second
generation technology for ethanol
production must change the present prospects.
VII. FINAL COMMENTS
The conclusion is that there is no major obstacle, from the land
use point of view, to expand
ethanol production for the internal market. However, Brazil
should not supply the entire potential
market for ethanol in the world if ethanol use becomes a way
for global warming mitigation in a
large scale.
A more realistic projection indicates a production of about 36 �
109 l of ethanol in 2012, from
which 7 � 109 l are to be exported.32 Another scenario predicts
60 � 109 l of ethanol in 2020 with
12 � 109 l for export.42 Brazil can supply such quantities as
long as the areas needed are compat-
ible with the available lands for agriculture.
As was previously pointed out, CO2 is dominant among GHG
emissions and the automotive
fleet contributes with 20% of world CO2 emission. The
automotive fleet amounted to 890 � 10
6
light vehicles in 2005 and consumes half of the petroleum
products in the world.43 Besides, the
fleet increases by 20% per year in China and 3.5% in Brazil,
where 5.5 � 106 ethanol powered by
vehicles were produced since 1979, and 4 � 106 flex-fuel
vehicles produced since 2003 are run-
ning either on gasoline or on ethanol. Besides, ethanol is added
to gasoline in the proportion of
25%. Therefore, cars use from 25% to 100% of ethanol in
Brazil. CO2 emission avoided is
substantial.
However, ethanol itself is not enough to mitigate CO2 emissions
at world level. It is also
necessary, deep changes, in energy technology, transport
�including public transport�, and con-
sumption patterns that are still dependent on diesel engines. But
ethanol can become an important
fuel for different technologies, besides the Otto cycle engines in
cars. Combined to additives,
TABLE XI. A comparison of sugar cane ethanol with corn
ethanol. Source: Refs. 21 and 41.
Productivity
�l/ha� Costs
Sugar cane ethanol 4000–7000 0.19 US$/l �São Paulo�
0.23 US$/l �Northeast Brazil�
Corn ethanol 3500–4700 0.33 US$/l
033111-18 Rosa et al. J. Renewable Sustainable Energy 1,
033111 �2009�
ethanol could power diesel engines used in buses, trucks, and
railway locomotives. It can be used
as fuel for hybrid vehicles of electrical propulsion—in which
the Otto or diesel engine is coupled
to an electric power generator that supplies current for an
electrical motor and for accumulating
energy in batteries—or in fuel cell vehicles to replace
combustion engine to supply current for an
electrical motor.
Sugar cane is the best way to produce bioethanol from both the
economical and the environ-
mental point of view, including GHG mitigation through the use
of ethanol as a gasoline substi-
tute. However, ethanol industry in Brazil must be improved,
including the adoption of technologi-
cal changes, some of them concerning efficiency in energy
transformation and natural resources
use. The main changes must be made at the first level:
�a� Improving efficiency in the transformation of chemical
energy of sugar cane bagasse in heat
for distillation and in mechanical and electric energy for self-
consumption and to sell energy
to the grid; today, the share of bagasse in electric generation in
Brazil is too small and must
be increased.
�b� Using the sugar cane trash, which is burned before
harvesting to facilitate the manual job of
workers; the amount of energy that could be obtained for
electric generation is significant.
�c� Item �b� implies the increase in harvesting
mechanization in sugar cane agriculture, decreas-
ing the number of workers, but work conditions in manual
harvesting are harsh.
�d� Improving conditions of workers in sugar cane plantations
in some cases, including both the
social and the environmental dimension in clean energy
production �EP�.
�e� Improving technology both in agriculture and in the
industry.
At the second level:
�a� gasification of sugar cane bagasse and trash,
�b� second generation ethanol production through hydrolysis,
and
�c� biorefineries with multiple by-products or integrated oil
and biorefineries in a more advanced
concept.
Gasification could either allow high-efficiency conversion into
electric energy through com-
bined cycle or could be used to produce liquid fuel from gas.
Second generation ethanol is
hydrolysis acidic or enzymatic, followed by fermentation, that
leads to the conversion of biomass
fiber �lignin and cellulose� into ethanol.
The commercial use of hydrolysis can reduce sugar cane
comparative advantage as compared
to other kinds of vegetable used to produce ethanol. On the
other hand, the entire mass of sugar
cane could be used to obtain ethanol, including the hydrolysis
of bagasse and trash, as well as
allows the fermentation of pentose to produce ethanol.
Macedo32 predicted a time horizon between
2010 and 2020 for second generation ethanol to become
commercial, while for gasification this
time is a little bit longer, 2015–2025, in spite of the already
existing technological uses of wood
gasification. In the case of hydrolysis, there are prototypes, and
some recent small scale industrial
plants are being built around the world for ethanol production,
although not yet commercial.
Biorefineries can produce ethanol together with other chemical
by-products. For instance,
biodiesel production needs ethanol or methanol and uses
glycerol as a by-product that can be used
to produce gasoline. Since the beginning, ethanol production in
Brazil was integrated to sugar
production in the so-called annex distilleries. A more advanced
concept is the integration of
biorefineries with oil refineries, as, for instance, does the H-bio
technology developed by Petrobras
�Table II� parallel to biodiesel from vegetable oil. Although
this is out of the scope of this paper,
biodiesel production must be improved in many aspects that are
not dealt with here.
Finally, biofuels for private cars must not drop the issue of
technical and social efficiencies in
transportation nor the encouragement to improve public
transportation. A Climate Change policy
must find realistic solutions for sustainable development with
social justice. The elimination of
poverty requires more power per capita in developing countries;
however, at the same time,
033111-19 Ethanol, climate change, land use... J. Renewable
Sustainable Energy 1, 033111 �2009�
intensive energy use is necessary and the consumption patterns
of the high income and middle
classes must be changed. It is not possible to deeply mitigate
global warming without making
changes in business as usual EC.
LIST OF ABBREVIATIONS AND ACRONYMS
CDM Clean Development Mechanism
CO2 Carbon dioxide
CO2 equivalent Carbon dioxide equivalent
COPPE Instituto Alberto Luiz Coimbra de Pós-Graduação e
Pesquisa de Engenharia
of Federal University of Rio de Janeiro
E25 Ethanol 25%
GHG greenhouse gas
GJ Gigajoules �109�
GW Gigawatts �109�
GW h Gigawatts hour �109�
GWP Global warming potential
IPCC International Panel on Climate Change
kcal kilocalories �103�
kg kilogram
m3 cubic meters
Mcal Megacalories �106�
Mha Megahectare �106�
MJ Megajoules �106�
Mm3 Mega-cubic-meters �106�
Mton Megatons �106�
Mtoe Megatons of oil equivalent
OECD Organisation for Economic Co-operation and
Development
1 M. S. P. Gomes and M. S. Muylaert de Araújo, “Bio-fuels
production and the environmental indicators,” Renewable
Sustainable Energy Rev. �in press�.
2 M. S. Muylaert de Araujo, C. Silva, and C. P. Campos,
Renewable Sustainable Energy Rev. 13, 696 �2009�.
3 I. C. Macedo, J. E. Seabra, and J. E. A. R. Silva, Biomass
Bioenergy 32, 582 �2008�.
4 J. Fargione, J. Hill, D. Tilman, S. Polasky, and P. Hawthorne,
Science 319, 1235 �2008�.
5 P. J. Crutzen, A. R. Mosier, K. A. Smith, and W. Winiwarter,
Atmos. Chem. Phys. 8, 389 �2008�.
6 IFP Innovation, Energy, Environment �IFP� Report, 2005.
7 C. Campbell, The Coming Oil Crisis �Oxford, New York,
2001�.
8 L. P. Rosa and S. K. Ribeiro, Clim. Change 48, 289 �2001�.
9 L. P. Rosa, S. K. Ribeiro, M. S. Muylaert, and C. P. Campos,
Energy Policy 32, 1499 �2004�.
10 L. P. Rosa, C. P. de Campos, and M. S. Muylaert, Sci. Total
Environ. 346, 149 �2005�.
11 M. S. Muylaert de Araujo, L. P. Rosa, and C. P. de Campos,
Renewable Sustainable Energy Rev. 11, 988 �2007�.
12 “Fourth assessment report,” Intergovernmental Panel on
Climate Change �IPPC�, 2007.
13 “Key global indicators,” United Nations Statistics Division
report �available at http://data.un.org/Data.aspx?d�CDB&f
�srID%3a29918, updated 22 May 2008�.
14 M. S. Muylaert, C. Cohen, L. P. Rosa, and A. S. Pereira,
Clim. Res. 28, 89 �2004�.
15 Energy Planning Enterprise �EPE�, Brazilian Ministry of
Energy report 2008.
16 “National statistics,” Brazilian Institute of Geography and
Statistics �IBGE� report, 2007.
17 Balanço Energético Nacional �BEN�, EPE, Brazilian
Ministry of Energy preliminary results, 2008.
18 L. P. Rosa, M. A. Santos, B. Matvienko, E. O. Santos, and E.
Sikar, Clim. Change 66, 9 �2004�.
19 L. P. Rosa and S. K. Ribeiro, Energy Policy 26, 103
�1998�.
20 L. P. Rosa and S. K. Ribeiro, AMBIO 27, 465 �1998�.
21 M. A. F. Dias de Moraes, “Reflections on Brazil’s ethanol
industry,” MRE report, 2007, p. 158.
22 H. Joseph, Jr., “Flexible fuel engine techonology,” MRE
report, 2007.
23 J. Goldemberg et al., Biomass and Bioenergy �Elsevier,
New York, 2004�, Vol. 26.
24 O. A. Braunbeck, I. Macedo, and L. A. B. Cortez, Increasing
the available biomass from sugarcane for energy conversion
in International Workshop Implementation Strategies for
Biomass Utilization in Europe and Developing Countries, 2001,
Stadshotellet, Sweden, Vol. 1, pp. 1-20.
25 D. A. Lashof and D. R. Ahuja, Nature �London� 344, 527
�1990�.
26 I. C. Macedo, M. R. L. V. Leal, and J. E. A. Ramos da Silva,
“Balanço das emissões de gases do efeito estufa na
produção e no uso do etanol no Brasil,” Secretary of
Environment of the State of São Paulo report, 2004.
27 “Guidelines for national GHG inventories,
“Intergovernmental Panel on Climate Change �IPPC�, 2006.
28 “Well to wheels, analysis of future automotive fuels and
powertrains in the European context,” EUCAR report, 2006.
033111-20 Rosa et al. J. Renewable Sustainable Energy 1,
033111 �2009�
http://dx.doi.org/10.1016/j.rser.2007.10.008
http://dx.doi.org/10.1016/j.biombioe.2007.12.006
http://dx.doi.org/10.1126/science.1152747
http://dx.doi.org/10.1023/A:1010720931557
http://dx.doi.org/10.1016/S0301-4215(03)00121-6
http://dx.doi.org/10.1016/j.scitotenv.2004.12.053
http://dx.doi.org/10.1016/j.rser.2005.07.001
http://data.un.org/Data.aspx?d=CDB&f=srID%3a29918
http://dx.doi.org/10.3354/cr028089
http://dx.doi.org/10.1023/B:CLIM.0000043158.52222.ee
http://dx.doi.org/10.1016/S0301-4215(97)00081-5
http://dx.doi.org/10.1038/344529a0
29 “Second assessment report,” Intergovernmental Panel on
Climate Change, 1995.
30 Balanço Energético Nacional �BEN�, EPE, Brazilian
Ministry of Energy, 2007.
31 P. Nastari, 2005, quoted by M. A. F. Dias de Moraes, 2007.
32 I. C. Macedo, “Ethanol: Current situation and outlook,” MRE
report, 2007.
33 “Union of sugar and ethanol industry,” UNICA report, 2008.
34 R. Queiroz �private communication�.
35 Brazilian Ministry of Work and Employment �MTE� report,
2007.
36 F. B. Homem de Mello, Revista de Economia Rural �São
Paulo, 1980�, Vol. 18, p. 115.
37 F. B. Homem de Melo, Revista de Economia Rural �São
Paulo, 1981�, Vol. 11, p. 83.
38 United States Department of Agriculture �USDA� report,
2008.
39 I. Sauer, “Biofuels in Brazil,” MRE report, 2007.
40 “World energy statistics,” International Energy Agency
�IEA� report, 2007.
41 J. Hill, E. Nelson, and D. Tilman, Proc. Natl. Acad. Sci.
U.S.A. 103, 11206 �2006�.
42 R. A. M. Costa Reis, Opiniões, Açúcar e Álcool �WDS, São
Paulo, 2008�, p. 24.
43 A. Szwarc, “Ethanol and the control of GHG,” MRE report
2007.
033111-21 Ethanol, climate change, land use... J. Renewable
Sustainable Energy 1, 033111 �2009�
http://dx.doi.org/10.1073/pnas.0604600103
Biofuel contribution to mitigate fossil fuel CO2 emissionsC.docx

More Related Content

Similar to Biofuel contribution to mitigate fossil fuel CO2 emissionsC.docx

ESI 6(3) Special issue on biofuels
ESI 6(3) Special issue on biofuelsESI 6(3) Special issue on biofuels
ESI 6(3) Special issue on biofuelsMayank Dwivedi
 
The Future Biomass and Bioenergy Brazil -
The Future Biomass and Bioenergy Brazil -The Future Biomass and Bioenergy Brazil -
The Future Biomass and Bioenergy Brazil -Celso Oliveira
 
Responsibility For Carbon Emission Reduction
Responsibility For Carbon Emission ReductionResponsibility For Carbon Emission Reduction
Responsibility For Carbon Emission ReductionMichelle Madero
 
BioEnergy News 2008 - Ireland
BioEnergy News 2008 - IrelandBioEnergy News 2008 - Ireland
BioEnergy News 2008 - IrelandZX7
 
Nnfcc market review feedstocks issue nineteen october 2013
Nnfcc market review feedstocks issue nineteen october 2013Nnfcc market review feedstocks issue nineteen october 2013
Nnfcc market review feedstocks issue nineteen october 2013NNFCC
 
Ipcc initiative in climate change mitigation
Ipcc initiative in climate change mitigationIpcc initiative in climate change mitigation
Ipcc initiative in climate change mitigationParvati Tamrakar
 
example is in the attachment. i just need a summary paragraph for 5 .docx
example is in the attachment. i just need a summary paragraph for 5 .docxexample is in the attachment. i just need a summary paragraph for 5 .docx
example is in the attachment. i just need a summary paragraph for 5 .docxmealsdeidre
 
Green Futures: Sharing the Wealth and Saving the Planet - Presentation for Pe...
Green Futures: Sharing the Wealth and Saving the Planet - Presentation for Pe...Green Futures: Sharing the Wealth and Saving the Planet - Presentation for Pe...
Green Futures: Sharing the Wealth and Saving the Planet - Presentation for Pe...Global Thermostat
 
@Nd half
@Nd half@Nd half
@Nd halfsetren
 
Climate change - a global problem
Climate change - a global problemClimate change - a global problem
Climate change - a global problemGareth Duggan
 
Climate Change (By Anumita)
Climate Change (By Anumita)Climate Change (By Anumita)
Climate Change (By Anumita)bmbks321
 
ENGINE TECHNOLOGY AND RESEARCH TRENDS OF ADVANCED BIOFUEL AS ALTERNATIVE FUEL...
ENGINE TECHNOLOGY AND RESEARCH TRENDS OF ADVANCED BIOFUEL AS ALTERNATIVE FUEL...ENGINE TECHNOLOGY AND RESEARCH TRENDS OF ADVANCED BIOFUEL AS ALTERNATIVE FUEL...
ENGINE TECHNOLOGY AND RESEARCH TRENDS OF ADVANCED BIOFUEL AS ALTERNATIVE FUEL...IAEME Publication
 
BC3 Policy Briefings: [2015-03] Under what conditions is the bioethanol and b...
BC3 Policy Briefings: [2015-03] Under what conditions is the bioethanol and b...BC3 Policy Briefings: [2015-03] Under what conditions is the bioethanol and b...
BC3 Policy Briefings: [2015-03] Under what conditions is the bioethanol and b...BC3 - Basque Center for Climate Change
 
Unveiling the driving forces affecting carbon dioxide emissions in the Philip...
Unveiling the driving forces affecting carbon dioxide emissions in the Philip...Unveiling the driving forces affecting carbon dioxide emissions in the Philip...
Unveiling the driving forces affecting carbon dioxide emissions in the Philip...Open Access Research Paper
 
Fuelling the energy debate
Fuelling the energy debateFuelling the energy debate
Fuelling the energy debateDiana Kool
 

Similar to Biofuel contribution to mitigate fossil fuel CO2 emissionsC.docx (20)

ESI 6(3) Special issue on biofuels
ESI 6(3) Special issue on biofuelsESI 6(3) Special issue on biofuels
ESI 6(3) Special issue on biofuels
 
Energy Efficiency
Energy EfficiencyEnergy Efficiency
Energy Efficiency
 
The Future Biomass and Bioenergy Brazil -
The Future Biomass and Bioenergy Brazil -The Future Biomass and Bioenergy Brazil -
The Future Biomass and Bioenergy Brazil -
 
Project
ProjectProject
Project
 
Responsibility For Carbon Emission Reduction
Responsibility For Carbon Emission ReductionResponsibility For Carbon Emission Reduction
Responsibility For Carbon Emission Reduction
 
Global Warming
Global WarmingGlobal Warming
Global Warming
 
BioEnergy News 2008 - Ireland
BioEnergy News 2008 - IrelandBioEnergy News 2008 - Ireland
BioEnergy News 2008 - Ireland
 
Climate Change Essay Topics
Climate Change Essay TopicsClimate Change Essay Topics
Climate Change Essay Topics
 
Nnfcc market review feedstocks issue nineteen october 2013
Nnfcc market review feedstocks issue nineteen october 2013Nnfcc market review feedstocks issue nineteen october 2013
Nnfcc market review feedstocks issue nineteen october 2013
 
Ipcc initiative in climate change mitigation
Ipcc initiative in climate change mitigationIpcc initiative in climate change mitigation
Ipcc initiative in climate change mitigation
 
example is in the attachment. i just need a summary paragraph for 5 .docx
example is in the attachment. i just need a summary paragraph for 5 .docxexample is in the attachment. i just need a summary paragraph for 5 .docx
example is in the attachment. i just need a summary paragraph for 5 .docx
 
Green Futures: Sharing the Wealth and Saving the Planet - Presentation for Pe...
Green Futures: Sharing the Wealth and Saving the Planet - Presentation for Pe...Green Futures: Sharing the Wealth and Saving the Planet - Presentation for Pe...
Green Futures: Sharing the Wealth and Saving the Planet - Presentation for Pe...
 
@Nd half
@Nd half@Nd half
@Nd half
 
Climate change - a global problem
Climate change - a global problemClimate change - a global problem
Climate change - a global problem
 
Climate Change (By Anumita)
Climate Change (By Anumita)Climate Change (By Anumita)
Climate Change (By Anumita)
 
ENGINE TECHNOLOGY AND RESEARCH TRENDS OF ADVANCED BIOFUEL AS ALTERNATIVE FUEL...
ENGINE TECHNOLOGY AND RESEARCH TRENDS OF ADVANCED BIOFUEL AS ALTERNATIVE FUEL...ENGINE TECHNOLOGY AND RESEARCH TRENDS OF ADVANCED BIOFUEL AS ALTERNATIVE FUEL...
ENGINE TECHNOLOGY AND RESEARCH TRENDS OF ADVANCED BIOFUEL AS ALTERNATIVE FUEL...
 
BC3 Policy Briefings: [2015-03] Under what conditions is the bioethanol and b...
BC3 Policy Briefings: [2015-03] Under what conditions is the bioethanol and b...BC3 Policy Briefings: [2015-03] Under what conditions is the bioethanol and b...
BC3 Policy Briefings: [2015-03] Under what conditions is the bioethanol and b...
 
Unveiling the driving forces affecting carbon dioxide emissions in the Philip...
Unveiling the driving forces affecting carbon dioxide emissions in the Philip...Unveiling the driving forces affecting carbon dioxide emissions in the Philip...
Unveiling the driving forces affecting carbon dioxide emissions in the Philip...
 
Cooking
CookingCooking
Cooking
 
Fuelling the energy debate
Fuelling the energy debateFuelling the energy debate
Fuelling the energy debate
 

More from hartrobert670

BUS M02C – Managerial Accounting SLO Assessment project .docx
BUS M02C – Managerial Accounting SLO Assessment project .docxBUS M02C – Managerial Accounting SLO Assessment project .docx
BUS M02C – Managerial Accounting SLO Assessment project .docxhartrobert670
 
BUS 409 – Student Notes(Prerequisite BUS 310)COURSE DESCR.docx
BUS 409 – Student Notes(Prerequisite BUS 310)COURSE DESCR.docxBUS 409 – Student Notes(Prerequisite BUS 310)COURSE DESCR.docx
BUS 409 – Student Notes(Prerequisite BUS 310)COURSE DESCR.docxhartrobert670
 
BUS LAW2HRM Management Discussion boardDis.docx
BUS LAW2HRM Management Discussion boardDis.docxBUS LAW2HRM Management Discussion boardDis.docx
BUS LAW2HRM Management Discussion boardDis.docxhartrobert670
 
BUS 571 Compensation and BenefitsCompensation Strategy Project.docx
BUS 571 Compensation and BenefitsCompensation Strategy Project.docxBUS 571 Compensation and BenefitsCompensation Strategy Project.docx
BUS 571 Compensation and BenefitsCompensation Strategy Project.docxhartrobert670
 
BUS 475 – Business and Society© 2014 Strayer University. All Rig.docx
BUS 475 – Business and Society© 2014 Strayer University. All Rig.docxBUS 475 – Business and Society© 2014 Strayer University. All Rig.docx
BUS 475 – Business and Society© 2014 Strayer University. All Rig.docxhartrobert670
 
BUS 210 Exam Instructions.Please read the exam carefully and a.docx
BUS 210 Exam Instructions.Please read the exam carefully and a.docxBUS 210 Exam Instructions.Please read the exam carefully and a.docx
BUS 210 Exam Instructions.Please read the exam carefully and a.docxhartrobert670
 
BUS 137S Special Topics in Marketing (Services Marketing)Miwa Y..docx
BUS 137S Special Topics in Marketing (Services Marketing)Miwa Y..docxBUS 137S Special Topics in Marketing (Services Marketing)Miwa Y..docx
BUS 137S Special Topics in Marketing (Services Marketing)Miwa Y..docxhartrobert670
 
BUS 313 – Student NotesCOURSE DESCRIPTIONThis course intro.docx
BUS 313 – Student NotesCOURSE DESCRIPTIONThis course intro.docxBUS 313 – Student NotesCOURSE DESCRIPTIONThis course intro.docx
BUS 313 – Student NotesCOURSE DESCRIPTIONThis course intro.docxhartrobert670
 
BUS 1 Mini Exam – Chapters 05 – 10 40 Points S.docx
BUS 1 Mini Exam – Chapters 05 – 10 40 Points S.docxBUS 1 Mini Exam – Chapters 05 – 10 40 Points S.docx
BUS 1 Mini Exam – Chapters 05 – 10 40 Points S.docxhartrobert670
 
BullyingIntroductionBullying is defined as any for.docx
BullyingIntroductionBullying is defined as any for.docxBullyingIntroductionBullying is defined as any for.docx
BullyingIntroductionBullying is defined as any for.docxhartrobert670
 
BUS1001 - Integrated Business PerspectivesCourse SyllabusSch.docx
BUS1001 - Integrated Business PerspectivesCourse SyllabusSch.docxBUS1001 - Integrated Business PerspectivesCourse SyllabusSch.docx
BUS1001 - Integrated Business PerspectivesCourse SyllabusSch.docxhartrobert670
 
BUMP implementation in Java.docxThe project is to implemen.docx
BUMP implementation in Java.docxThe project is to implemen.docxBUMP implementation in Java.docxThe project is to implemen.docx
BUMP implementation in Java.docxThe project is to implemen.docxhartrobert670
 
BUS 303 Graduate School and Further Education PlanningRead and w.docx
BUS 303 Graduate School and Further Education PlanningRead and w.docxBUS 303 Graduate School and Further Education PlanningRead and w.docx
BUS 303 Graduate School and Further Education PlanningRead and w.docxhartrobert670
 
Bulletin Board Submission 10 Points. Due by Monday at 900 a.m..docx
Bulletin Board Submission 10 Points. Due by Monday at 900 a.m..docxBulletin Board Submission 10 Points. Due by Monday at 900 a.m..docx
Bulletin Board Submission 10 Points. Due by Monday at 900 a.m..docxhartrobert670
 
BUS 371Fall 2014Final Exam – Essay65 pointsDue Monda.docx
BUS 371Fall 2014Final Exam – Essay65 pointsDue  Monda.docxBUS 371Fall 2014Final Exam – Essay65 pointsDue  Monda.docx
BUS 371Fall 2014Final Exam – Essay65 pointsDue Monda.docxhartrobert670
 
Burn with Us Sacrificing Childhood in The Hunger GamesSus.docx
Burn with Us Sacrificing Childhood in The Hunger GamesSus.docxBurn with Us Sacrificing Childhood in The Hunger GamesSus.docx
Burn with Us Sacrificing Childhood in The Hunger GamesSus.docxhartrobert670
 
BUS 305 SOLUTIONS TOPRACTICE PROBLEMS EXAM 21) B2) B3.docx
BUS 305 SOLUTIONS TOPRACTICE PROBLEMS EXAM 21) B2) B3.docxBUS 305 SOLUTIONS TOPRACTICE PROBLEMS EXAM 21) B2) B3.docx
BUS 305 SOLUTIONS TOPRACTICE PROBLEMS EXAM 21) B2) B3.docxhartrobert670
 
Burgerville- Motivation Goals.Peer-reviewed articles.Here ar.docx
Burgerville- Motivation Goals.Peer-reviewed articles.Here ar.docxBurgerville- Motivation Goals.Peer-reviewed articles.Here ar.docx
Burgerville- Motivation Goals.Peer-reviewed articles.Here ar.docxhartrobert670
 
Bullying Bullying in Schools PaperName.docx
Bullying     Bullying in Schools PaperName.docxBullying     Bullying in Schools PaperName.docx
Bullying Bullying in Schools PaperName.docxhartrobert670
 
Building Design and Construction FIRE 1102 – Principle.docx
Building Design and Construction FIRE 1102 – Principle.docxBuilding Design and Construction FIRE 1102 – Principle.docx
Building Design and Construction FIRE 1102 – Principle.docxhartrobert670
 

More from hartrobert670 (20)

BUS M02C – Managerial Accounting SLO Assessment project .docx
BUS M02C – Managerial Accounting SLO Assessment project .docxBUS M02C – Managerial Accounting SLO Assessment project .docx
BUS M02C – Managerial Accounting SLO Assessment project .docx
 
BUS 409 – Student Notes(Prerequisite BUS 310)COURSE DESCR.docx
BUS 409 – Student Notes(Prerequisite BUS 310)COURSE DESCR.docxBUS 409 – Student Notes(Prerequisite BUS 310)COURSE DESCR.docx
BUS 409 – Student Notes(Prerequisite BUS 310)COURSE DESCR.docx
 
BUS LAW2HRM Management Discussion boardDis.docx
BUS LAW2HRM Management Discussion boardDis.docxBUS LAW2HRM Management Discussion boardDis.docx
BUS LAW2HRM Management Discussion boardDis.docx
 
BUS 571 Compensation and BenefitsCompensation Strategy Project.docx
BUS 571 Compensation and BenefitsCompensation Strategy Project.docxBUS 571 Compensation and BenefitsCompensation Strategy Project.docx
BUS 571 Compensation and BenefitsCompensation Strategy Project.docx
 
BUS 475 – Business and Society© 2014 Strayer University. All Rig.docx
BUS 475 – Business and Society© 2014 Strayer University. All Rig.docxBUS 475 – Business and Society© 2014 Strayer University. All Rig.docx
BUS 475 – Business and Society© 2014 Strayer University. All Rig.docx
 
BUS 210 Exam Instructions.Please read the exam carefully and a.docx
BUS 210 Exam Instructions.Please read the exam carefully and a.docxBUS 210 Exam Instructions.Please read the exam carefully and a.docx
BUS 210 Exam Instructions.Please read the exam carefully and a.docx
 
BUS 137S Special Topics in Marketing (Services Marketing)Miwa Y..docx
BUS 137S Special Topics in Marketing (Services Marketing)Miwa Y..docxBUS 137S Special Topics in Marketing (Services Marketing)Miwa Y..docx
BUS 137S Special Topics in Marketing (Services Marketing)Miwa Y..docx
 
BUS 313 – Student NotesCOURSE DESCRIPTIONThis course intro.docx
BUS 313 – Student NotesCOURSE DESCRIPTIONThis course intro.docxBUS 313 – Student NotesCOURSE DESCRIPTIONThis course intro.docx
BUS 313 – Student NotesCOURSE DESCRIPTIONThis course intro.docx
 
BUS 1 Mini Exam – Chapters 05 – 10 40 Points S.docx
BUS 1 Mini Exam – Chapters 05 – 10 40 Points S.docxBUS 1 Mini Exam – Chapters 05 – 10 40 Points S.docx
BUS 1 Mini Exam – Chapters 05 – 10 40 Points S.docx
 
BullyingIntroductionBullying is defined as any for.docx
BullyingIntroductionBullying is defined as any for.docxBullyingIntroductionBullying is defined as any for.docx
BullyingIntroductionBullying is defined as any for.docx
 
BUS1001 - Integrated Business PerspectivesCourse SyllabusSch.docx
BUS1001 - Integrated Business PerspectivesCourse SyllabusSch.docxBUS1001 - Integrated Business PerspectivesCourse SyllabusSch.docx
BUS1001 - Integrated Business PerspectivesCourse SyllabusSch.docx
 
BUMP implementation in Java.docxThe project is to implemen.docx
BUMP implementation in Java.docxThe project is to implemen.docxBUMP implementation in Java.docxThe project is to implemen.docx
BUMP implementation in Java.docxThe project is to implemen.docx
 
BUS 303 Graduate School and Further Education PlanningRead and w.docx
BUS 303 Graduate School and Further Education PlanningRead and w.docxBUS 303 Graduate School and Further Education PlanningRead and w.docx
BUS 303 Graduate School and Further Education PlanningRead and w.docx
 
Bulletin Board Submission 10 Points. Due by Monday at 900 a.m..docx
Bulletin Board Submission 10 Points. Due by Monday at 900 a.m..docxBulletin Board Submission 10 Points. Due by Monday at 900 a.m..docx
Bulletin Board Submission 10 Points. Due by Monday at 900 a.m..docx
 
BUS 371Fall 2014Final Exam – Essay65 pointsDue Monda.docx
BUS 371Fall 2014Final Exam – Essay65 pointsDue  Monda.docxBUS 371Fall 2014Final Exam – Essay65 pointsDue  Monda.docx
BUS 371Fall 2014Final Exam – Essay65 pointsDue Monda.docx
 
Burn with Us Sacrificing Childhood in The Hunger GamesSus.docx
Burn with Us Sacrificing Childhood in The Hunger GamesSus.docxBurn with Us Sacrificing Childhood in The Hunger GamesSus.docx
Burn with Us Sacrificing Childhood in The Hunger GamesSus.docx
 
BUS 305 SOLUTIONS TOPRACTICE PROBLEMS EXAM 21) B2) B3.docx
BUS 305 SOLUTIONS TOPRACTICE PROBLEMS EXAM 21) B2) B3.docxBUS 305 SOLUTIONS TOPRACTICE PROBLEMS EXAM 21) B2) B3.docx
BUS 305 SOLUTIONS TOPRACTICE PROBLEMS EXAM 21) B2) B3.docx
 
Burgerville- Motivation Goals.Peer-reviewed articles.Here ar.docx
Burgerville- Motivation Goals.Peer-reviewed articles.Here ar.docxBurgerville- Motivation Goals.Peer-reviewed articles.Here ar.docx
Burgerville- Motivation Goals.Peer-reviewed articles.Here ar.docx
 
Bullying Bullying in Schools PaperName.docx
Bullying     Bullying in Schools PaperName.docxBullying     Bullying in Schools PaperName.docx
Bullying Bullying in Schools PaperName.docx
 
Building Design and Construction FIRE 1102 – Principle.docx
Building Design and Construction FIRE 1102 – Principle.docxBuilding Design and Construction FIRE 1102 – Principle.docx
Building Design and Construction FIRE 1102 – Principle.docx
 

Recently uploaded

ECONOMIC CONTEXT - LONG FORM TV DRAMA - PPT
ECONOMIC CONTEXT - LONG FORM TV DRAMA - PPTECONOMIC CONTEXT - LONG FORM TV DRAMA - PPT
ECONOMIC CONTEXT - LONG FORM TV DRAMA - PPTiammrhaywood
 
Field Attribute Index Feature in Odoo 17
Field Attribute Index Feature in Odoo 17Field Attribute Index Feature in Odoo 17
Field Attribute Index Feature in Odoo 17Celine George
 
THEORIES OF ORGANIZATION-PUBLIC ADMINISTRATION
THEORIES OF ORGANIZATION-PUBLIC ADMINISTRATIONTHEORIES OF ORGANIZATION-PUBLIC ADMINISTRATION
THEORIES OF ORGANIZATION-PUBLIC ADMINISTRATIONHumphrey A Beña
 
Visit to a blind student's school🧑‍🦯🧑‍🦯(community medicine)
Visit to a blind student's school🧑‍🦯🧑‍🦯(community medicine)Visit to a blind student's school🧑‍🦯🧑‍🦯(community medicine)
Visit to a blind student's school🧑‍🦯🧑‍🦯(community medicine)lakshayb543
 
Earth Day Presentation wow hello nice great
Earth Day Presentation wow hello nice greatEarth Day Presentation wow hello nice great
Earth Day Presentation wow hello nice greatYousafMalik24
 
Difference Between Search & Browse Methods in Odoo 17
Difference Between Search & Browse Methods in Odoo 17Difference Between Search & Browse Methods in Odoo 17
Difference Between Search & Browse Methods in Odoo 17Celine George
 
Barangay Council for the Protection of Children (BCPC) Orientation.pptx
Barangay Council for the Protection of Children (BCPC) Orientation.pptxBarangay Council for the Protection of Children (BCPC) Orientation.pptx
Barangay Council for the Protection of Children (BCPC) Orientation.pptxCarlos105
 
4.18.24 Movement Legacies, Reflection, and Review.pptx
4.18.24 Movement Legacies, Reflection, and Review.pptx4.18.24 Movement Legacies, Reflection, and Review.pptx
4.18.24 Movement Legacies, Reflection, and Review.pptxmary850239
 
ENGLISH 7_Q4_LESSON 2_ Employing a Variety of Strategies for Effective Interp...
ENGLISH 7_Q4_LESSON 2_ Employing a Variety of Strategies for Effective Interp...ENGLISH 7_Q4_LESSON 2_ Employing a Variety of Strategies for Effective Interp...
ENGLISH 7_Q4_LESSON 2_ Employing a Variety of Strategies for Effective Interp...JhezDiaz1
 
Full Stack Web Development Course for Beginners
Full Stack Web Development Course  for BeginnersFull Stack Web Development Course  for Beginners
Full Stack Web Development Course for BeginnersSabitha Banu
 
AMERICAN LANGUAGE HUB_Level2_Student'sBook_Answerkey.pdf
AMERICAN LANGUAGE HUB_Level2_Student'sBook_Answerkey.pdfAMERICAN LANGUAGE HUB_Level2_Student'sBook_Answerkey.pdf
AMERICAN LANGUAGE HUB_Level2_Student'sBook_Answerkey.pdfphamnguyenenglishnb
 
USPS® Forced Meter Migration - How to Know if Your Postage Meter Will Soon be...
USPS® Forced Meter Migration - How to Know if Your Postage Meter Will Soon be...USPS® Forced Meter Migration - How to Know if Your Postage Meter Will Soon be...
USPS® Forced Meter Migration - How to Know if Your Postage Meter Will Soon be...Postal Advocate Inc.
 
DATA STRUCTURE AND ALGORITHM for beginners
DATA STRUCTURE AND ALGORITHM for beginnersDATA STRUCTURE AND ALGORITHM for beginners
DATA STRUCTURE AND ALGORITHM for beginnersSabitha Banu
 
Keynote by Prof. Wurzer at Nordex about IP-design
Keynote by Prof. Wurzer at Nordex about IP-designKeynote by Prof. Wurzer at Nordex about IP-design
Keynote by Prof. Wurzer at Nordex about IP-designMIPLM
 
Proudly South Africa powerpoint Thorisha.pptx
Proudly South Africa powerpoint Thorisha.pptxProudly South Africa powerpoint Thorisha.pptx
Proudly South Africa powerpoint Thorisha.pptxthorishapillay1
 

Recently uploaded (20)

YOUVE GOT EMAIL_FINALS_EL_DORADO_2024.pptx
YOUVE GOT EMAIL_FINALS_EL_DORADO_2024.pptxYOUVE GOT EMAIL_FINALS_EL_DORADO_2024.pptx
YOUVE GOT EMAIL_FINALS_EL_DORADO_2024.pptx
 
Raw materials used in Herbal Cosmetics.pptx
Raw materials used in Herbal Cosmetics.pptxRaw materials used in Herbal Cosmetics.pptx
Raw materials used in Herbal Cosmetics.pptx
 
ECONOMIC CONTEXT - LONG FORM TV DRAMA - PPT
ECONOMIC CONTEXT - LONG FORM TV DRAMA - PPTECONOMIC CONTEXT - LONG FORM TV DRAMA - PPT
ECONOMIC CONTEXT - LONG FORM TV DRAMA - PPT
 
Field Attribute Index Feature in Odoo 17
Field Attribute Index Feature in Odoo 17Field Attribute Index Feature in Odoo 17
Field Attribute Index Feature in Odoo 17
 
LEFT_ON_C'N_ PRELIMS_EL_DORADO_2024.pptx
LEFT_ON_C'N_ PRELIMS_EL_DORADO_2024.pptxLEFT_ON_C'N_ PRELIMS_EL_DORADO_2024.pptx
LEFT_ON_C'N_ PRELIMS_EL_DORADO_2024.pptx
 
THEORIES OF ORGANIZATION-PUBLIC ADMINISTRATION
THEORIES OF ORGANIZATION-PUBLIC ADMINISTRATIONTHEORIES OF ORGANIZATION-PUBLIC ADMINISTRATION
THEORIES OF ORGANIZATION-PUBLIC ADMINISTRATION
 
Visit to a blind student's school🧑‍🦯🧑‍🦯(community medicine)
Visit to a blind student's school🧑‍🦯🧑‍🦯(community medicine)Visit to a blind student's school🧑‍🦯🧑‍🦯(community medicine)
Visit to a blind student's school🧑‍🦯🧑‍🦯(community medicine)
 
Earth Day Presentation wow hello nice great
Earth Day Presentation wow hello nice greatEarth Day Presentation wow hello nice great
Earth Day Presentation wow hello nice great
 
Difference Between Search & Browse Methods in Odoo 17
Difference Between Search & Browse Methods in Odoo 17Difference Between Search & Browse Methods in Odoo 17
Difference Between Search & Browse Methods in Odoo 17
 
Barangay Council for the Protection of Children (BCPC) Orientation.pptx
Barangay Council for the Protection of Children (BCPC) Orientation.pptxBarangay Council for the Protection of Children (BCPC) Orientation.pptx
Barangay Council for the Protection of Children (BCPC) Orientation.pptx
 
4.18.24 Movement Legacies, Reflection, and Review.pptx
4.18.24 Movement Legacies, Reflection, and Review.pptx4.18.24 Movement Legacies, Reflection, and Review.pptx
4.18.24 Movement Legacies, Reflection, and Review.pptx
 
ENGLISH 7_Q4_LESSON 2_ Employing a Variety of Strategies for Effective Interp...
ENGLISH 7_Q4_LESSON 2_ Employing a Variety of Strategies for Effective Interp...ENGLISH 7_Q4_LESSON 2_ Employing a Variety of Strategies for Effective Interp...
ENGLISH 7_Q4_LESSON 2_ Employing a Variety of Strategies for Effective Interp...
 
Full Stack Web Development Course for Beginners
Full Stack Web Development Course  for BeginnersFull Stack Web Development Course  for Beginners
Full Stack Web Development Course for Beginners
 
AMERICAN LANGUAGE HUB_Level2_Student'sBook_Answerkey.pdf
AMERICAN LANGUAGE HUB_Level2_Student'sBook_Answerkey.pdfAMERICAN LANGUAGE HUB_Level2_Student'sBook_Answerkey.pdf
AMERICAN LANGUAGE HUB_Level2_Student'sBook_Answerkey.pdf
 
OS-operating systems- ch04 (Threads) ...
OS-operating systems- ch04 (Threads) ...OS-operating systems- ch04 (Threads) ...
OS-operating systems- ch04 (Threads) ...
 
USPS® Forced Meter Migration - How to Know if Your Postage Meter Will Soon be...
USPS® Forced Meter Migration - How to Know if Your Postage Meter Will Soon be...USPS® Forced Meter Migration - How to Know if Your Postage Meter Will Soon be...
USPS® Forced Meter Migration - How to Know if Your Postage Meter Will Soon be...
 
DATA STRUCTURE AND ALGORITHM for beginners
DATA STRUCTURE AND ALGORITHM for beginnersDATA STRUCTURE AND ALGORITHM for beginners
DATA STRUCTURE AND ALGORITHM for beginners
 
Model Call Girl in Tilak Nagar Delhi reach out to us at 🔝9953056974🔝
Model Call Girl in Tilak Nagar Delhi reach out to us at 🔝9953056974🔝Model Call Girl in Tilak Nagar Delhi reach out to us at 🔝9953056974🔝
Model Call Girl in Tilak Nagar Delhi reach out to us at 🔝9953056974🔝
 
Keynote by Prof. Wurzer at Nordex about IP-design
Keynote by Prof. Wurzer at Nordex about IP-designKeynote by Prof. Wurzer at Nordex about IP-design
Keynote by Prof. Wurzer at Nordex about IP-design
 
Proudly South Africa powerpoint Thorisha.pptx
Proudly South Africa powerpoint Thorisha.pptxProudly South Africa powerpoint Thorisha.pptx
Proudly South Africa powerpoint Thorisha.pptx
 

Biofuel contribution to mitigate fossil fuel CO2 emissionsC.docx

  • 1. Biofuel contribution to mitigate fossil fuel CO2 emissions: Comparing sugar cane ethanol in Brazil with corn ethanol and discussing land use for food production and deforestation Luiz Pinguelli Rosa,a� Christiano Pires de Campos,b� and Maria Silvia Muylaert de Araujoc� COPPE/UFRJ, Cidade Universitária Centro de Tecnologia, Bloco G, sala 101 Ilha do Fundão, CP 68501, 21945-970 Rio de Janeiro, Rio de Janeiro, Brazil �Received 8 October 2008; accepted 30 April 2009; published online 30 June 2009� This paper compares the use of sugar cane and corn for the production of ethanol, with a focus on global warming and the current international debate about land use competition for food and biofuel production. The indicators used to compare the products are CO2 emissions, energy consumption, sugar cane coproducts, and de- forestation. The life cycle emission inventory as a methodological tool is taken into account. The sustainability of socioeconomic development and the developing countries’ need to overcome barriers form the background against which the Bra- zilian government energy plans are analyzed. © 2009 American Institute of
  • 2. Physics. �DOI: 10.1063/1.3139803� I. INTRODUCTION The use of biofuel as a substitute for fossil fuel has became a crucial issue today for several reasons, including �a� the increasing price of the oil barrel and the limited oil resources in the world, �b� the increase in fossil fuel consumption in developing countries, particularly in China, as a result of high economic growth, �c� environmental constraints, mainly greenhouse gas �GHG� emissions and climate change, �d� the challenges of sustainable development and the elimination of extreme poverty in developing countries, and �e� the potential impacts of biofuels on crops for food supply, as well as on deforestation. A literature review was developed to consider the results of recent publications about the role of the biofuel production in the world for programs of GHG emission reductions and sustainable environmental performance. “Depending on the methodology used to account for the local pol- lutant emissions and the global greenhouse gases emissions during the production and consump- tion of both the fossil and biofuels, the results can show huge differences. If it is taken into account a life cycle inventory approach to compare the different fuel sources, these results can present controversies. For example, a comparison study involving the American oil diesel and soybean diesel developed by the National Renewable Energy Laboratory presents CO2 emissions for the biodiesel which are almost 20% of the emissions for the oil diesel: 136 g CO2 / bhp-h for
  • 3. the biodiesel from soybean and 633 g CO2 / bhp-h for the oil diesel.” 1 According to other authors2 the quite relevant issue of the carbon content and the related GHG emission factors also shows huge differences. It is very important “to determine the size of carbon pools in native habitats and the amount of carbon lost from these pools when converted to crop production.3 The relevant carbon pools differed depending on the native habitat and the biofuel crop.” A study developed by Fargione et al. about land clearing and the biofuel carbon debt says a�Electronic mail: [email protected] Tel.: 55-21-25627024. Tel./FAX: 55-21-22701580. b�Electronic mail: [email protected] Tel.: 55-21-38656188. c�Electronic mail: [email protected] Tel.: 55-21-22993080. JOURNAL OF RENEWABLE AND SUSTAINABLE ENERGY 1, 033111 �2009� 1, 033111-11941-7012/2009/1�3�/033111/21/$25.00 © 2009 American Institute of Physics http://dx.doi.org/10.1063/1.3139803 http://dx.doi.org/10.1063/1.3139803 http://dx.doi.org/10.1063/1.3139803 http://dx.doi.org/10.1063/1.3139803 http://dx.doi.org/10.1063/1.3139803 that “when not presented in the literature, dry forest biomass was assumed to be 50% carbon, and
  • 4. US grasslands dry biomass was assumed to be 45% carbon.”4 It is important to highlight that these percentages can result in significant errors and need further research. Another recent study shows that agricultural crops most commonly used at present for biofuel production and climate protection can readily lead to enhanced greenhouse warming. This state- ment relates to N2O. “When the extra N2O emission from biofuel production is calculated in ‘CO2-equivalent’ global warming terms, and compared with the quasicooling effect of ‘saving’ emissions of fossil fuel derived CO2, the outcome is that the production of commonly used biofuels, such as biodiesel from rapeseed and bioethanol from corn �maize�, depending on N fertilizer uptake efficiency by the plants, can contribute as much or more to global warming by N2O emissions than cooling by fossil fuel savings.” 5 Oil still ranks first place among the primary sources of energy, representing 35% of total primary energy in the world, followed by coal, with more than 20%, and natural gas, with a slightly lower percentage. Combined, these three fossil fuels were responsible for three quarters of the world’s energy budget.6 Biomass was dominant throughout the 19th century, being surpassed by coal at the transition from the 19th to the 20th century, and then by oil by the mid-1900s.6 Although its share went down over time, until the 1970s, it has remained nearly constant over the
  • 5. past few decades, at about 10%. One of the reasons for this was the increase in liquid biofuels as substitutes for oil, compensating for the decrease in the traditional uses as firewood. The oil barrel price went up from US$10 in 1999 to US$70 in 2006, reaching over US$100 in 2007 and US$140 in 2008, and then coming down to less than US$100. One factor that explains this behavior is the forecast of limited world oil reserves and production in the near future.7 Although such forecast is uncertain, it does influence policymakers and the market. Other factors that influence the oil economy and related policies include the increase in energy consumption �EC� in developing countries, especially in China, and the Organisation for Eco- nomic Co-operation and Development �OECD� dependence on oil import. Last but not least, we should also mention environmental pressures related to global warming as a result of present and historical GHG emissions from fossil fuels.8–11 Besides the Asian developing countries, after more than a decade of hard monetarist restric- tions and a very low development rate, several Latin America countries, including Brazil, have had significant economic growth over the past years. Nonetheless, in spite of the recent income im- provement of part of the poor, social inequality persists in many countries. Left-wing or center-left political parties did win governmental elections in several Latin American countries, and the resulting political changes that were implemented implied a
  • 6. more direct role of the government in the energy sector. The next section discusses the increasing GHG emissions from fossil fuels in the world and shows that, according to the 2007 IPCC Report, CO2 from fossil fuels is the main contributing factor for global warming �Sec. II�. Section III introduces the case of Brazil, considering energy uses and GHG emissions in the country. Section IV deals with biofuel production in Brazil. Section V discusses sugar cane ethanol in Brazil and compares it with corn ethanol. Section VI deals with land use, competition with food production, and deforestation. Section VII includes the final comments. II. WORLD CO2 EMISSIONS FROM FOSSIL FUELS According to the IPCC Fourth Assessment Report,12 there was a 70% increase in the world’s GHG emissions during the 1970–2004 period. CO2 emissions increased to 80%; 77% of GHG emissions in 2004 were anthropogenic. The highest contributions for the increase in GHG emis- sions during the period came from the electric energy system �145%�, followed by transportation �120%�, industry �65%�, and change in land uses and deforestation �40%�. The combined per capita emission from the US and Canada was 27 tons of CO2 equivalent, while in Latin America, it was 8 tons and in Africa, 4 tons. Therefore, we could state that CO2 is responsible for most GHG emissions, while energy
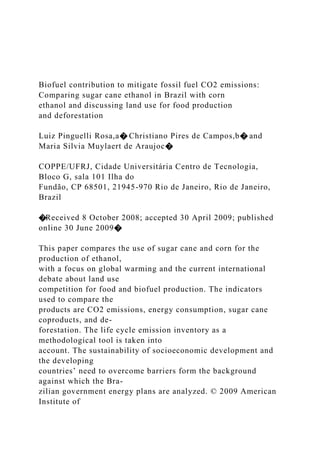
  • 7. 033111-2 Rosa et al. J. Renewable Sustainable Energy 1, 033111 �2009� continues to be the most important source of emissions, including electricity generation, transpor- tation, and industrial activities. Here is the present situation in the world: �1� Until now, the developed countries have not reduced their emissions in order to reach the goals of the Kyoto Protocol, whose period of commitment started in 2008 and will end in 2012. �2� Developing countries tend to increase their emission as their economy grows because they follow the developed countries’ consumption patterns. Figures 1 and 2 illustrate both statements. Figure 1 shows the energy per capita in different countries. The horizontal axis �X� in Fig. 1 shows the gross domestic product �GDP� per capita, while the vertical axis �Y� shows the energy intensity of the economy �energy per GDP� in such a FIG. 1. Energy per capita �E / population = E / GDP � GDP / population� Data are from 1980, 1985, 1990, 1995, 2000, and 2005. Source: Calculated from Ref. 13. FIG. 2. CO2 Emissions per capita from energy �CO2 / population = E / population � CO2 / E� Data are from 1980, 1985, 1990, 1995, 2000, and 2005. Source: Calculated from Ref. 13.
  • 8. 033111-3 Ethanol, climate change, land use... J. Renewable Sustainable Energy 1, 033111 �2009� way that the product XY = energy per capita, represented by the hyperbolas at constant values. The points represent the years 1980, 1985, 1990, 1995, 2000, and 2005 for each country �see legend�. As shown, developed countries have higher GDP per capita and higher energy per capita. The courses followed by them from 1980 to 2005 are quite parallel to the hyperbolas of constant energy per capita, which means that this rate will remain the same along this period. Spain, on the other hand, has shown a significant increase in energy per capita. There was a reduction in the intensity of energy in most developed countries, but the GDP per capita growth was high. The GDP is expressed in current dollars; nevertheless, the growth of GDP per capita over this 25 year period was impressive. In the developing countries, the situation is quite different: very low GDP per capita �X axis� and very low energy per capita �hyperbolas near XY axis�. Figure 1 shows an increase in energy per capita, but GDP per capita in general remained very low. Figure 2 shows CO2 emission per capita from EC in different countries. The horizontal axis �X� represents energy per capita, while the vertical axis �Y� depicts the carbon intensity of the energy system in such a way that the product XY = CO2 emission per capita, represented by the
  • 9. hyperbolas at constant values. The points represent the same years and the same countries as Fig. 1. The developed countries have higher energy per capita and higher CO2 emission per capita from the energy system. Their CO2 emissions per capita from 1980 to 2005 are not as simple as for energy per capita. Developing countries have very low energy per capita �X axis� and very low CO2 emission per capita from energy transformation �hyperbolas closer to XY axis�. There was a trend to increase CO2 per capita. III. ENERGY USES AND GHG EMISSIONS IN BRAZIL In developing countries, EC in the higher income classes is often high; however, once the majority of the population is poor, their EC level is very low. Therefore, there is strong inequality in EC and GHG emissions by family within each country, mirroring inequality in income distri- bution. The same inequality existing between developed countries and developing ones is repro- duced within each country between the high income and the low income classes.14 Such is the case of Brazil. As of 2003, an estimated 12 million Brazilians did not have access to electricity, 88% of which are rural residents. In most of the north region of Brazil �in the Amazon�, there is no grid. There are isolated systems burning diesel oil for electricity generation, which in 2006 spent US$2 billion in subsidies. The governmental program Luz para todos �Power for All� is reducing such discrepancies.15
  • 10. One in every eight Brazilians owns a car.16 According to Table I, the consumption of energy by cars in 2007 in Brazil was 22.49 Mtoe �megatons of oil equivalent� �13.87 Mtoe of gasoline +8.62 Mtoe of ethanol�, while the consumption of diesel oil in transportation for that same year was 28.83 Mtoe,17 from which it is estimated that roughly 10 Mtoe were consumed for public transportation of passengers. Therefore, 12.5% of the Brazilians consume in their cars more than twice the fuel consumed for public transportation, which is used mainly by 87.5% of the popula- tion, i.e., by those families that do not own a car. The above calculation does not include the electric energy use in public transportation or the use of diesel in private cars because they were considered insignificant in Brazil. Assuming that CO2 emission from ethanol is zero and CO2 TABLE I. EC in transport �Brazil, 2007�. Source: Ref. 17. Mtoe Diesel 28.83 Gasoline 13.87 Ethanol 8.62 Othersa 5.58 aIncludes fuel oil, aviation kerosene, natural gas, and electricity. 033111-4 Rosa et al. J. Renewable Sustainable Energy 1, 033111 �2009�
  • 11. emission from gasoline is approximately equal to that from diesel, CO2 emission from every car owner is 9.7 times higher than that of an individual that does not own a car. The recent discovery of large oil fields in Brazil by Petrobras— the so-called Pre-sal area in off shore deep waters—places the country in a very unique situation, entirely different from the world trend. Brazilian oil reserves may reach �30 – 80� � 109 barrels, as compared to the current 14 � 109 barrels. However, in Brazil, renewable energy is an important component of the energy matrix. In 2006, renewable energy amounted to 42%, while its shares in the rest of the world were about 10% and 5% in the OECD countries �Fig. 3�. The renewable energy sources used in large scale in Brazil are hydroelectric energy, alcohol �ethanol� from sugar cane, sugar cane bagasse, firewood, and charcoal �Fig. 4�. Lines in Fig. 4 depict the energy fluxes from energy sources to consumption sectors in the boxes located in the middle. Boxes at the top represent fossil energy, including nuclear energy, while renewable sources are at the bottom, some of them used in large scale. FIG. 3. Renewable and fossil fuel energy. Source: Ref. 17. FIG. 4. Energy flows from source to consumption: fossil and renewable energy in Brazil. 033111-5 Ethanol, climate change, land use... J. Renewable Sustainable Energy 1, 033111 �2009�
  • 12. Among the primary energy sources in the top section of Fig. 4, oil, natural gas, and coal are responsible for CO2 emissions, but nuclear is not, unless the entire life cycle is taken into account. Another important observation is that, among the renewable energy sources in the bottom, hydro- electric energy emits GHG. Although hydropower plant emissions are not included in national inventories of GHG emissions, experimental measures carried out in hydropower reservoirs by a COPPE research group found methane and carbon dioxide emissions, although generally at levels far lower than those of thermopower plants.18 There are in Brazil programs for alternative sources and conservation of energy to avoid GHG emissions involving oil and electricity government-owned companies: �1� the programs for con- servation of energy adopted by Eletrobras and Petrobras; �2� a program implemented by Eletrobras to buy electric energy from wind, biomass, and small hydro �3.3 GW� started in 2003; �3� a blend of biodiesel in diesel oil, according to regulations, starting from 2% and increasing to 3%, involv- ing Petrobras and private companies; and �4� incentives for flex-fuel vehicles that use either ethanol or gasoline in any proportion. IV. BIOFUELS IN BRAZIL AND AUTOMOTIVE ETHANOL There are different sources of biofuels, including �1� forest resources �deforestation and forest management�, �2� energy agriculture �forest plantation, sugar cane, corn, vegetable oils�, �3� ag- riculture wastes �sugar cane bagasse, rice waste, and others,
  • 13. animal wastes�, and �4� urban wastes �solid waste and garbage�. Table II indicates the biomass raw materials with the corresponding technologies, products, and uses in Brazil, as well as the fossil fuels that are replaced. In rural areas, direct combustion of firewood is important for cooking. This kind of firewood use is not equivalent to deforestation because families in rural areas often collect branches of trees, without destroying them. The use of charcoal in steel industry is important for avoiding GHG emissions. For each ton of steel, about 2 tons of CO2 are emitted from coke and coal. Charcoal use in steel production avoids that emission and allows a capture of 1 ton of CO2 from the atmosphere due to the carbon fixed in forest plantation stock. Therefore, the net balance when replacing coke with charcoal is the subtraction of 3 tons of CO2 from the atmosphere for each ton of steel. This means that if TABLE II. Uses of bioenergy in Brazil. Technology Biomass raw material Products Main use Substitution of fossil fuels Combustion Firewood Heat Cooking LPG Sugar cane, bagasse, and trash Industry Fuel oil Electric power Natural gas Wastesa Bioconversion: • Fermentation Sugar cane Ethanol Transport Gasolineb
  • 14. • Anaerobic digestion Wastes Biogas Potential use Natural gas Chemical and thermal: • Pyrolysis Wood Charcoal Industry Coal and oil • Gasification Biomass Synthesis gas Industry Natural gas • Esterification Vegetable oil and other materialsc Biodiesel Transport Diesel • Cracking Vegetable oil Diesel R&D Diesel • Hbiod Vegetable oil Diesel Pilot Diesel Hydrolysis �2nd generation� Biomass Ethanol R&D Gasolineb aIncludes urban solid wastes, lixivia from the pulp and paper industry, waste from rice, and others. bIt can also be a diesel oil substitute with the use of some additives; in Brazil, gasoline is blended with 25% of ethanol, besides the use of pure ethanol in flex-fuel vehicles. cIncludes animal fat waste, garbage, and microalgae �R&D�. dTechnology of Petrobras for processing vegetable oil in oil refineries. 033111-6 Rosa et al. J. Renewable Sustainable Energy 1, 033111 �2009� one-third of steel would be produced with charcoal, the steel industry in Brazil could have zero net emissions. However, nearly half of the firewood for charcoal used in steel production comes from deforestation and only half comes from forest plantation. This is a problem that has yet to be solved.
  • 15. Ethanol is the most important biofuel in Brazil. The Brazilian Alcohol Program started in 1975 after the first oil shock, and, in its first phase, consisted of using ethanol as an additive to gasoline. After the second oil shock in 1979, there was a second phase in which, besides its use as an additive to gasoline, ethanol replaced gasoline in cars whose Otto cycle engines were adapted accordingly. The historical factors contributing for the policy of incentives to start the Alcohol Program included the need of reducing the commercial balance deficit, affected by crude oil imports. Besides, the program also created new jobs in the sugar cane agroindustry and reduced air pollution through the elimination of plumb as an additive to gasoline once ethanol allows high compression in the engine. By 1985, more than 90% of new car sales were of ethanol fueled cars, but in the 1990s there was a shortage of ethanol in the country. A temporary solution was the adoption of a ternary mix composed of ethanol, methanol, and gasoline to supply part of the market.19,20 The result was the lack of consumer confidence in ethanol and the consequent reduction in new car sales with ethanol fueled engines to 11% in 1990, 2% in 1995, and only 1% in 2000.21 The reasons for the ethanol shortage were the decrease in crude oil price and the lack of continuity in the governmental policy regarding ethanol. From 2003 on, flex-fuel car production in Brazil ramped up the automotive use of ethanol. The flex-fuel cars were initially produced in the US in the 1980s, but the technology developed by
  • 16. Brazilian automotive industry engineers in the country is innovative.22 It uses sensors already existing in the car and matches their readings against information stored in an on board computer to adjust the engine to the fuel. The American flex-fuel cars used a special sensor to identify the fuel and adjust the engine accordingly, but it was expensive and unpractical for Brazil, where the car fleet is dominated by small and middle sized compact, low- cost cars.22 Figure 5 depicts ethanol consumption in Brazil. The total ethanol consumption exceeded 15 � 109 l in 1998, progressively decreasing to 10 � 109 l in 2001, then going up again. It reached 17 � 109 l in 2006, and in 2007 ethanol production exceeded 20 � 109 l, of which 3.3 � 109 l were exported.17 Figure 6 shows the evolution of new car sales. It points out the dominance of ethanol-fueled cars in the mid-1980s, a decrease in the 1990s, and the exponential growth of flex-fuel cars after 2003, encouraged by the high relative price of gasoline due to the raise in the crude oil price internationally, as well as by global warming- related pressures, among other fac- tors. FIG. 5. Evolution of ethanol consumption in Brazil ��109 l / year�. Source: Ref. 17. 033111-7 Ethanol, climate change, land use... J. Renewable Sustainable Energy 1, 033111 �2009� The cost of ethanol in Brazil went down from US$20/GJ in 1980
  • 17. to US$6/GJ in 2006, corresponding to US$40/barrel of oil23 following a learning curve. Therefore, while subsidies were necessary to start the program, they are no longer needed. V. LIFE CYCLE CO2 AVOIDED WITH THE USE OF ETHANOL AS A SUBSTITUTE FOR GASOLINE A. Net avoided GHG emissions: Comparing sugar cane ethanol with corn ethanol A problem regarding ethanol in some OECD countries, as well as in China, is the fact that corn ethanol is used in some countries. From the perspective of global warming and GHG emissions—for instance, CO2 emissions from fossil fuel burning—corn ethanol is less effective than sugar cane ethanol as a substitute for gasoline. The advantage of biofuels is that, as biomass grows, it captures the CO2 emitted by biofuel combustion in car engines from the atmosphere. However, the production of 1.3 GJ of ethanol from corn uses up 1 GJ of fossil fuel.24 That is, from each energy unit transformed in heat through corn ethanol combustion, 0.77 energy unit is spent for the production of ethanol from corn. The issue is the consumption of fuel oil for ethanol distillation, as shown in Fig. 7. The variables are as follows: • A, emissions from fossil fuels to make the equipment and for the construction of buildings for corn and ethanol production in a life cycle analysis;
  • 18. • B, emissions from fossil fuels to produce fertilizers and other materials; • C, emissions from fossil fuels in corn production �includes emissions from diesel oil in tractors, mechanization equipment, and trucks for transportation� and from the soil; • D, capture of CO2 from the atmosphere as corn grows; • E, emissions from fossil fuels in ethanol distillation; • F, emissions from electricity generation in the grid for ethanol production; • G, emissions from ethanol combustion in cars; and • H, gross avoided emissions from the use of ethanol as gasoline substitute in a life cycle analysis. Figure 7 shows that there is a balance between CO2 capture from the atmosphere in corn plantation �D� and CO2 emissions �G� from ethanol combustion in cars: FIG. 6. Sales of gasoline, alcohol, and flex-fuel cars in Brazil. Source: Ref. 21. 033111-8 Rosa et al. J. Renewable Sustainable Energy 1, 033111 �2009� balance of CO2 capture by corn: D = G . �1� However, there are emissions from fossil fuel use in the production of corn and ethanol. Therefore, if H is the CO2 that would be emitted by the use of ethanol as a gasoline substitute:
  • 19. net avoided CO2 by corn ethanol: N = H − A − B − C − E − F . �2� On the other hand, sugar cane has enough of biomass surplus to generate heat and electricity in the ethanol production process �Fig. 8�. For each 1 GJ of fossil fuel consumed in sugar cane and ethanol production, there is an average of 9 GJ of ethanol �it can reach 11 GJ at best�.24 Therefore, for each unit of energy transformed in heat when sugar cane ethanol is burned in car engines, only 0.11 unit of energy from fossil fuel is spent for the production of ethanol. Besides the bagasse, sugar cane has a significant amount of trash �leaves and top�, which is often burned before harvesting in order to facilitate the job of workers, but trash can be recovered when mechanization is used instead of manpower in the harvesting of sugar cane. The use of mechanization in sugar cane plantations is increasing in the State of São Paulo, but this reduces employment levels. The variables represented in Fig. 8 are as follows: • A, emissions from fossil fuel to make the equipment and for the construction of buildings for cane and ethanol production in a life cycle analysis; • B, emissions from fossil fuel to produce fertilizers and other materials; • C, emissions from fossil fuel in sugar cane production �it includes emissions from diesel oil in tractors, mechanized harvesting, and trucks for transportation� and from soil �N2O�, as
  • 20. well as CH4 and N2O emissions from burning sugar cane �trash� before harvesting; • C�, CO2 emissions from burning sugar cane before harvesting; • D, capture of CO2 from the atmosphere while sugar cane grows; • E, emissions from sugar cane bagasse combustion in ethanol production; • F, emissions from bagasse combustion for electricity generation; FIG. 7. GHG emissions from corn ethanol production and avoided CO2 emissions. 033111-9 Ethanol, climate change, land use... J. Renewable Sustainable Energy 1, 033111 �2009� • G, emissions in ethanol combustion in cars; • H, gross avoided emissions of the use of ethanol as a gasoline substitute in a life cycle analysis; and • H�, gross avoided emissions of fossil fuel for electric generation in the grid, which is re- placed by electric energy sold by the distilleries using the surplus of bagasse �and trash� after their self-consumption in ethanol production. As shown in Fig. 8, CO2 capture while sugar cane grows �D� is equal to the CO2 emitted when ethanol is burned in car engines �G� plus CO2 emission from the burning of sugar cane before
  • 21. harvesting �C�� plus emissions from bagasse combustion in ethanol distillation �E� and in elec- tricity generation �F� for ethanol production: balance of CO2 capture by sugar cane: D = C� + E + F + G . �3� However, there are emissions in sugar cane and ethanol production to be subtracted from the gross avoided emission H + H� in such a way that net avoided CO2 by sugar cane ethanol: N = H + H� − A − B − C . �4� In the production of ethanol from corn, the unbalanced emission is A + B + C + E + F in Eq. �2�, while for sugar cane ethanol it is A + B + C in Eq. �4�. So, assuming that variables A, B, and C in Eq. �2� are not too different, respectively, from A, B, and C in Eq. �4�, it is clear that net avoided CO2 from sugar cane ethanol is higher than net avoided CO2 from corn ethanol: N�sugar cane� � N�corn� . �5� To calculate the net avoided CO2 emissions, we must subtract, from the gross avoided CO2 emissions due to the use of ethanol as fossil fuel substitute, the emissions of CO2 from fossil fuels used in the sugar cane and ethanol production process, as well as other GHG emitted for the production of sugar cane and ethanol. We must also express the mass of each non-CO2 GHG in terms of equivalent CO2 emissions. For that end, we have used here the global warming power
  • 22. �GWP� for each GHG as provided in the IPCC 1995 Report, incorporated by the UN Climate Convention as a kind of regulation for FIG. 8. GHG emissions from sugar cane ethanol production and avoided CO2 emissions. 033111-10 Rosa et al. J. Renewable Sustainable Energy 1, 033111 �2009� policymakers and adopted in national inventories and by the Clean Development Mechanism �CDM�. The GWP figures have been evaluated by IPCC reports according to the definition by Lashof and Ahuja.25 This definition provides the relative effect of each GHG in thermal radiation forcing on Earth’s surface using CO2 as a reference: GWP �CO2� = 1. However, it does not repre- sent the relative effect of each GHG in global temperature increase due to anthropogenic GHG.12 Therefore, 1 kg of gas X corresponds to GWP�X , T� kg equivalent of CO2, where T indicates the period of time for which the GWP is calculated �usually, T = 100 years�. There is in the literature a range of values for emissions in sugar cane production �it is usual to express alternatively the emission in terms of mass of carbon in the molecule; for instance, the mass of C in CO2 is 12 / �12 + 2 � 16� = 12 / 44 of the CO2 mass and the mass of C in CH4 is 12 / �12 + 4 � 1� = 12 / 16 of the CH4 mass� and for avoided CO2 depending on the case and on the
  • 23. methodology used. For instance, different papers consider alternatively the following: �a� the best situation, a particular case or the average of a set of farmers and distilleries over a period of time; �b� either only the gross avoided emission H from the use of ethanol as a gasoline substitute or the gross avoided emission H + H�, including the gross avoided emission H� of fossil fuel for electric generation in the grid; �c� either only the direct EC or the life cycle analysis, including emissions in ethanol production and in gasoline production to calculate H; and �d� hydrated ethanol, anhydrous ethanol, or a mix of them in the market. Sometimes it is not clear which of the possible alternatives was chosen, generating confusion in quotations. B. Numerical results from field research data on sugar cane ethanol A detailed life cycle analysis was presented in a report funded by the Secretary of Environ- ment of the State of São Paulo.26 The report was based on three surveys, the first one covering 26–31 distilleries, the second one 17–22, and the third one including a larger set of 98 distilleries all over the country. Using this report as a reference, it is possible to calculate representative values for emissions from sugar cane and ethanol production in
  • 24. percentages of CO2 equivalent �Table III�. The GHG emissions in sugar cane and ethanol production and the CO2 that is avoided by ethanol �kg CO2 equivalent / m3 of ethanol� are presented in Table IV. The calculation of the figures in Table IV deserves a detailed technical explanation. The lower heat value of ethanol is compensated by higher compression rate and better efficiency of the engine. In the use of anhy- drous ethanol as a gasoline additive, in a 25% proportion in Brazil �E25�, 1 l of ethanol corre- sponds to 1 l of gasoline. In the case of hydrated ethanol, the proportion is 1.3 l of ethanol �E100� TABLE III. GHG emissions in sugar cane ethanol production �percentages of CO2 equivalent�. Based on data from Ref. 26. Source of emission Kind of emission Percentage From life cycle �A�: equipment, buildings, etc. In sugar cane production 6.6 In ethanol production 9.5 From fertilizers, etc. �B� In sugar cane production 20.6 From burning sugar cane before harvest �C� CH4 19.1 N2O 18.2 From soil �C� N2O 6.9 From fossil fuel consumption �C� CO2 19.1 Adding up �according to Fig. 10� A 16.1 B 20.6 C 63.3
  • 25. 033111-11 Ethanol, climate change, land use... J. Renewable Sustainable Energy 1, 033111 �2009� to 1 l of E25, which means 1 l of ethanol for 0.77 l of E25 or 0.77 � 0.75 = 0.577 l of gasoline. The direct emission factor of gasoline is 0.0693 kg CO2 / MJ. 27 but in life cycle it becomes 0.0817 kg CO2 / MJ. 28 Using the above data, it is possible to calculate the net avoided CO2 in terms of percentage of fossil fuel CO2 emissions: P = 1 − �A + B + C�/�H + H�� . �6� The results are presented in Table IV as follows: Average Best value Percentage of avoided CO2 For anhydrous ethanol 86.5% 88.2% For hydrated ethanol 80.7% 84.1% Instead of the hypothesis of the use of bagasse as a substitute for fuel oil to calculate H�, the emissions from electric power generation in Brazilian interconnected grid established for the CDM can be applied. More recent data on the average emissions can be obtained from Macedo et al.,3 considering the 2005/2006 harvest. Their case study focused on a set of Brazilian distilleries that process 100 Mton of sugar cane per year. The results are as
  • 26. follows: �a� For sugar cane and ethanol production, the total GHG emissions using GWP �Ref. 29� are A + B + C = 436 kg CO2 equivalent / m3 of ethanol. �b� The net CO2 avoided emissions N = H + H� − �A + B + C� = 2323 kg CO2 / m3 of anhydrous ethanol �formula �4��. �c� Applying formula �6�, the percentage of fossil fuel CO2 emission avoided due to anhydrous ethanol is P = 84.1%. The results above, although smaller than those of Table IV, confirm that a very high percentage of GHG emission is avoided by the use of sugar cane ethanol as a substitute for gasoline. We have estimated below the difference between the percentages of avoided CO2 emission by TABLE IV. Energy gain, GHG emissions, and percentage of CO2 that is avoided by the ethanol industry in Brazil. Based on data extracted from Ref. 26. Results from 2002/2003 harvest Average Best value scenario EC �Mcal/ton sugar cane� Sugar cane 48.2 45.8 Ethanol production 11.8 9.5 Total 60.0 55.3 EP �Mcal/ton sugar cane� �ethanol + electric energy from
  • 27. bagasse surplus� 499.4 565.7 Energy gain �EP/EC� 8.3 10.2 GHG emissions �kg CO2 equivalent/ton cane� From fossil fuel consumption 19.2 17.7 Others 15.3 15.3 Total 34.5 33.0 Total GHG emission �kg CO2 equivalent / m3 of ethanol� �A + B + C in Fig. 10� 405.8 358.7 Net avoided CO2 �kg CO2 / m3 of ethanol� from gasoline and fuel oil for electric energy N = H + H� − �A + B + C� in Fig. 8 For anhydrous ethanol 2600 2700 For hydrated ethanol 1700 1900 033111-12 Rosa et al. J. Renewable Sustainable Energy 1, 033111 �2009� sugar cane ethanol and by corn ethanol, predicted by inequality �5�. In the hypothesis of burning fossil fuel for EC at the distillery, as in the case of corn ethanol, the percentage P should be calculated by P = 1 − �A + B + C + E + F�/H . �7� In Brazil, nearly 1 ton of bagasse is consumed to produce 2 m3 of ethanol,30 which means about 20 900 MJ / m3. Assuming that this value is the self- consumption of energy at the distillery
  • 28. �from bagasse combustion� and that, instead of bagasse, natural gas is burned, whose emission in life cycle is 0.095 kg CO2 equivalent / MJ, 28 E + F = 20 900 � 0.095 = 1985 kg CO2 equivalent, and using formula �7�, for a first approximation, the percentage of GHG emission that is avoided is reduced to P = 12%. The above calculation simulates the percentage of CO2 that is avoided in case fossil fuel is burned to produce ethanol. This is what occurs for the production of corn ethanol �Fig. 7�. Even though emissions factors A, B, and C in ethanol production are not the same for corn and sugar cane as raw material, this figure makes it clear that the percentage of CO2 that is avoided by corn ethanol is lower than that of sugar cane ethanol. If P is doubled, its value will nonetheless be small �24%�. Actually, the value of P for corn ethanol can be a little bit higher depending on the efficiency of energy transformation in corn ethanol production. C. Potential of energy efficiency and harvest mechanization for avoiding GHG 1. Potential to improve the energy gain from ethanol, bagasse, and trash The energy balance of sugar cane ethanol can be improved by �a� increasing sugar cane productivity in tons of sugar cane per hectare, �b� increasing the amount of ethanol produced from each ton of sugar cane, �c� using more trash, which means increasing mechanization
  • 29. to reduce sugar cane burning before harvesting, and �d� improving efficiency in bagasse and trash energy transformation in heat and in mechanical and electric energies. The sugar cane productivity went up from 2024 l per hectare in 1975 to 5931 l per hectare in 2005.31 The production in the 1975–2006 period increased from 89 � 106 metric tons to 426 � 106 metric tons.32 The results for recent years are shown in Table V. 55% of sugar cane was used for producing 17.7 Mm3 of ethanol in 2006, that is, 233 Mton with 75.7 l/ton of sugar cane. In 2007/2008, the production is 20.3 Mm3 of ethanol and the forecast for 2008/2009 is 24 Mm3, from which 58% of sugar cane will be for used for ethanol production.33 The best value is 92 l/ton of sugar cane.33 Should a change in the national average in 2006 occur, reaching the best value above, there should be a 21% increase. It is expected that CO2 saving H �formula �6�� through the use of ethanol as a substitute for gasoline could increase in the same proportion. The energy generated from bagasse and trash �top and leaves� is quite significant. Each ton of sugar cane has 280 kg of bagasse with 50% of humidity and 2130 kcal/kg,30 providing 596 Mcal per ton of sugar cane. Assuming the same average value for trash, the energy of bagasse and trash is more than double that of ethanol energy �Table VI�
  • 30. calculated with 92 l with 0.8 kg/l and heat value of 6500 kcal/kg.30 TABLE V. Sugar cane and ethanol production and productivity. Source: Ref. 33. Year Processed cane �Mton� Ethanol �Mm3� Productivity �l/ton� 2003 359.3 14.5 74.8 2006 426.0 17.7 75.7 033111-13 Ethanol, climate change, land use... J. Renewable Sustainable Energy 1, 033111 �2009� In 2006, the bagasse production reached 121.0 Mton: 71.5 Mton �59.1%� for sugar production, 42.0 Mton �34.7%� for ethanol production, and 7.5 Mton �6.2%� for electric power, part of it to the grid.30 Trash is not computed. Therefore, 94% of bagasse is used to make heat and mechanical work for sugar and ethanol production. If there is a reduction of 20% in this percentage through efficiency improvement, the energy of bagasse available for electric power increases by a factor of 0.25 / 0.062 = 4.
  • 31. Besides, if 50% of trash is used, thermal energy for electric generation will increase by a factor of 0.75 / 0.062 = 12. Nowadays only a small part of electric energy from bagasse is sold to the grid, the avoided GHG emission H� due to electric energy sale to the grid will be multiplied by a factor of more than 12. If H� goes up, the amount of CO2 avoided will be higher than the amount avoided from the use of ethanol as a gasoline substitute. The percentage P� of avoided CO2 using H as basis, instead of H + H�, in the denominator of Eq. �6�, is given by the following formula: P� = 1 − �A + B + C − H��/H . �8� By comparing Eq. �8� with Eq. �7�, it is clear that the additive term E + F �emissions from fossil fuel consumption in corn ethanol� is replaced in the numerator by a subtractive term H� �emission avoided by fossil fuel saving in electric power generation to the grid by sugar cane bagasse surplus�. It is clear that, if H� � A + B + C in Eq. �8�, P� � 1. The electric installed capacity using bagasse in 2006 was 2.6 GW,30 85% �2.2 GW� of which were for self- consumption and 15% �only 0.4 GW� were sold to the grid. In that same year, 8357 GW h were produced from sugar cane bagasse, from which 1256 GW h to the grid.30 In the hypothesis of increasing the electric power generation from bagasse by a factor of 4, as pointed above, the installed capacity could become 10.4 GW and 10.4 − 2.2 = 8.2 GW could be sold to the grid, 20 times the
  • 32. current value of 0.4 GW. So, the electric energy from bagasse to the grid in 2006 could grow by a factor of 20, becoming 25 120 GW h. Assuming that natural gas will be replaced, with a life cycle emission of 0.095 kg CO2/MJ �Ref. 28� and 40% of efficiency, the avoided CO2 calculation gives 2.13 � 109 kg of CO2. Once for that year the production of ethanol was 17.7 Mm 3, the avoided CO2 could be 1200 kg CO2 / m3 of ethanol. The bagasse computed for electric generation in the es- timate above did come from ethanol and sugar production because this industry is integrated. Considering that 55% of sugar cane is used for ethanol production, H� = 660 kg CO2 / m3 of ethanol. Using this figure in formula �8�, as well as the average values in Table IV, the result is P� = 1.10, that is, 110%. Therefore, as well as balancing the full emissions of sugar cane and ethanol production, for each ton of CO2 avoided through the use of ethanol as a substitute for gasoline, more 100 kg of CO2 could be avoided due to the use of bagasse surplus for electric power. In 2007, bagasse used for electric power was 8.1 Mton,17 and the installed capacity was 2.8 GW. However, direct sale of electric energy from bagasse in 2007 was about 25% of the installed capacity,34 that is, 0.7 GW. In 2008, a bid for electric power in the grid added 2.2 GW of installed capacity using bagasse, and operations should start in the coming years.15 The power predicted by
  • 33. the bid, added to that realized in 2007, totals 2.9 GW, 35% of the potential of 8.2 GW, calculated with the above assumptions and without major technological changes. TABLE VI. Energy from 1 Mton of sugar cane considering heat values. Source: Ref. 24. Mcal/ton of cane 92 l of ethanol �best value� 478 280 kg of bagasse with 50% of humidity 596 280 kg of trash with 50% of humidity 596 033111-14 Rosa et al. J. Renewable Sustainable Energy 1, 033111 �2009� 2. Scenario for energy per ton of sugar cane and avoided GHG by mechanization Focusing only on ethanol production and referring to Table V and to Ref. 21, bagasse con- sumption for heat and mechanical work in ethanol production amounts to 42 � 2130 / �426 � 0.55� = 382 Mcal / ton of sugar cane. Subtracting this value from 596 Mcal �Table V�, 214 Mcal of bagasse per ton of sugar cane in ethanol production can be used for electric energy. By the same token, 68.2 Mcal of bagasse per ton of sugar cane were used for electric power generation in 2006. Considering the use of 1 l of ethanol �average of hydrated and anhydrous� instead of 0.79 l of gasoline, with heat value of 10 400 kcal/kg and density of 0.74
  • 34. kg/l, the correspondent energy is 0.79 � 0.74 � 10 400 = 6080 kcal per liter of ethanol or 75.7 � 6080 = 460 000 kcal / ton of sugar cane. In the case of 92 l/ton of sugar cane, the equivalent energy will be 559 Mcal /ton of sugar cane. However, trash recovering is limited because trash is also used to protect and fertilize the soil and because mechanization to avoid cane burning cannot be used in more than 50% of the area with the available technology due to declivity. On the other hand, the burning of bagasse and trash could be done with improved thermodynamic efficiency. Based on such considerations, we were able to build a future scenario, presented in Table VII, as compared to 2006. The scenario of Table VII does not take into account potential improvements of efficiency in energy transformation that could increase bagasse surplus, for instance, by changing low- efficiency steam systems for electric power. In many cases, low pressure steam is used. It is reasonable to get more mechanical and electric energy per ton of sugar cane with higher efficiency by decreasing bagasse self-consumption. As a rule, 22 bars of steam pressure are used, which can be increased to 60 or 80 bars, improving efficiency by a factor of 2. The self- consumption of bagasse in ethanol production in some cases is 90% for heat in distillation of ethanol, 5% for mechanical work, and 5% for electric power. If efficiency is improved in the conversion of heat in mechanical and electric energy, the
  • 35. surplus of bagasse will be higher and there will be more electric power to the grid per ton of bagasse. Therefore, H� could be higher again. The mechanization of harvesting, used in such a way to avoid the burning of sugar cane will allow not only a higher value for H� due to the use of trash in electric power generation but also a lower value of emission C in Eq. �6� or Eq. �8�. However, because of the slopes on part of the lands used for sugar cane plantations, it is impossible to reach 100% of mechanization. If mecha- nization is increased by 50% in relation to the case study presented in Table III, there could be a reduction of 0.5 � 37.3% = 18.6% in CO2 equivalent emission of CH4 and N2O from the burning of sugar cane. On the other hand, the use of 50% more harvesting equipment will increase emissions from diesel oil in the same proportion. Assuming that half of fossil fuel consumption in Table III is diesel oil, the correspondent emission that represents 0.5 � .19.1% = 9.5% will increase by 0.5 � 9.5 = 4.75%. The net result should be an emission reduction of 18.6 − 4.75 = 13.85%. Diesel oil TABLE VII. Energy from 1 Mton of sugar cane. Mcal per ton of cane Brazil 2006 Future scenario Variation Ethanol �energy of gasoline replaced� 460a 559b 21% Bagasse for electric energy �partly to grid� 68 214c 314%
  • 36. Trash for electric energy �entirely to grid� 298d Infinite Total 528 1071 102% aConsidering 75.7 l of ethanol per ton of sugar cane �Brazilian average in 2006�. bWith the best value of 92 l of ethanol per ton of sugar cane. cSelf-consumption of 377 Mcal /ton of sugar cane subtracted. d50% of total mass. 033111-15 Ethanol, climate change, land use... J. Renewable Sustainable Energy 1, 033111 �2009� can be eliminated by fueling diesel engines with either biodiesel or ethanol with additive. The variation of indirect energy in life cycle of harvesting equipment �variable A in Table III� is not considered in this approximation. The problem of increasing the mechanization of harvesting is the resulting reduction in work- ers in sugar cane plantations. In 2005, there were 414 000 workers in sugar cane agriculture, 439 000 in sugar production, and 128 000 in the ethanol industry.35 However, manual harvesting of sugar cane is a very hard job that may cause diseases by physical stress. Besides, the burning of sugar cane causes air pollution, which, in turn, is a factor for respiratory conditions for the local population. VI. DISCUSSION ABOUT LAND USE, ETHANOL COMPETITION WITH FOOD, AND DEFORESTATION
  • 37. A. Land uses and deforestation The issue of food crop displacement due to biofuel competition was raised recently by Far- gione et al.4 The paper shows that land use for biofuel increases GHG in atmosphere due to emissions from land use change in the US. The authors used a model for estimating the planted area due to biofuel production. This problem is not new in Brazil. The displacement of food crops by sugar cane in São Paulo was pointed out a long time ago by Homem de Mello.36,37 In fact, there is indeed displacement of food crops, but its dimensions are very different in the case of sugar cane in Brazil and in corn in the US �Table VIII�. The US share in world corn production is higher than the share of Brazil in global sugar cane production, while the area used for corn production in the US is five times the area for sugar cane production in Brazil. The area used for sugar cane production in Brazil is 7 � 106 ha—about 45% for sugar and 55% for ethanol—which means that about 4 � 106 ha are used to produce ethanol. For comparison purposes, soy bean uses 21 � 106 ha and cattle pastures occupy 177 � 106 ha. According to data from the Brazilian Institute of Geography and Statistics,16 the country has 152 Mha useful for agricultural purposes. Therefore, sugar cane for ethanol production uses only 2.6% of the area useful for agriculture, without taking into account the recovery of pasture lands that are being degraded.
  • 38. According to this same source, only 62 Mha are used for food crops, biofuels, and other crops. Therefore, there are 90 Mha available for the expansion of agriculture without deforestation. The Brazilian area of native vegetation is 440 Mha; most of it is located in the Amazonian rain forest, in the north region of the country. The production of sugar cane is concentrated in the southeast, mainly in São Paulo, followed by the middle west region, with some contributions from the south and northeast regions, but only 0.3% from the north region, where the Amazon is located �see Table IX�. The present impact of sugar cane for ethanol on deforestation is low, as compared to soybean for the external and internal markets, which includes biodiesel production. Two points should be noted about biofuels and deforestation: TABLE VIII. Corn in the US � Sugar cane in Brazil. Source: Refs. 16, 32, and 38. US corn Brazil sugar cane Percentage of world production �%� 54 33 Area occupied �Mha� 35 7 TABLE IX. Ethanol production in Brazil per region. Source: Ref. 39. Southeast: 72% Northeast: 7% Middle West: 13% North: 0.3% South:�7.7%
  • 39. 033111-16 Rosa et al. J. Renewable Sustainable Energy 1, 033111 �2009� �a� The presence of sugar cane in the middle west region �13%� impacts the savanna in the Brazilian Cerrado, although this kind of vegetation is less dense than rain forest. �b� The situation of soybean, mainly for exportation but used also for biodiesel, is different because its presence in the north region is high, although biodiesel production in Brazil is relatively small in comparison with ethanol production. One of the goals of the Biodiesel Program was the use of castor oil, palm oil, sunflower, and other raw materials produced by small farmers. However, the present situation is the dominance of large soybean plantations supplying vegetable oil for biodiesel. The drivers of deforestation are 4, mainly in the rain forest: �a� wood extraction, �b� cattle pasture, �c� soybean plantations, and �d� mineral resources exploration. There are different ways of calculating deforested areas depending on whether or not reforested areas are considered because they were deforested areas at some point. In some studies, the deforested areas considered are only the ones that really changed land use definitely, as in the case of agriculture or pasture. In other studies, the accidental
  • 40. burning of biomass is considered defor- estation. Another issue that can result in different figures is the vegetal classification used in the calculation of carbon emissions, as biomass density can be quite different. B. Potential sugar cane expansion and the external market The next issue concerning possible impacts of the potential expansion of sugar cane produc- tion is related to ethanol exports as a substitute for gasoline in OECD countries. The European car fleet features a growing proportion of diesel engines, although there is a non-negligible consump- tion of gasoline either with or without ethanol as additive. Part of the car fleet of Sweden uses a blend of 80% ethanol and 20% gasoline �E80�. Table X shows the countries with more significant ethanol production as well as the countries to which Brazil exports. Only the US and Brazil use ethanol as gasoline substitute in a large scale. In 2006, the US ranked first place in ethanol production, followed by Brazil. However, the percentage of ethanol blended to gasoline is very low in the US because gasoline consumption is very high, which makes the US the largest importer of ethanol from Brazil. Therefore, the most important potential market for Brazilian ethanol is the American market, where Otto cycle engines are predominant in the car fleet. There are other potential importers, such as Japan, where Petro- bras created a joint venture with Mitsubishi to export ethanol. China also uses corn to produce ethanol for cars. In 2006, there were 310 ethanol distilleries in Brazil, and 77 new plants were
  • 41. planned, with investments of over US$14 billions.32 Foreign investors are being attracted to ethanol agrobusiness in Brazil. TABLE X. Ethanol in 2006. Source: Ref. 40. Production Volume of Brazilian exports USA 18 378 � 106 l EUA 1749 � 106 l Brazil 17 000 Netherlands 344 China 3 850 Japan 228 India 1 900 Sweden 201 France 950 El Salvador 183 Germany 765 Jamaica 133 Russia 647 Venezuela 103 Canada 579 Spain 462 South Africa 386 Total 3 417 � 106 l 033111-17 Ethanol, climate change, land use... J. Renewable Sustainable Energy 1, 033111 �2009� Presently, the North American market is not open to Brazilian ethanol. However, in spite of the weak result of international trade negotiations at multilateral level to open it, there are some reasons to believe that the present situation in the US will change, including �a� the inefficacy of corn ethanol to mitigate global warming �see Sec. V above�, �b� the higher competition of corn ethanol with food agriculture �see this section�, �c� the lower productivity per hectare and higher cost of corn
  • 42. ethanol �see Table XI�, and �d� the prediction of increasing the percentage of ethanol to 20% of car fuel �see scenario below�. Based on that, it is reasonable to develop a scenario for future ethanol demand to be supplied through international trade. The gasoline consumption in the US is about 10 � 106 barrels / day. Considering the hypothesis in �d�, with 20% of ethanol and 1.3 l of ethanol for 1 l of gasoline, the future demand will reach 140 � 109 l of ethanol/year, seven times the current Brazilian ethanol production. The necessary land area, with the same technology and average productivity, should be mul- tiplied by 7, resulting in 28 Mha for sugar cane, 30.4% of the land available for the expansion of agriculture in Brazil. This percentage is not small if we consider the need of land for food production and other crops, including biofuels, for the internal market and for export to other countries besides the US. If this demand is doubled, in order to supply European countries and Japan, the area needed for sugar cane would reach 56 Mha, which is too large indeed. Besides, there are the problems of a very large monoculture. Second generation technology for ethanol production must change the present prospects. VII. FINAL COMMENTS The conclusion is that there is no major obstacle, from the land use point of view, to expand
  • 43. ethanol production for the internal market. However, Brazil should not supply the entire potential market for ethanol in the world if ethanol use becomes a way for global warming mitigation in a large scale. A more realistic projection indicates a production of about 36 � 109 l of ethanol in 2012, from which 7 � 109 l are to be exported.32 Another scenario predicts 60 � 109 l of ethanol in 2020 with 12 � 109 l for export.42 Brazil can supply such quantities as long as the areas needed are compat- ible with the available lands for agriculture. As was previously pointed out, CO2 is dominant among GHG emissions and the automotive fleet contributes with 20% of world CO2 emission. The automotive fleet amounted to 890 � 10 6 light vehicles in 2005 and consumes half of the petroleum products in the world.43 Besides, the fleet increases by 20% per year in China and 3.5% in Brazil, where 5.5 � 106 ethanol powered by vehicles were produced since 1979, and 4 � 106 flex-fuel vehicles produced since 2003 are run- ning either on gasoline or on ethanol. Besides, ethanol is added to gasoline in the proportion of 25%. Therefore, cars use from 25% to 100% of ethanol in Brazil. CO2 emission avoided is substantial. However, ethanol itself is not enough to mitigate CO2 emissions at world level. It is also necessary, deep changes, in energy technology, transport
  • 44. �including public transport�, and con- sumption patterns that are still dependent on diesel engines. But ethanol can become an important fuel for different technologies, besides the Otto cycle engines in cars. Combined to additives, TABLE XI. A comparison of sugar cane ethanol with corn ethanol. Source: Refs. 21 and 41. Productivity �l/ha� Costs Sugar cane ethanol 4000–7000 0.19 US$/l �São Paulo� 0.23 US$/l �Northeast Brazil� Corn ethanol 3500–4700 0.33 US$/l 033111-18 Rosa et al. J. Renewable Sustainable Energy 1, 033111 �2009� ethanol could power diesel engines used in buses, trucks, and railway locomotives. It can be used as fuel for hybrid vehicles of electrical propulsion—in which the Otto or diesel engine is coupled to an electric power generator that supplies current for an electrical motor and for accumulating energy in batteries—or in fuel cell vehicles to replace combustion engine to supply current for an electrical motor. Sugar cane is the best way to produce bioethanol from both the economical and the environ- mental point of view, including GHG mitigation through the use of ethanol as a gasoline substi-
  • 45. tute. However, ethanol industry in Brazil must be improved, including the adoption of technologi- cal changes, some of them concerning efficiency in energy transformation and natural resources use. The main changes must be made at the first level: �a� Improving efficiency in the transformation of chemical energy of sugar cane bagasse in heat for distillation and in mechanical and electric energy for self- consumption and to sell energy to the grid; today, the share of bagasse in electric generation in Brazil is too small and must be increased. �b� Using the sugar cane trash, which is burned before harvesting to facilitate the manual job of workers; the amount of energy that could be obtained for electric generation is significant. �c� Item �b� implies the increase in harvesting mechanization in sugar cane agriculture, decreas- ing the number of workers, but work conditions in manual harvesting are harsh. �d� Improving conditions of workers in sugar cane plantations in some cases, including both the social and the environmental dimension in clean energy production �EP�. �e� Improving technology both in agriculture and in the industry. At the second level: �a� gasification of sugar cane bagasse and trash,
  • 46. �b� second generation ethanol production through hydrolysis, and �c� biorefineries with multiple by-products or integrated oil and biorefineries in a more advanced concept. Gasification could either allow high-efficiency conversion into electric energy through com- bined cycle or could be used to produce liquid fuel from gas. Second generation ethanol is hydrolysis acidic or enzymatic, followed by fermentation, that leads to the conversion of biomass fiber �lignin and cellulose� into ethanol. The commercial use of hydrolysis can reduce sugar cane comparative advantage as compared to other kinds of vegetable used to produce ethanol. On the other hand, the entire mass of sugar cane could be used to obtain ethanol, including the hydrolysis of bagasse and trash, as well as allows the fermentation of pentose to produce ethanol. Macedo32 predicted a time horizon between 2010 and 2020 for second generation ethanol to become commercial, while for gasification this time is a little bit longer, 2015–2025, in spite of the already existing technological uses of wood gasification. In the case of hydrolysis, there are prototypes, and some recent small scale industrial plants are being built around the world for ethanol production, although not yet commercial. Biorefineries can produce ethanol together with other chemical by-products. For instance, biodiesel production needs ethanol or methanol and uses glycerol as a by-product that can be used
  • 47. to produce gasoline. Since the beginning, ethanol production in Brazil was integrated to sugar production in the so-called annex distilleries. A more advanced concept is the integration of biorefineries with oil refineries, as, for instance, does the H-bio technology developed by Petrobras �Table II� parallel to biodiesel from vegetable oil. Although this is out of the scope of this paper, biodiesel production must be improved in many aspects that are not dealt with here. Finally, biofuels for private cars must not drop the issue of technical and social efficiencies in transportation nor the encouragement to improve public transportation. A Climate Change policy must find realistic solutions for sustainable development with social justice. The elimination of poverty requires more power per capita in developing countries; however, at the same time, 033111-19 Ethanol, climate change, land use... J. Renewable Sustainable Energy 1, 033111 �2009� intensive energy use is necessary and the consumption patterns of the high income and middle classes must be changed. It is not possible to deeply mitigate global warming without making changes in business as usual EC. LIST OF ABBREVIATIONS AND ACRONYMS CDM Clean Development Mechanism CO2 Carbon dioxide CO2 equivalent Carbon dioxide equivalent COPPE Instituto Alberto Luiz Coimbra de Pós-Graduação e
  • 48. Pesquisa de Engenharia of Federal University of Rio de Janeiro E25 Ethanol 25% GHG greenhouse gas GJ Gigajoules �109� GW Gigawatts �109� GW h Gigawatts hour �109� GWP Global warming potential IPCC International Panel on Climate Change kcal kilocalories �103� kg kilogram m3 cubic meters Mcal Megacalories �106� Mha Megahectare �106� MJ Megajoules �106� Mm3 Mega-cubic-meters �106� Mton Megatons �106� Mtoe Megatons of oil equivalent OECD Organisation for Economic Co-operation and Development 1 M. S. P. Gomes and M. S. Muylaert de Araújo, “Bio-fuels production and the environmental indicators,” Renewable Sustainable Energy Rev. �in press�. 2 M. S. Muylaert de Araujo, C. Silva, and C. P. Campos, Renewable Sustainable Energy Rev. 13, 696 �2009�. 3 I. C. Macedo, J. E. Seabra, and J. E. A. R. Silva, Biomass Bioenergy 32, 582 �2008�. 4 J. Fargione, J. Hill, D. Tilman, S. Polasky, and P. Hawthorne, Science 319, 1235 �2008�. 5 P. J. Crutzen, A. R. Mosier, K. A. Smith, and W. Winiwarter, Atmos. Chem. Phys. 8, 389 �2008�. 6 IFP Innovation, Energy, Environment �IFP� Report, 2005. 7 C. Campbell, The Coming Oil Crisis �Oxford, New York,
  • 49. 2001�. 8 L. P. Rosa and S. K. Ribeiro, Clim. Change 48, 289 �2001�. 9 L. P. Rosa, S. K. Ribeiro, M. S. Muylaert, and C. P. Campos, Energy Policy 32, 1499 �2004�. 10 L. P. Rosa, C. P. de Campos, and M. S. Muylaert, Sci. Total Environ. 346, 149 �2005�. 11 M. S. Muylaert de Araujo, L. P. Rosa, and C. P. de Campos, Renewable Sustainable Energy Rev. 11, 988 �2007�. 12 “Fourth assessment report,” Intergovernmental Panel on Climate Change �IPPC�, 2007. 13 “Key global indicators,” United Nations Statistics Division report �available at http://data.un.org/Data.aspx?d�CDB&f �srID%3a29918, updated 22 May 2008�. 14 M. S. Muylaert, C. Cohen, L. P. Rosa, and A. S. Pereira, Clim. Res. 28, 89 �2004�. 15 Energy Planning Enterprise �EPE�, Brazilian Ministry of Energy report 2008. 16 “National statistics,” Brazilian Institute of Geography and Statistics �IBGE� report, 2007. 17 Balanço Energético Nacional �BEN�, EPE, Brazilian Ministry of Energy preliminary results, 2008. 18 L. P. Rosa, M. A. Santos, B. Matvienko, E. O. Santos, and E. Sikar, Clim. Change 66, 9 �2004�. 19 L. P. Rosa and S. K. Ribeiro, Energy Policy 26, 103 �1998�. 20 L. P. Rosa and S. K. Ribeiro, AMBIO 27, 465 �1998�. 21 M. A. F. Dias de Moraes, “Reflections on Brazil’s ethanol industry,” MRE report, 2007, p. 158. 22 H. Joseph, Jr., “Flexible fuel engine techonology,” MRE report, 2007. 23 J. Goldemberg et al., Biomass and Bioenergy �Elsevier, New York, 2004�, Vol. 26. 24 O. A. Braunbeck, I. Macedo, and L. A. B. Cortez, Increasing the available biomass from sugarcane for energy conversion
  • 50. in International Workshop Implementation Strategies for Biomass Utilization in Europe and Developing Countries, 2001, Stadshotellet, Sweden, Vol. 1, pp. 1-20. 25 D. A. Lashof and D. R. Ahuja, Nature �London� 344, 527 �1990�. 26 I. C. Macedo, M. R. L. V. Leal, and J. E. A. Ramos da Silva, “Balanço das emissões de gases do efeito estufa na produção e no uso do etanol no Brasil,” Secretary of Environment of the State of São Paulo report, 2004. 27 “Guidelines for national GHG inventories, “Intergovernmental Panel on Climate Change �IPPC�, 2006. 28 “Well to wheels, analysis of future automotive fuels and powertrains in the European context,” EUCAR report, 2006. 033111-20 Rosa et al. J. Renewable Sustainable Energy 1, 033111 �2009� http://dx.doi.org/10.1016/j.rser.2007.10.008 http://dx.doi.org/10.1016/j.biombioe.2007.12.006 http://dx.doi.org/10.1126/science.1152747 http://dx.doi.org/10.1023/A:1010720931557 http://dx.doi.org/10.1016/S0301-4215(03)00121-6 http://dx.doi.org/10.1016/j.scitotenv.2004.12.053 http://dx.doi.org/10.1016/j.rser.2005.07.001 http://data.un.org/Data.aspx?d=CDB&f=srID%3a29918 http://data.un.org/Data.aspx?d=CDB&f=srID%3a29918 http://dx.doi.org/10.3354/cr028089 http://dx.doi.org/10.1023/B:CLIM.0000043158.52222.ee http://dx.doi.org/10.1016/S0301-4215(97)00081-5 http://dx.doi.org/10.1038/344529a0 29 “Second assessment report,” Intergovernmental Panel on
  • 51. Climate Change, 1995. 30 Balanço Energético Nacional �BEN�, EPE, Brazilian Ministry of Energy, 2007. 31 P. Nastari, 2005, quoted by M. A. F. Dias de Moraes, 2007. 32 I. C. Macedo, “Ethanol: Current situation and outlook,” MRE report, 2007. 33 “Union of sugar and ethanol industry,” UNICA report, 2008. 34 R. Queiroz �private communication�. 35 Brazilian Ministry of Work and Employment �MTE� report, 2007. 36 F. B. Homem de Mello, Revista de Economia Rural �São Paulo, 1980�, Vol. 18, p. 115. 37 F. B. Homem de Melo, Revista de Economia Rural �São Paulo, 1981�, Vol. 11, p. 83. 38 United States Department of Agriculture �USDA� report, 2008. 39 I. Sauer, “Biofuels in Brazil,” MRE report, 2007. 40 “World energy statistics,” International Energy Agency �IEA� report, 2007. 41 J. Hill, E. Nelson, and D. Tilman, Proc. Natl. Acad. Sci. U.S.A. 103, 11206 �2006�. 42 R. A. M. Costa Reis, Opiniões, Açúcar e Álcool �WDS, São Paulo, 2008�, p. 24. 43 A. Szwarc, “Ethanol and the control of GHG,” MRE report 2007. 033111-21 Ethanol, climate change, land use... J. Renewable Sustainable Energy 1, 033111 �2009� http://dx.doi.org/10.1073/pnas.0604600103