SlideShare a Scribd company logo
1 of 92
Calorie and Fat Sources
Profile Info
Personal: Eduardo Delgado Male 25 yrs 5 ft 10 in
230 lb
Day(s): Day 1 (Breakfast, Lunch, Dinner, Snack), Day 2
(Breakfast, Lunch, Dinner, Snack), Day 3 (Breakfast,
Lunch, Dinner, Snack)
Activity Level: Sedentary Strive for an Active activity level.
Weight Change: None Best not to exceed 2 lbs per week.
BMI: 33.0 Normal is 18.5 to 25. Clinically Obese is 30 or
higher.
The Calorie and Fat Sources report is useful for quickly seeing
the calorie and fat breakdowns of your intake.
The Source of Calories window shows graphically the
percentage of calories from protein, carbohydrates, fat,
and alcohol. The Source of Fat window shows the breakdown of
fat (saturated, monounsaturated,
polyunsaturated, and other fats) as a percentage of total
calories.
Calories: 1980
Ratios
P:S ( Poly Fat / Saturated Fat ) 0.42 : 1
Potassium : Sodium 0.91 : 1
Calcium : Phosphorus 0.71 : 1
CSI ( Cholesterol / Saturated Fat ) 29.23
Exchanges
Starch 5.19
Other Carbs 6.76
Lean Meat 9.58
Alcohol 0.79
Fruit 3.44
Vegetables 4.62
Fat 6.53
NonFatMilk 0.62
Source of Fat
Saturated Fat 6 %
Mono Fat 7 %
Poly Fat 3 %
Trans Fat 0 %
N/A * 6 %
* Complete fat source information is not available for all foods.
N/A Fat accounts for the missing information.
Less than 10% of Calories*
Minimize*
Source of Calories
Protein 21 %
Carbohydrate 54 %
Fat 21 %
%4Alcohol
10-35% of Calories (adults 19+
yrs)*~
45-65% of Calories (adults 19+
yrs)*
20-35% of Calories (adults 19+
yrs)*
Do not exceed 2 standard drinks for
men and 1 standard drink for
women*
* Dietary Reference Intakes
~ Protein recommendations have not been adjusted to take into
account endurance/strength athletes who fall into the active and
very active categories, but do take into account pregnancy and
lactation.
7/14/19 6:23 PM Page 1 of 1
Module 3 - SLP
THE INCOME STATEMENT
Before you start the assignment, test your understanding of
concepts covered in the assignment. It is not a graded quiz, but
a tool for reviewing some key points. The tool can be used
multiple times.
The purpose of this SLP is to apply ratio analysis to assess the
financial health of ABC Company. Use the income statement
presented in the case during this module to compute general or
overall profitability ratios. Compute three ratios using at least
one of the income statement accounts for each ratio. Some
profitability ratios include both income and balance sheet
accounts. The balance sheet accounts are found in module 2.
Assume that ABC Company is a small specialty retail store.
Ratios are relevant when assessed over time or across
companies. IBIS is a comprehensive resource containing market
research and statistics, which can be used to compare ABC
Company to the industry and leaders in the industry.
1. Show the computation of the three ratios.
2. Comment on the purpose and information conveyed by each
ratio.
3. What did you learn about ABC Company by reviewing the
three ratios?
4. What is your conclusion about the profitability of the
company?
5. How successful is ABC Company relative to the industry
average and leaders in the small specialty retail store industry?
Write two paragraphs or more. Include ratios found in the IBIS
database to support your conclusion.
The IBIS database is accessed through the Trident library. See
the steps below.
SLP Assignment Expectations
Show the formulas for the computations. Two to three sentences
are sufficient to respond to questions 1 through 4.
See above for question 5 instructions. Do not use an essay
format.
Show sources when appropriate and APA format is suggested,
but not required.
Module 3 - Case
THE INCOME STATEMENT
Assignment Overview
The background material for this module explains and shows
examples of income statements. Pay attention to the layout and
definitions of the income statement before reviewing the income
statement for ABC Company shown below.
Case Assignment
The background information for the module includes the basic
ideas, but for more ideas go to the optional background
source principlesofaccounting.com. The site also offers multiple
videos that you may find relevant. You may also use other sites
to for ideas to complete the table. Do not forget to reference the
sources used.
Answer the questions below and explain your answer with
numbers, computations, or a sentence or two.
1. Explain the term cost of sales in your own words. Is likely
that the balance sheet of this company includes inventory?
2. Gross profit (margin) is a key piece of financial information.
Why is it so important?
3. Explain operating expenses? What does the term mean?
4. Does ABC Company have any employees? Explain.
5. There is an error in the income statement. Property taxes are
overstated by $10,000. How is the income statement affected by
a correction of property taxes?
6. What happens to net income if the company hires a new
manager at a salary of $80,000?
7. Does the company own any equipment? Is it informative to
also check the balance sheet to answer this question? Explain.
8. Does the company have debt? How much debt? Explain how
the income statement and balance sheet provide answers to the
questions?
9. How do we know that ABC Company is using the accrual
basis of accounting? Hint: Do not forget to look at the balance
sheet from the prior module.
10. What happens to income statement at the end of the period?
Is it continuous or does it close (terminate)?
Assignment Expectations
Respond to all questions showing your computations and/or
using your own words. Do not use an essay format.
Show sources when appropriate and APA format is suggested,
but not required.
· The objective for this assignment is to evaluate accounting
concepts of income statement.
Privacy Policy | Contact
MyPlate
Profile Info
Personal: Eduardo Delgado Male 25 yrs 5 ft 10 in
230 lb
Day(s): Day 1 (Breakfast, Lunch, Dinner, Snack), Day 2
(Breakfast, Lunch, Dinner, Snack), Day 3 (Breakfast,
Lunch, Dinner, Snack)
Activity Level: Sedentary Strive for an Active activity level.
Weight Change: None Best not to exceed 2 lbs per week.
BMI: 33.0 Normal is 18.5 to 25. Clinically Obese is 30 or
higher.
The MyPlate Food Guide report displays graphically how close
the foodlist compares to the lastest USDA Dietary
Guidelines (see ChooseMyPlate.gov for more info).
Group Percent Amount
Dairy Intake 21 % 0.6
Dairy Recommendation 3.0
cup equivalent
cup equivalent
Protein Foods Intake 172 % 12.
Protein Foods Recommendation 7.0
oz equivalent
oz equivalent
Vegetables Intake 81 % 3.2
Vegetables Recommendation 4.0
cup equivalent
cup equivalent
Fruits Intake 76 % 1.9
Fruits Recommendation 2.5
cup equivalent
cup equivalent
Grains Intake 38 % 3.8
Grains Recommendation 10.
oz equivalent
oz equivalent
Comparison
3000 Calorie Pattern
Make Half Your Grains Whole Vary Your Vegetables
Oils & Empty Calories
Dark Green Vegetables
Orange Vegetables
Dry Beans & Peas
Starchy Vegetables
Other Vegetables
cups weekly3.0
cups weekly2.5
cups weekly3.5
cups weekly9.0
cups weekly10.
Aim for at least 5.0 oz equivalents whole grains a
day
Aim for 10.0 teaspoons of oils a day
Limit your extra fats & sugars to 512 Calories a
Intake vs. Recommendation
oz equivalent is a 1 ounce estimate, rounded to consumer
friendly units. For example, an oz equivalent of
Grains is 1 slice of bread, or 1/2 cup of rice. An oz equivalent
of Protein Foods 1 oz of meat, 1 egg, or 1/4 cup
cooked beans.
*
*
7/14/19 6:26 PM Page 2 of 2
All Nutrients Spreadsheet
This report shows all nutrient values in a spreadsheet format.
Nutrients are displayed horizontally, with totals at
the bottom of the list.
Profile Info
Personal: Eduardo Delgado Male 25 yrs 5 ft 10 in
230 lb
Day(s): Day 1 (Breakfast, Lunch, Dinner, Snack), Day 2
(Breakfast, Lunch, Dinner, Snack), Day 3 (Breakfast,
Lunch, Dinner, Snack)
Activity Level: Sedentary Strive for an Active activity level.
Weight Change: None Best not to exceed 2 lbs per week.
BMI: 33.0 Normal is 18.5 to 25. Clinically Obese is 30 or
higher.
ItemDay Meal Amount Cals FatCal SatFatCal Prot (g)
Day 1 Breakfast orange, fresh, medium, 2 5/8" ea1 61.6 1.4 0.1
1.2
egg, hard boiled, large (USDA) ea2 155 95.4 29.3 12.6
coffee, brewed, with tap water cup1 2.4 0.4 0 0.3
sugar, white, granulated (USDA) Tbs1 48.7 0 0 0
bread, whole grain artisan, side2 620 81 9 20
water, municipal tap (USDA) fl-oz16 0 0 0 0
milk, 1%, with vitamins A & D cup0.5 51.2 10.6 6.9 4.1
Lunch chicken breast, chunk, canned, oz3 67.5 13.5 0 13.5
bread, whole grain artisan, side2 620 81 9 20
soup, vegetable, canned, cup1 163.8 20.3 3.2 5.5
spinach, fresh, leaf (USDA) ea6 13.8 1.6 0.3 1.7
tomatoes, fresh, year round slice2 7.2 0.7 0.1 0.4
mustard, yellow, prepared tsp1 3 1.4 0.1 0.2
water, non-carbonated (USDA: fl-oz16 0 0 0 0
Dinner chicken breast filet, flame oz6 225.6 31.2 7.8 29.5
peas, green, boiled, drained cup0.5 67.2 1.5 0.3 4.3
potato skin, baked (USDA) ea1 114.8 0.4 0.1 2.5
wine, red (USDA) fl-oz5.5 137.4 0 0 0.1
water, municipal tap (USDA) (2) fl-oz8 0 0 0 0
Snack cookie, milk chocolate, Milano ea2 113.3 54 24 1.3
water, municipal tap (USDA) (3) fl-oz8 0 0 0 0
Day Total -- 2472.7 394.6 90.3 117.2
Day 2 Breakfast muffin, toaster, wheat bran, ea1 106.4 28.7 4.6
1.9
sausage, beef & chicken, hot pce5 142.4 96 39.6 9.7
mango, fresh (USDA) ea1 201.6 11.4 2.7 2.8
milk, 1%, with vitamins A & D cup0.3 34.2 7.1 4.6 2.7
coffee, brewed, with tap water cup1 2.4 0.4 0 0.3
water, municipal tap (USDA) fl-oz16 0 0 0 0
Lunch chicken breast, oven roasted, oz5.5 123.2 5.3 1.7 26.2
salad mix, classic iceberg (Dole) cup1.5 15 0 0 1
tomatoes, cherry, red, fresh, ea5 15.3 1.4 0.2 0.7
ItemDay Meal Amount Cals FatCal SatFatCal Prot (g)
Day 2 Lunch onion, red, fresh, rings (USDA) ea6 14.4 0.3 0.1
0.4
croutons, seasoned, cubes ea10 11.6 4.1 1.2 0.3
salad dressing, italian (USDA) tsp2 23.5 18.6 2.6 0
water, Poland Spring (USDA: fl-oz16 0 0 0 0
Dinner halibut, atlantic, baked, fillet oz6 188.8 24.6 5.4 38.3
lemon juice, fresh (USDA) tsp1 1.1 0.1 0 0
broccoli florets, fresh (USDA) cup2 39.8 4.3 0.4 4.2
rice mix, long grain & wild, oz4 397.9 0 0 11.9
wine, white, pinot grigio (USDA) fl-oz5.5 134.2 0 0 0.1
water, municipal tap (USDA) (2) fl-oz8 0 0 0 0
Snack banana, fresh, large, 8" to 8 ea1 121 4 1.4 1.5
water, municipal tap (USDA) (3) fl-oz8 0 0 0 0
Day Total -- 1572.8 206.4 64.4 102
Day 3 Breakfast english muffin, plain (USDA: ea1 132.2 9.2 1.5
4.6
almond butter (USDA) Tbs2 196.5 159.8 18.8 6.7
banana, fresh, large, 8" to 8 ea1 121 4 1.4 1.5
milk, 1%, with vitamins A & D cup1 102.5 21.2 13.9 8.2
water, municipal tap (USDA) fl-oz16 0 0 0 0
Lunch crackers, saltine, original, Zesta ea6 72 16.2 0 1.2
pears, fresh (USDA) med1 101.5 2.2 0.2 0.6
sandwich, turkey breast, with ea1 280 31.5 9 18
soup, homestyle chicken noodle indv cup1 110 27 13.5 8
water, Dasani, non-carbonated fl-oz16 0 0 0 0
Dinner beef steak, top sirloin, broiled, oz6 437.1 241.1 94.9
45.6
mashed potatoes, prepared from cup0.5 118.6 39.9 24.7 2
asparagus, fresh (USDA) cup1 26.8 1.4 0.4 2.9
water, municipal tap (USDA) (2) fl-oz16 0 0 0 0
Snack cashews, salted, dry roasted, cup0.2 196.6 142.8 28.2 5.2
water, municipal tap (USDA) (3) fl-oz8 0 0 0 0
Day Total -- 1894.9 696.3 206.3 104.5
Average Day Total -- 1980.1 432.4 120.3 107.9
ItemDay Meal Carbs (g) Sugar (g) SugAdd (g) Fiber (g) Fib-S
(g) Fib-I (g)
Day 1 Breakfast orange, fresh, medium, 2 5/8" 15.4 12.2 0 3.1
2.1 1.1
egg, hard boiled, large (USDA) 1.1 1.1 0 0 0 0
coffee, brewed, with tap water 0 0 0 0 0 0
sugar, white, granulated (USDA) 12.6 12.6 12.6 0 0 0
bread, whole grain artisan, 126 50 12
water, municipal tap (USDA) 0 0 0 0 0 0
milk, 1%, with vitamins A & D 6.1 6.1 0 0 0 0
Lunch chicken breast, chunk, canned, 0 0 0 0 0 0
bread, whole grain artisan, 126 50 12
soup, vegetable, canned, 30.5 10.9 5.3
spinach, fresh, leaf (USDA) 2.2 0.2 0 1.3
tomatoes, fresh, year round 1.6 1 0 0.5
ItemDay Meal Carbs (g) Sugar (g) SugAdd (g) Fiber (g) Fib-S
(g) Fib-I (g)
Day 1 Lunch mustard, yellow, prepared 0.3 0 0.2
water, non-carbonated (USDA: 0 0 0 0 0 0
Dinner chicken breast filet, flame 17.4 12.1 0 0 0
peas, green, boiled, drained 12.5 4.7 0 4.4 1.2 3.2
potato skin, baked (USDA) 26.7 0.8 0 4.6
wine, red (USDA) 4.2 1 0 0 0 0
water, municipal tap (USDA) (2) 0 0 0 0 0 0
Snack cookie, milk chocolate, Milano 13.3 7.3 0.7
water, municipal tap (USDA) (3) 0 0 0 0 0 0
Day Total 395.8 170.2 12.6 44.1 3.3 4.3
Day 2 Breakfast muffin, toaster, wheat bran, 18.9 7.8 2.8 0.5
2.3
sausage, beef & chicken, hot 2 0 0 0 0 0
mango, fresh (USDA) 50.3 45 0 5.3 3 2.2
milk, 1%, with vitamins A & D 4.1 4.1 0 0 0 0
coffee, brewed, with tap water 0 0 0 0 0 0
water, municipal tap (USDA) 0 0 0 0 0 0
Lunch chicken breast, oven roasted, 3.4 0.1 0 0 0
salad mix, classic iceberg (Dole) 4 2 0 1
tomatoes, cherry, red, fresh, 3.3 2.2 0 1
onion, red, fresh, rings (USDA) 3.4 1.5 0 0.6
croutons, seasoned, cubes 1.6 0.1 0.1
salad dressing, italian (USDA) 1.2 1.1 0 0 0
water, Poland Spring (USDA: 0 0 0 0 0 0
Dinner halibut, atlantic, baked, fillet 0 0 0 0 0 0
lemon juice, fresh (USDA) 0.4 0.1 0 0 0 0
broccoli florets, fresh (USDA) 7.2 2.1 3.2 0.4 2.9
rice mix, long grain & wild, 87.5 2 2
wine, white, pinot grigio (USDA) 3.3
water, municipal tap (USDA) (2) 0 0 0 0 0 0
Snack banana, fresh, large, 8" to 8 31.1 16.6 0 3.5
water, municipal tap (USDA) (3) 0 0 0 0 0 0
Day Total 221.5 84.8 0 19.6 3.9 7.4
Day 3 Breakfast english muffin, plain (USDA: 26.2
almond butter (USDA) 6 2 0 3.3 0.4 2.9
banana, fresh, large, 8" to 8 31.1 16.6 0 3.5
milk, 1%, with vitamins A & D 12.2 12.2 0 0 0 0
water, municipal tap (USDA) 0 0 0 0 0 0
Lunch crackers, saltine, original, Zesta 14.4 0 0 0 0 0
pears, fresh (USDA) 27.1 17.4 0 5.5 1.1 4.4
sandwich, turkey breast, with 46 7 5
soup, homestyle chicken noodle 14 2 1
water, Dasani, non-carbonated 0 0 0 0 0 0
Dinner beef steak, top sirloin, broiled, 0 0 0 0 0 0
mashed potatoes, prepared from 17.6 1.5 1.6
asparagus, fresh (USDA) 5.2 2.4 0 2.7
ItemDay Meal Carbs (g) Sugar (g) SugAdd (g) Fiber (g) Fib-S
(g) Fib-I (g)
Day 3 Dinner water, municipal tap (USDA) (2) 0 0 0 0 0 0
Snack cashews, salted, dry roasted, 11.2 1.7 0 1 0.5 0.5
water, municipal tap (USDA) (3) 0 0 0 0 0 0
Day Total 211 62.8 0 23.7 2 7.8
Average Day Total 276.1 105.9 4.2 29.1 3.1 6.5
ItemDay Meal Fat (g) Fat-S (g) Fat-T (g) Fat-M (g) Fat-P (g)
Chol (mg)
Day 1 Breakfast orange, fresh, medium, 2 5/8" 0.2 0 0 0 0 0
egg, hard boiled, large (USDA) 10.6 3.3 4.1 1.4 373
coffee, brewed, with tap water 0 0 0 0 0 0
sugar, white, granulated (USDA) 0 0 0 0 0 0
bread, whole grain artisan, 9 1 0 0
water, municipal tap (USDA) 0 0 0 0 0 0
milk, 1%, with vitamins A & D 1.2 0.8 0 0.3 0 6.1
Lunch chicken breast, chunk, canned, 1.5 0 52.5
bread, whole grain artisan, 9 1 0 0
soup, vegetable, canned, 2.3 0.4 0.5 1 0
spinach, fresh, leaf (USDA) 0.2 0 0 0 0.1 0
tomatoes, fresh, year round 0.1 0 0 0 0 0
mustard, yellow, prepared 0.2 0 0 0.1 0 0
water, non-carbonated (USDA: 0 0 0 0 0
Dinner chicken breast filet, flame 3.5 0.9 0 69.4
peas, green, boiled, drained 0.2 0 0 0 0.1 0
potato skin, baked (USDA) 0 0 0 0 0 0
wine, red (USDA) 0 0 0 0 0 0
water, municipal tap (USDA) (2) 0 0 0 0 0 0
Snack cookie, milk chocolate, Milano 6 2.7 0 3.3
water, municipal tap (USDA) (3) 0 0 0 0 0 0
Day Total 43.8 10 0 5.1 2.7 504.4
Day 2 Breakfast muffin, toaster, wheat bran, 3.2 0.5 0.8 1.7 3.1
sausage, beef & chicken, hot 10.7 4.4 5.3 0.4 36.3
mango, fresh (USDA) 1.3 0.3 0 0.5 0.2 0
milk, 1%, with vitamins A & D 0.8 0.5 0 0.2 0 4.1
coffee, brewed, with tap water 0 0 0 0 0 0
water, municipal tap (USDA) 0 0 0 0 0 0
Lunch chicken breast, oven roasted, 0.6 0.2 0.2 0.1 56.1
salad mix, classic iceberg (Dole) 0 0 0 0 0 0
tomatoes, cherry, red, fresh, 0.2 0 0 0 0 0
onion, red, fresh, rings (USDA) 0 0 0 0 0 0
croutons, seasoned, cubes 0.5 0.1 0.2 0.1 0.2
salad dressing, italian (USDA) 2.1 0.3 0 0.5 1 0
water, Poland Spring (USDA: 0 0 0 0 0 0
Dinner halibut, atlantic, baked, fillet 2.7 0.6 0 1 0.6 102.1
lemon juice, fresh (USDA) 0 0 0 0 0 0
broccoli florets, fresh (USDA) 0.5 0 0 0 0.2 0
ItemDay Meal Fat (g) Fat-S (g) Fat-T (g) Fat-M (g) Fat-P (g)
Chol (mg)
Day 2 Dinner rice mix, long grain & wild, 0 0 0 0 0 0
wine, white, pinot grigio (USDA) 0 0 0 0 0
water, municipal tap (USDA) (2) 0 0 0 0 0 0
Snack banana, fresh, large, 8" to 8 0.4 0.2 0 0 0.1 0
water, municipal tap (USDA) (3) 0 0 0 0 0 0
Day Total 22.9 7.2 0.1 8.8 4.5 201.8
Day 3 Breakfast english muffin, plain (USDA: 1 0.2 0 0.2 0.5
almond butter (USDA) 17.8 2.1 0 10.4 4.4 0
banana, fresh, large, 8" to 8 0.4 0.2 0 0 0.1 0
milk, 1%, with vitamins A & D 2.4 1.5 0.1 0.7 0.1 12.2
water, municipal tap (USDA) 0 0 0 0 0 0
Lunch crackers, saltine, original, Zesta 1.8 0 0 0 0.6 0
pears, fresh (USDA) 0.2 0 0 0.1 0.1 0
sandwich, turkey breast, with 3.5 1 0 20
soup, homestyle chicken noodle 3 1.5 0 30
water, Dasani, non-carbonated 0 0 0 0 0
Dinner beef steak, top sirloin, broiled, 26.8 10.5 11.2 1 163.3
mashed potatoes, prepared from 4.4 2.7 0.2 1.1 0.2 11.6
asparagus, fresh (USDA) 0.2 0 0 0 0.1 0
water, municipal tap (USDA) (2) 0 0 0 0 0 0
Snack cashews, salted, dry roasted, 15.9 3.1 0 9.4 2.7 0
water, municipal tap (USDA) (3) 0 0 0 0 0 0
Day Total 77.4 22.9 0.3 33 9.7 237
Average Day Total 48 13.4 0.1 15.6 5.6 314.4
ItemDay Meal Water (g) A-RAE(mcg)A-Car (mcg) B1 (mg) B2
(mg) B3 (mg)
Day 1 Breakfast orange, fresh, medium, 2 5/8" 113.6 14.7 93
0.1 0 0.4
egg, hard boiled, large (USDA) 74.6 149 11 0.1 0.5 0.1
coffee, brewed, with tap water 235.4 0 0 0 0.2 0.4
sugar, white, granulated (USDA) 0 0 0 0 0 0
bread, whole grain artisan,
water, municipal tap (USDA) 473.1 0 0 0 0 0
milk, 1%, with vitamins A & D 109.7 71 2.4 0 0.2 0.1
Lunch chicken breast, chunk, canned,
bread, whole grain artisan,
soup, vegetable, canned, 208.6 216.8 2205 0.3 0.2 3.9
spinach, fresh, leaf (USDA) 54.8 281.3 3375.6 0 0.1 0.4
tomatoes, fresh, year round 37.8 16.7 179.6 0 0 0.2
mustard, yellow, prepared 4.2 0.3 2.6 0 0 0
water, non-carbonated (USDA: 473.6
Dinner chicken breast filet, flame 0 0
peas, green, boiled, drained 62.3 32 376 0.2 0.1 1.6
potato skin, baked (USDA) 27.4 0.3 3.5 0.1 0.1 1.8
wine, red (USDA) 139.9 0.2 1.6 0 0 0.4
water, municipal tap (USDA) (2) 236.6 0 0 0 0 0
ItemDay Meal Water (g) A-RAE(mcg)A-Car (mcg) B1 (mg) B2
(mg) B3 (mg)
Day 1 Snack cookie, milk chocolate, Milano 0 0
water, municipal tap (USDA) (3) 236.6 0 0 0 0 0
Day Total 2488.2 782.2 6250.3 0.8 1.4 9.3
Day 2 Breakfast muffin, toaster, wheat bran, 9.2 19.1 0.3 0.1
0.1 0.8
sausage, beef & chicken, hot 30.4 0 0 0.3 0.1 1.9
mango, fresh (USDA) 280.4 181.8 2150.4 0.1 0.1 2.2
milk, 1%, with vitamins A & D 73.1 47.3 1.6 0 0.1 0.1
coffee, brewed, with tap water 235.4 0 0 0 0.2 0.4
water, municipal tap (USDA) 473.1 0 0 0 0 0
Lunch chicken breast, oven roasted, 119.6 0 0 0 0 5.3
salad mix, classic iceberg (Dole) 125
tomatoes, cherry, red, fresh, 80.3 35.4 381.6 0 0 0.5
onion, red, fresh, rings (USDA) 32.1 0 0.4 0 0 0
croutons, seasoned, cubes 0.1 0.2 0.2 0 0 0.1
salad dressing, italian (USDA) 6.2 0.2 2.1 0 0 0
water, Poland Spring (USDA: 474 0 0 0 0
Dinner halibut, atlantic, baked, fillet 129.5 40.8 0 0.1 0.1 13.5
lemon juice, fresh (USDA) 4.7 0 0.1 0 0 0
broccoli florets, fresh (USDA) 128.8 213 0.1 0.2 0.9
rice mix, long grain & wild, 29.8 0.6 6
wine, white, pinot grigio (USDA) 140.6
water, municipal tap (USDA) (2) 236.6 0 0 0 0 0
Snack banana, fresh, large, 8" to 8 101.9 4.4 35.4 0 0.1 0.9
water, municipal tap (USDA) (3) 236.6 0 0 0 0 0
Day Total 2792.4 697 2572 1.4 1 32.6
Day 3 Breakfast english muffin, plain (USDA: 24.3 0
almond butter (USDA) 0.5 0 0.3 0 0.3 1
banana, fresh, large, 8" to 8 101.9 4.4 35.4 0 0.1 0.9
milk, 1%, with vitamins A & D 219.4 141.9 4.9 0 0.4 0.2
water, municipal tap (USDA) 473.1 0 0 0 0 0
Lunch crackers, saltine, original, Zesta
pears, fresh (USDA) 149.4 2.2 24.9 0 0 0.3
sandwich, turkey breast, with
soup, homestyle chicken noodle
water, Dasani, non-carbonated 473.4
Dinner beef steak, top sirloin, broiled, 96.6 0 0 0.1 0.2 12.3
mashed potatoes, prepared from 79.4 39.9 9.4 0.1 0 1.1
asparagus, fresh (USDA) 124.9 50.6 601.7 0.2 0.2 1.3
water, municipal tap (USDA) (2) 473.1 0 0 0 0 0
Snack cashews, salted, dry roasted, 0.6 0 0 0.1 0.1 0.5
water, municipal tap (USDA) (3) 236.6 0 0 0 0 0
Day Total 2453.2 239 676.6 0.5 1.3 17.6
Average Day Total 2577.9 572.7 3166.3 0.9 1.3 19.8
ItemDay Meal B6 (mg) B12 (mcg) C (mg) D (mcg) E-Toco
(mg)Fola (mcg)
Day 1 Breakfast orange, fresh, medium, 2 5/8" 0.1 0 69.7 0 0.2
39.3
egg, hard boiled, large (USDA) 0.1 1.1 0 2.2 1 44
coffee, brewed, with tap water 0 0 0 0 0 4.7
sugar, white, granulated (USDA) 0 0 0 0 0 0
bread, whole grain artisan,
water, municipal tap (USDA) 0 0 0 0 0 0
milk, 1%, with vitamins A & D 0 0.6 0 1.5 0 6.1
Lunch chicken breast, chunk, canned,
bread, whole grain artisan,
soup, vegetable, canned, 0.4 0 2 0 3.6 30.2
spinach, fresh, leaf (USDA) 0.1 0 16.9 0 1.2 116.4
tomatoes, fresh, year round 0 0 5.5 0 0.2 6
mustard, yellow, prepared 0 0 0 0 0 0.4
water, non-carbonated (USDA:
Dinner chicken breast filet, flame 2.1
peas, green, boiled, drained 0.2 0 11.4 0 0.1 50.4
potato skin, baked (USDA) 0.4 0 7.8 0 0 12.8
wine, red (USDA) 0.1 0 0 0 0 1.6
water, municipal tap (USDA) (2) 0 0 0 0 0 0
Snack cookie, milk chocolate, Milano 0
water, municipal tap (USDA) (3) 0 0 0 0 0 0
Day Total 1.4 1.7 115.3 3.7 6.4 311.9
Day 2 Breakfast muffin, toaster, wheat bran, 0 0 0 0.3 10.2
sausage, beef & chicken, hot 0.1 0.5 0 1.1
mango, fresh (USDA) 0.4 0 122.3 0 3 144.5
milk, 1%, with vitamins A & D 0 0.4 0 1 0 4.1
coffee, brewed, with tap water 0 0 0 0 0 4.7
water, municipal tap (USDA) 0 0 0 0 0 0
Lunch chicken breast, oven roasted, 0.2 0.1 0 1.6
salad mix, classic iceberg (Dole) 6
tomatoes, cherry, red, fresh, 0 0 11.6 0 0.4 12.8
onion, red, fresh, rings (USDA) 0 0 2.7 0 0 6.8
croutons, seasoned, cubes 0 0 0 0 0 2.6
salad dressing, italian (USDA) 0 0 0 0 0.2 0
water, Poland Spring (USDA: 0 0 0 0
Dinner halibut, atlantic, baked, fillet 1.1 2.2 0 9.9 1.3 23.8
lemon juice, fresh (USDA) 0 0 2 0 0 1
broccoli florets, fresh (USDA) 0.2 0 132.3 0 100.8
rice mix, long grain & wild, 9.5 0 198.9
wine, white, pinot grigio (USDA)
water, municipal tap (USDA) (2) 0 0 0 0 0 0
Snack banana, fresh, large, 8" to 8 0.5 0 11.8 0 0.1 27.2
water, municipal tap (USDA) (3) 0 0 0 0 0 0
Day Total 2.6 3.2 298.3 10.8 5.5 540.1
ItemDay Meal B6 (mg) B12 (mcg) C (mg) D (mcg) E-Toco
(mg)Fola (mcg)
Day 3 Breakfast english muffin, plain (USDA: 22.8
almond butter (USDA) 0 0 0 0 7.7 17
banana, fresh, large, 8" to 8 0.5 0 11.8 0 0.1 27.2
milk, 1%, with vitamins A & D 0.1 1.1 0 2.9 0 12.2
water, municipal tap (USDA) 0 0 0 0 0 0
Lunch crackers, saltine, original, Zesta 0
pears, fresh (USDA) 0 0 7.6 0 0.2 12.5
sandwich, turkey breast, with 12 2
soup, homestyle chicken noodle 6
water, Dasani, non-carbonated
Dinner beef steak, top sirloin, broiled, 0.9 3 0 0.8 13.6
mashed potatoes, prepared from 0.2 0.1 6.3 0.2 0.1 8.4
asparagus, fresh (USDA) 0.1 0 7.5 0 1.5 69.7
water, municipal tap (USDA) (2) 0 0 0 0 0 0
Snack cashews, salted, dry roasted, 0.1 0 0 0 0.3 23.6
water, municipal tap (USDA) (3) 0 0 0 0 0 0
Day Total 2 4.2 51.3 5.1 10.8 206.9
Average Day Total 2 3 155 6.5 7.6 353
ItemDay Meal Calc (mg) Iron (mg) Magn (mg) Phos (mg) Potas
(mg) Selen (mcg)
Day 1 Breakfast orange, fresh, medium, 2 5/8" 52.4 0.1 13.1
18.3 237.1 0.6
egg, hard boiled, large (USDA) 50 1.2 10 172 126 30.8
coffee, brewed, with tap water 4.7 0 7.1 7.1 116 0
sugar, white, granulated (USDA) 0.1 0 0 0 0.2 0.1
bread, whole grain artisan,
water, municipal tap (USDA) 14.2 0 4.7 0 4.7 0
milk, 1%, with vitamins A & D 152.5 0 13.4 115.9 183 4
Lunch chicken breast, chunk, canned,
bread, whole grain artisan,
soup, vegetable, canned, 50.4 1.7 63 113.4 1091.2 10.1
spinach, fresh, leaf (USDA) 59.4 1.6 47.4 29.4 334.8 0.6
tomatoes, fresh, year round 4 0.1 4.4 9.6 94.8 0
mustard, yellow, prepared 3.2 0.1 2.4 5.4 7.6 1.7
water, non-carbonated (USDA: 14.2 0 0
Dinner chicken breast filet, flame 34.7 1.2
peas, green, boiled, drained 21.6 1.2 31.2 93.6 216.8 1.5
potato skin, baked (USDA) 19.7 4.1 24.9 58.6 332.3 0.4
wine, red (USDA) 12.9 0.7 19.4 37.2 205.4 0.3
water, municipal tap (USDA) (2) 7.1 0 2.4 0 2.4 0
Snack cookie, milk chocolate, Milano 0 1
water, municipal tap (USDA) (3) 7.1 0 2.4 0 2.4 0
Day Total 508.3 13.1 245.8 660.5 2954.7 50.1
Day 2 Breakfast muffin, toaster, wheat bran, 13.3 1 7.1 96.6
60.2 6.9
sausage, beef & chicken, hot 6.6 0.5 7.7 74.8 130.4 9.7
mango, fresh (USDA) 37 0.5 33.6 47 564.5 2
ItemDay Meal Calc (mg) Iron (mg) Magn (mg) Phos (mg) Potas
(mg) Selen (mcg)
Day 2 Breakfast milk, 1%, with vitamins A & D 101.7 0 8.9
77.3 122 2.7
coffee, brewed, with tap water 4.7 0 7.1 7.1 116 0
water, municipal tap (USDA) 14.2 0 4.7 0 4.7 0
Lunch chicken breast, oven roasted, 9.4 0.5 14 93.6 104.5 11.8
salad mix, classic iceberg (Dole) 20 0.4 0
tomatoes, cherry, red, fresh, 8.5 0.2 9.4 20.4 201.4 0
onion, red, fresh, rings (USDA) 8.3 0.1 3.6 10.4 52.6 0.2
croutons, seasoned, cubes 2.4 0.1 1 3.5 4.5 0.7
salad dressing, italian (USDA) 1.3 0 0.5 1.5 8.2 0.2
water, Poland Spring (USDA: 4.7 0 4.7 0 0 0
Dinner halibut, atlantic, baked, fillet 15.3 0.3 47.6 488.2 898.1
94.2
lemon juice, fresh (USDA) 0.3 0 0.3 0.4 5.2 0
broccoli florets, fresh (USDA) 68.2 1.2 35.5 93.7 461.5 4.2
rice mix, long grain & wild, 119.4 5.4 417.8
wine, white, pinot grigio (USDA)
water, municipal tap (USDA) (2) 7.1 0 2.4 0 2.4 0
Snack banana, fresh, large, 8" to 8 6.8 0.4 36.7 29.9 486.9 1.4
water, municipal tap (USDA) (3) 7.1 0 2.4 0 2.4 0
Day Total 456.1 10.6 227.3 1044.4 3643.2 134.1
Day 3 Breakfast english muffin, plain (USDA: 102.6 0.8
almond butter (USDA) 111 1.1 89.3 162.6 239.4 0.8
banana, fresh, large, 8" to 8 6.8 0.4 36.7 29.9 486.9 1.4
milk, 1%, with vitamins A & D 305 0.1 26.8 231.8 366 8
water, municipal tap (USDA) 14.2 0 4.7 0 4.7 0
Lunch crackers, saltine, original, Zesta 0 0.7 12
pears, fresh (USDA) 16 0.3 12.5 21.4 206.5 0.2
sandwich, turkey breast, with 300 2.7
soup, homestyle chicken noodle 20 0.7
water, Dasani, non-carbonated 0 0 0 0 0
Dinner beef steak, top sirloin, broiled, 30.6 3.1 37.4 341.9
556.2 49.3
mashed potatoes, prepared from 25.2 0.3 18.9 47.2 298.2 0.8
asparagus, fresh (USDA) 32.2 2.9 18.8 69.7 270.7 3.1
water, municipal tap (USDA) (2) 14.2 0 4.7 0 4.7 0
Snack cashews, salted, dry roasted, 15.4 2 89 167.8 193.5 4
water, municipal tap (USDA) (3) 7.1 0 2.4 0 2.4 0
Day Total 1000.3 15 341.2 1072.3 2641.1 67.6
Average Day Total 654.9 12.9 271.5 925.7 3079.7 83.9
ItemDay Meal Sod (mg) Zinc (mg) Omega3 (g) Omega6 (g) Alc
(g) Caff (mg)
Day 1 Breakfast orange, fresh, medium, 2 5/8" 0 0.1 0 0 0 0
egg, hard boiled, large (USDA) 124 1 0.1 1.3 0 0
coffee, brewed, with tap water 4.7 0 0 0 0 94.7
sugar, white, granulated (USDA) 0.1 0 0 0 0 0
bread, whole grain artisan, 0 0 0
water, municipal tap (USDA) 14.2 0 0 0 0 0
ItemDay Meal Sod (mg) Zinc (mg) Omega3 (g) Omega6 (g) Alc
(g) Caff (mg)
Day 1 Breakfast milk, 1%, with vitamins A & D 53.7 0.5 0 0 0 0
Lunch chicken breast, chunk, canned, 315 0 0
bread, whole grain artisan, 0 0 0
soup, vegetable, canned, 970.2 1 0 0.9 0 0
spinach, fresh, leaf (USDA) 47.4 0.3 0.1 0 0 0
tomatoes, fresh, year round 2 0.1 0 0 0 0
mustard, yellow, prepared 55.2 0 0 0 0 0
water, non-carbonated (USDA: 4.7 0 0 0 0
Dinner chicken breast filet, flame 1215 0 0
peas, green, boiled, drained 2.4 1 0 0.1 0 0
potato skin, baked (USDA) 12.2 0.3 0 0 0 0
wine, red (USDA) 6.5 0.2 0 0 17.1 0
water, municipal tap (USDA) (2) 7.1 0 0 0 0 0
Snack cookie, milk chocolate, Milano 40 0
water, municipal tap (USDA) (3) 7.1 0 0 0 0 0
Day Total 2881.5 4.5 0.2 2.4 17.1 94.7
Day 2 Breakfast muffin, toaster, wheat bran, 179.2 0.1 0.2 1.5 0
0
sausage, beef & chicken, hot 847 1.1 0 0
mango, fresh (USDA) 3.4 0.3 0.2 0.1 0 0
milk, 1%, with vitamins A & D 35.8 0.3 0 0 0 0
coffee, brewed, with tap water 4.7 0 0 0 0 94.7
water, municipal tap (USDA) 14.2 0 0 0 0 0
Lunch chicken breast, oven roasted, 1694.9 0.4 0 0.1 0 0
salad mix, classic iceberg (Dole) 15 0 0 0 0
tomatoes, cherry, red, fresh, 4.2 0.1 0 0 0 0
onion, red, fresh, rings (USDA) 1.4 0.1 0 0 0 0
croutons, seasoned, cubes 27.2 0 0 0.1 0 0
salad dressing, italian (USDA) 97.3 0 0.1 0.9 0 0
water, Poland Spring (USDA: 4.7 0 0 0 0 0
Dinner halibut, atlantic, baked, fillet 139.5 0.7 0.5 0.1 0 0
lemon juice, fresh (USDA) 0.1 0 0 0 0 0
broccoli florets, fresh (USDA) 38.3 0.6 0.2 0 0 0
rice mix, long grain & wild, 1332.9 0 0 0 0
wine, white, pinot grigio (USDA) 0 0 17.3 0
water, municipal tap (USDA) (2) 7.1 0 0 0 0 0
Snack banana, fresh, large, 8" to 8 1.4 0.2 0 0.1 0 0
water, municipal tap (USDA) (3) 7.1 0 0 0 0 0
Day Total 4455.4 4 1.2 2.8 17.3 94.7
Day 3 Breakfast english muffin, plain (USDA: 196.6 0 0.5 0 0
almond butter (USDA) 72.6 1 0 4.4 0 0
banana, fresh, large, 8" to 8 1.4 0.2 0 0.1 0 0
milk, 1%, with vitamins A & D 107.4 1 0 0.1 0 0
water, municipal tap (USDA) 14.2 0 0 0 0 0
Lunch crackers, saltine, original, Zesta 240 0 0
ItemDay Meal Sod (mg) Zinc (mg) Omega3 (g) Omega6 (g) Alc
(g) Caff (mg)
Day 3 Lunch pears, fresh (USDA) 1.8 0.2 0 0.1 0 0
sandwich, turkey breast, with 760 0 0
soup, homestyle chicken noodle 720 0 0
water, Dasani, non-carbonated 0 0 0 0 0 0
Dinner beef steak, top sirloin, broiled, 91.9 8.2 0.2 0.7 0 0
mashed potatoes, prepared from 332.8 0.3 0 0.2 0 0
asparagus, fresh (USDA) 2.7 0.7 0 0 0 0
water, municipal tap (USDA) (2) 14.2 0 0 0 0 0
Snack cashews, salted, dry roasted, 219.2 1.9 0 2.6 0 0
water, municipal tap (USDA) (3) 7.1 0 0 0 0 0
Day Total 2781.9 13.5 0.4 8.6 0 0
Average Day Total 3372.9 7.4 0.6 4.6 11.5 63.1
ItemDay Meal MPFruit
(cup)
MPDairy
(cup)
MPGrain (oz
eq)
MPVeg
(cup)
MPProt (oz
eq)
XxFruit
Day 1 Breakfast orange, fresh, medium, 2 5/8" 0.7 0 0 0 0 1
egg, hard boiled, large (USDA) 0 0 0 0 2 0
coffee, brewed, with tap water 0 0 0 0 0 0
sugar, white, granulated (USDA) 0 0 0 0 0 0
bread, whole grain artisan, 0 0 0 0 0 0
water, municipal tap (USDA) 0 0 0 0 0 0
milk, 1%, with vitamins A & D 0 0.5 0 0 0 0
Lunch chicken breast, chunk, canned, 0 0 0 0 1.9 0
bread, whole grain artisan, 0 0 0 0 0 0
soup, vegetable, canned, 0 0 0 2 0 0
spinach, fresh, leaf (USDA) 0 0 0 1 0 0
tomatoes, fresh, year round 0 0 0 0.2 0 0
mustard, yellow, prepared 0 0 0 0 0 0
water, non-carbonated (USDA: 0 0 0 0 0 0
Dinner chicken breast filet, flame 0 0 0 0 6 0
peas, green, boiled, drained 0 0 0 0.5 0 0
potato skin, baked (USDA) 0 0 0 0.4 0 0
wine, red (USDA) 0 0 0 0 0 0
water, municipal tap (USDA) (2) 0 0 0 0 0 0
Snack cookie, milk chocolate, Milano 0 0 0 0 0 0
water, municipal tap (USDA) (3) 0 0 0 0 0 0
Day Total 0.7 0.5 0 4.1 10 1
Day 2 Breakfast muffin, toaster, wheat bran, 0 0 0 0 0 0
sausage, beef & chicken, hot 0 0 0 0 1.9 0
mango, fresh (USDA) 2 0 0 0 0 3.4
milk, 1%, with vitamins A & D 0 0.3 0 0 0 0
coffee, brewed, with tap water 0 0 0 0 0 0
water, municipal tap (USDA) 0 0 0 0 0 0
Lunch chicken breast, oven roasted, 0 0 0 0 5.5 0
salad mix, classic iceberg (Dole) 0 0 0 1.5 0 0
tomatoes, cherry, red, fresh, 0 0 0 0.4 0 0
ItemDay Meal MPFruit
(cup)
MPDairy
(cup)
MPGrain (oz
eq)
MPVeg
(cup)
MPProt (oz
eq)
XxFruit
Day 2 Lunch onion, red, fresh, rings (USDA) 0 0 0 0.2 0 0
croutons, seasoned, cubes 0 0 0.1 0 0 0
salad dressing, italian (USDA) 0 0 0 0 0 0
water, Poland Spring (USDA: 0 0 0 0 0 0
Dinner halibut, atlantic, baked, fillet 0 0 0 0 6 0
lemon juice, fresh (USDA) 0 0 0 0 0 0
broccoli florets, fresh (USDA) 0 0 0 2 0 0
rice mix, long grain & wild, 0 0 5.2 0 0 0
wine, white, pinot grigio (USDA) 0 0 0 0 0 0
water, municipal tap (USDA) (2) 0 0 0 0 0 0
Snack banana, fresh, large, 8" to 8 0.9 0 0 0 0 2.1
water, municipal tap (USDA) (3) 0 0 0 0 0 0
Day Total 3 0.3 5.3 4.2 13.4 5.4
Day 3 Breakfast english muffin, plain (USDA: 0 0 1.6 0 0 0
almond butter (USDA) 0 0 0 0 2 0
banana, fresh, large, 8" to 8 0.9 0 0 0 0 2.1
milk, 1%, with vitamins A & D 0 1 0 0 0 0
water, municipal tap (USDA) 0 0 0 0 0 0
Lunch crackers, saltine, original, Zesta 0 0 0.9 0 0 0
pears, fresh (USDA) 1.1 0 0 0 0 1.8
sandwich, turkey breast, with 0 0 2.8 0 1.4 0
soup, homestyle chicken noodle 0 0 0.8 0 0.8 0
water, Dasani, non-carbonated 0 0 0 0 0 0
Dinner beef steak, top sirloin, broiled, 0 0 0 0 6 0
mashed potatoes, prepared from 0 0 0 0.5 0 0
asparagus, fresh (USDA) 0 0 0 1 0 0
water, municipal tap (USDA) (2) 0 0 0 0 0 0
Snack cashews, salted, dry roasted, 0 0 0 0 2.4 0
water, municipal tap (USDA) (3) 0 0 0 0 0 0
Day Total 2 1 6 1.5 12.7 3.9
Average Day Total 1.9 0.6 3.8 3.2 12 3.4
ItemDay Meal XxOCarb XxStarch XxVeg XxFat XxAlc
XxNoFtMlk
Day 1 Breakfast orange, fresh, medium, 2 5/8" 0 0 0 0 0 0
egg, hard boiled, large (USDA) 0 0 0 1.4 0 0
coffee, brewed, with tap water 0 0 0 0 0 0
sugar, white, granulated (USDA) 0.8 0 0 0 0 0
bread, whole grain artisan, 8.4 0 0 1.8 0 0
water, municipal tap (USDA) 0 0 0 0 0 0
milk, 1%, with vitamins A & D 0 0 0 0 0 0.5
Lunch chicken breast, chunk, canned, 0 0 0 0 0 0
bread, whole grain artisan, 8.4 0 0 1.8 0 0
soup, vegetable, canned, 0 0 6.1 0.4 0 0
spinach, fresh, leaf (USDA) 0 0 0.4 0 0 0
tomatoes, fresh, year round 0 0 0.3 0 0 0
ItemDay Meal XxOCarb XxStarch XxVeg XxFat XxAlc
XxNoFtMlk
Day 1 Lunch mustard, yellow, prepared 0 0 0 0 0 0
water, non-carbonated (USDA: 0 0 0 0 0 0
Dinner chicken breast filet, flame 0 0 0 0 0 0
peas, green, boiled, drained 0 0 2.5 0 0 0
potato skin, baked (USDA) 0 1.8 0 0 0 0
wine, red (USDA) 0.3 0 0 0 1.2 0
water, municipal tap (USDA) (2) 0 0 0 0 0 0
Snack cookie, milk chocolate, Milano 0.9 0 0 1.2 0 0
water, municipal tap (USDA) (3) 0 0 0 0 0 0
Day Total 18.8 1.8 9.3 6.7 1.2 0.5
Day 2 Breakfast muffin, toaster, wheat bran, 1.2 0 0 0.6 0 0
sausage, beef & chicken, hot 0 0 0 1.6 0 0
mango, fresh (USDA) 0 0 0 0 0 0
milk, 1%, with vitamins A & D 0 0 0 0 0 0.3
coffee, brewed, with tap water 0 0 0 0 0 0
water, municipal tap (USDA) 0 0 0 0 0 0
Lunch chicken breast, oven roasted, 0 0 0 0 0 0
salad mix, classic iceberg (Dole) 0 0 0.8 0 0 0
tomatoes, cherry, red, fresh, 0 0 0.6 0 0 0
onion, red, fresh, rings (USDA) 0 0 0.7 0 0 0
croutons, seasoned, cubes 0 0.1 0 0.1 0 0
salad dressing, italian (USDA) 0 0 0 0.4 0 0
water, Poland Spring (USDA: 0 0 0 0 0 0
Dinner halibut, atlantic, baked, fillet 0 0 0 0 0 0
lemon juice, fresh (USDA) 0 0 0 0 0 0
broccoli florets, fresh (USDA) 0 0 1.4 0 0 0
rice mix, long grain & wild, 0 5.8 0 0 0 0
wine, white, pinot grigio (USDA) 0.2 0 0 0 1.2 0
water, municipal tap (USDA) (2) 0 0 0 0 0 0
Snack banana, fresh, large, 8" to 8 0 0 0 0 0 0
water, municipal tap (USDA) (3) 0 0 0 0 0 0
Day Total 1.5 5.9 3.5 2.7 1.2 0.3
Day 3 Breakfast english muffin, plain (USDA: 0 1.7 0 0 0 0
almond butter (USDA) 0 0 0 3.2 0 0
banana, fresh, large, 8" to 8 0 0 0 0 0 0
milk, 1%, with vitamins A & D 0 0 0 0.1 0 1
water, municipal tap (USDA) 0 0 0 0 0 0
Lunch crackers, saltine, original, Zesta 0 1 0 0.2 0 0
pears, fresh (USDA) 0 0 0 0 0 0
sandwich, turkey breast, with 0 3.1 0 0.2 0 0
soup, homestyle chicken noodle 0 0.9 0 0.3 0 0
water, Dasani, non-carbonated 0 0 0 0 0 0
Dinner beef steak, top sirloin, broiled, 0 0 0 2.8 0 0
mashed potatoes, prepared from 0 1.2 0 0.6 0 0
asparagus, fresh (USDA) 0 0 1 0 0 0
ItemDay Meal XxOCarb XxStarch XxVeg XxFat XxAlc
XxNoFtMlk
Day 3 Dinner water, municipal tap (USDA) (2) 0 0 0 0 0 0
Snack cashews, salted, dry roasted, 0 0 0 2.9 0 0
water, municipal tap (USDA) (3) 0 0 0 0 0 0
Day Total 0 7.9 1 10.2 0 1
Average Day Total 6.8 5.2 4.6 6.5 0.8 0.6
ItemDay Meal XxLnMeat
Day 1 Breakfast orange, fresh, medium, 2 5/8" 0
egg, hard boiled, large (USDA) 1.8
coffee, brewed, with tap water 0
sugar, white, granulated (USDA) 0
bread, whole grain artisan, 0
water, municipal tap (USDA) 0
milk, 1%, with vitamins A & D 0
Lunch chicken breast, chunk, canned, 1.9
bread, whole grain artisan, 0
soup, vegetable, canned, 0
spinach, fresh, leaf (USDA) 0
tomatoes, fresh, year round 0
mustard, yellow, prepared 0
water, non-carbonated (USDA: 0
Dinner chicken breast filet, flame 4.2
peas, green, boiled, drained 0
potato skin, baked (USDA) 0
wine, red (USDA) 0
water, municipal tap (USDA) (2) 0
Snack cookie, milk chocolate, Milano 0
water, municipal tap (USDA) (3) 0
Day Total 8
Day 2 Breakfast muffin, toaster, wheat bran, 0
sausage, beef & chicken, hot 1.4
mango, fresh (USDA) 0
milk, 1%, with vitamins A & D 0
coffee, brewed, with tap water 0
water, municipal tap (USDA) 0
Lunch chicken breast, oven roasted, 3.7
salad mix, classic iceberg (Dole) 0
tomatoes, cherry, red, fresh, 0
onion, red, fresh, rings (USDA) 0
croutons, seasoned, cubes 0
salad dressing, italian (USDA) 0
water, Poland Spring (USDA: 0
Dinner halibut, atlantic, baked, fillet 5.5
lemon juice, fresh (USDA) 0
broccoli florets, fresh (USDA) 0
ItemDay Meal XxLnMeat
Day 2 Dinner rice mix, long grain & wild, 0
wine, white, pinot grigio (USDA) 0
water, municipal tap (USDA) (2) 0
Snack banana, fresh, large, 8" to 8 0
water, municipal tap (USDA) (3) 0
Day Total 10.6
Day 3 Breakfast english muffin, plain (USDA: 0
almond butter (USDA) 1
banana, fresh, large, 8" to 8 0
milk, 1%, with vitamins A & D 0
water, municipal tap (USDA) 0
Lunch crackers, saltine, original, Zesta 0
pears, fresh (USDA) 0
sandwich, turkey breast, with 1.3
soup, homestyle chicken noodle 0.7
water, Dasani, non-carbonated 0
Dinner beef steak, top sirloin, broiled, 6.5
mashed potatoes, prepared from 0
asparagus, fresh (USDA) 0
water, municipal tap (USDA) (2) 0
Snack cashews, salted, dry roasted, 0.8
water, municipal tap (USDA) (3) 0
Day Total 10.2
Average Day Total 9.6
7/14/19 6:24 PM Page 15 of 15
Actual Intakes -vs- Recommended Intakes
Profile Info
Personal: Eduardo Delgado Male 25 yrs 5 ft 10 in
230 lb
Day(s): Day 1 (Breakfast, Lunch, Dinner, Snack), Day 2
(Breakfast, Lunch, Dinner, Snack), Day 3 (Breakfast,
Lunch, Dinner, Snack)
Activity Level: Sedentary Strive for an Active activity level.
Weight Change: None Best not to exceed 2 lbs per week.
BMI: 33.0 Normal is 18.5 to 25. Clinically Obese is 30 or
higher.
The actual intakes -vs- recommended intakes report displays the
amount of nutrients consumed as they
compare to your dietary intake recommendations.
Nutrient Actual Rec. Percent
Basic Components
Calories 1,980. 3,012.5 66 %
Calories from Fat 432.42 843.50 51 % 20-35% of Calories
(adults 19+ yrs)*
Calories from SatFat 120.35 271.13 44 % Less than 10% of
Calories+
Protein (g) 107.89 83.46 129 % 10-35% of Calories (adults 19+
yrs)*~
Carbohydrates (g) 276.08 414.22 67 % 45-65% of Calories
(adults 19+ yrs)*
Total Sugars (g) 105.95
Added Sugar (g)++ 4.19 Less than 10% of Calories+
Dietary Fiber (g) 29.10 42.18 69 %
Soluble Fiber (g) 3.07
InSoluble Fiber (g) 6.48
Fat (g) 48.05 93.72 51 % 20-35% of Calories (adults 19+ yrs)*
Saturated Fat (g) 13.37 30.13 44 % Less than 10% of Calories+
Trans Fat (g) 0.12 Minimize+
Mono Fat (g) 15.64 33.47 47 %
Poly Fat (g) 5.63 30.13 19 %
Cholesterol (mg) 314.40 300.00 105 % Limit+
Water (g) 2,577. 3,700.0 70 %
Vitamins
Vitamin A - RAE (mcg) 572.74 900.00 64 %
Beta-carotene (mcg) 3,166.
Vitamin B1 - Thiamin (mg) 0.91 1.20 76 %
Vitamin B2 - Riboflavin 1.26 1.30 97 %
Vitamin B3 - Niacin (mg) 19.84 16.00 124 %
Vitamin B6 (mg) 1.99 1.30 153 % Do not exceed 100 mg*
Vitamin B12 (mcg) 3.03 2.40 126 % Over 50 should take a
supplement or eat fortified foods*
Vitamin C (mg) 154.95 90.00 172 %
Vitamin D - mcg (mcg) 6.54 15.00 44 % 15 to no more than 100
mcg*
Vitamin E - a-Toco (mg) 7.57 15.00 50 %
Folate (mcg) 352.99 400.00 88 % Women of child-bearing age
should take a supplement or
fortified foods with 400 mcg*
Minerals
Calcium (mg) 654.91 1,000.0 65 % Do not exceed 2500 mg*
Iron (mg) 12.90 8.00 161 % Do not exceed 45 mg*
Magnesium (mg) 271.45 400.00 68 % Do not exceed 350 mg by
supplement*
Phosphorus (mg) 925.72 700.00 132 % Do not exceed 4000 mg*
Potassium (mg) 3,079. 4,700.0 66 % At least 4700 mg per day*
Selenium (mcg) 83.94
Sodium (mg) 3,372. 2,300.0 147 % Less than 2300 mg per day*
- less than 1500 mg for some
people+
Zinc (mg) 7.36 11.00 67 % Do not exceed 40 mg*
Other
Omega-3 (g) 0.59
Omega-6 (g) 4.64
Alcohol (g) 11.48 Do not exceed 2 standard drinks for men and
1 standard
drink for women+
Caffeine (mg) 63.15 Up to 400 mg (three to five 8-oz cups of
coffee per day)+
~ Protein recommendations have not been adjusted to take into
account endurance/strength athletes who fall
into the active and very active categories, but do take into
account pregnancy and lactation.
++The nutrient content of the items in the MDA food database
depend on manufacturers' reporting accurate
information. Since many do not have data yet on added sugars,
this number may not be an accurate reflection
of added sugar intake.
* Dietary Reference Intakes
+ 2015 Dietary Guidelines for Americans
7/14/19 6:25 PM Page 2 of 2
Daily Food Record
Name (print):__Eduardo Delgado______________
Day/Date of Intake: June 27 thru June 29
Male__x____ Female ______
Age _25______
Meal
Date
Time
Of Day
Food Item
Amount
Description
(Brand or restaurant)
How Prepared
(if applicable)
Breakfast
6/27
7:00 am
Naval Orange
1
Low-fat milk
½ a cup
A-2
eggs
2
Hard Boiled
Black coffee
1 cup
Sugar
1 tbs
Whole grain bread
2
Ezekiel 4:9 Sesame
toasted
Water
16 ounce
6/28
7:30 a.m.
Bran muffin
1 medium
Chicken sausage
1 serving
Jim Dean
Skillet
mango
1 small
Low-fat milk
1/3 cup
Black coffee
1 cup
Water
16 ounce
6/29
8:30 a.m.
Whole Wheat English Muffin
1
Thomas
Almond Butter
2 tbsp
Justin
Banana
1
Low-fat milk
8 ounces
A-2
Water
16 ounce
Lunch
6/27
12:30 p.m.
A chicken sandwich with
Chicken breast meat
3 ounces
Valley Fresh
canned
Low-sodium vegetable soup
1 cup
Healthy Choice
Spinach leaves
¼ cup
Raw
tomato
2 slices
Raw
mustard
Light spread
Whole grain bread
2 slices
Ezekiel 4:9 Sesame
Water
16 ounce
6/28
1:00 p.m.
Chicken breast
5.5 ounce
Baked
Salad mix
1.5 cup
Dole
Tossed
Cherry tomatoes
5
red onions
6 slicd
croutons
8-10 small
Italian Dressing
2 tsp
Newman
water
16 ounce
6/29
12:40 p.m.
chicken noodle soup
1 cup
Subway
Saltine crackers
6
Zesta
Turkey Sub whole wheat
6”
Subway
Water
16 ounce
Pear
1 medium
Dinner
Dinner
6/27
7:00 p.m.
Chicken breast
6 ounce
Baked
Peas
1/2 cup
Steamed
Potatoes
1 medium
Baked
Wine Red
5.5 ounce
Josh
Water
8 ounces
6/28
7:30 p.m
Halibut with lemon
6 ounce
Baked
Broccoli Florets
2 cups
Wild rice
4 ounces
Uncle Ben
White Wine
5.5 ounces
Robert Mondavi
Water
8 ounces
6/29
7:15 p.m.
Sirloin steak
6 ounce
Grilled
red potatoes
½ a cup
Mashed
Asparagus
1 cup
Baked
Water
16 ounces
Snacks
6/27
10:00 p.m.
Milano Cookie
2pk
Pepperidge Farm
Water
8 ounce
6/28
3:10 p.m.
Banana
1
Water
8 ounce
6/29
8:10 p.m.
Cashews
10-15
Planters
Water
8 ounce
· Record food items as completely as possible, listing separate
ingredients when indicated (e.g., don’t just write “sandwich”,
but include type of bread, filling, vegetables added, sauces and
condiments).
· Don’t forget beverages, including alcoholic beverages, sodas,
and water.
· Estimate the amounts or serving size you consume as closely
as possible in units, such as cups, ounces, teaspoons, and
teaspoons. (NOTE: “one serving”, “one bowl”, or “one piece”
are not acceptable units as they are subjective measures and
don’t relay quantifiable amounts.) You may want to measure
foods to obtain a more accurate estimate of quantity.
· When indicated, include preparation method or other details
that may help describe the food, for example: indicate whether a
chicken breast is baked, grilled, breaded, fried, etc. or whether
vegetables are raw, steamed, “Southern style”, sautéed, fried,
etc.
What Are the Key Principles of Healthy Eating? 41
Healthy Eating Means Consuming a Variety of Foods
Choosing a variety of foods improves the quality of the diet
because the more var-
ied the food choices, the better the chance of consuming
adequate amounts of all
the essential nutrients.2 Even within one food group, the
nutrient composition of
foods can vary dramatically. For example, while broccoli is a
good source of folate,
it has less than half the vitamin A of a carrot. Similarly, if the
only fruit you eat is
bananas, your diet would include an excellent source of
potassium, but could be low
in vitamin C. Because no single food or food group contains
everything you need to
be healthy, you should choose a variety of foods from within
each food group and
among food groups each day. This is the basic principle of the
Fruits & Veggies—More
Matters campaign developed by the Produce for Better Health
Foundation and the
Centers for Disease Control and Prevention.3 This campaign
promotes eating a vari-
ety of colorful fruits and vegetables—which are rich in
vitamins, minerals, fiber, and
phytochemicals—each day to help reduce the risk of cancer and
heart disease and
slow the effects of aging.
Healthy Eating Means Moderate Intake of All Foods
According to many registered dietitian nutritionists (RDNs),
“there are no good or bad
foods, just good or bad habits.” What they mean is that all
foods—even less nutritious
foods—can be part of a healthy diet, as long as they are
consumed in moderation. Foods
such as sweets and fried or packaged snack foods should be
eaten only in small amounts
to avoid consuming too much sugar and saturated fat, as well as
too many kilocalories.
Finally, these foods can displace more nutritious choices,
resulting in a diet that lacks
essential nutrients. Even some healthy foods, such as nutrient-
dense nuts, can be high
in kilocalories and should be consumed in moderation. Healthy
eating doesn’t mean you
can’t enjoy your favorite foods. It simply means eating those
foods in moderation by lim-
iting the portion size and number of servings you eat.
Many people overestimate the appropriate portion sizes of
foods. An entire body of
research is devoted to studying factors that affect how much we
put on our plates. The
important point is that, in general, we tend to consume portions
larger than necessary
to meet our kilocalorie needs. See the Health Connection on
pages 65–67 for examples
of visuals you can use to estimate portion sizes. For suggestions
on eating a balanced,
varied, and moderate diet, see the Table Tips.
Healthy Eating Includes Nutrient-Dense Foods
Healthy eating also means choosing foods that are nutrient
dense. Nutrient-dense foods
are high in nutrients, such as vitamins and minerals, but low in
energy (kilocalories), pro-
viding more nutrients per kilocalorie (and in each bite) than less
nutrient-dense foods.4
Fresh fruits and vegetables, for example, are nutrient dense
because they are high in
B vitamins, vitamin C, and minerals such as calcium and
magnesium, as well as dietary
fiber, while usually providing fewer than 60 kilocalories per
serving.
Nutrient-dense foods are also low in saturated fat and added
sugars. To illustrate
this concept, compare the nutrient density of two versions of the
same food: a baked
potato and potato chips (Figure 2.1). Although a medium baked
potato and one ounce
of potato chips have about the same number of kilocalories, the
baked potato provides
much higher amounts of vitamins and minerals than the deep-
fried chips.
Though many foods, such as vegetables, are clearly nutrient
dense, and other foods,
such as candy, are clearly not, some foods do not fit neatly into
these two categories.
Items such as dried fruits, nuts, peanut butter, and avocados are
higher in kilocalories,
but they are also excellent sources of important nutrients,
including polyunsaturated
fatty acids, calcium, and iron. Other foods, such as whole milk
or yogurt, are higher
portion Quantity of a food usually eaten at
one sitting.
Choosing a variety of nutrient-dense foods
you enjoy is a key to eating a healthy diet.
TABLE TIPS
Tips for a Balanced, Varied,
and Moderate Diet
Keep healthy snacks such as whole-
grain crackers in your dorm room and
combine them with protein-rich peanut
butter or low-fat yogurt.
Pop a snack-pack size of light micro-
wave popcorn for a portion-controlled
whole-grain snack while you study.
Adopt a multicolor code to guide your
food choices. Add tomato slices and a
low-fat cheese slice to your whole-grain
sandwich and carrots to your tossed
green salad to ensure that your choices
are adequate and varied.
Pack your own snack-sized portions of
dried fruit, trail mix, whole-wheat crack-
ers, baby carrots, or salt-free pretzels
to carry in your backpack. Snack-sized
bags of nuts and seeds are a nutri-
tious way to help you avoid the vending
machine and eat smaller, more moder-
ate portions.
Keep your sweets to no more than
about 100 kilocalories a day.
42 Chapter 2 | Tools for Healthy Eating
in saturated fat and kilocalories than their nonfat or low-fat
counterparts, but still pro-
vide significant amounts of calcium, riboflavin, vitamins A and
D, and protein. Some
foods, such as fruit-flavored yogurt and some fortified cereals,
contain added sugars
in addition to several essential nutrients. Do you think these
foods can be considered
nutrient dense?
In all of these scenarios, the answer is yes. Whereas nutrient
dense usually means
high in nutrients and low in energy, foods that are high in
nutrients and high in energy
can also be considered nutrient dense. The key is to be aware of
the extra kilocalories and
make up for them elsewhere in the diet. If you don’t like skim
milk and won’t drink it,
but do enjoy the taste of whole milk, then drinking whole milk
is a more healthy choice
than drinking soda.
Healthy Eating Includes Low-Energy-Dense Foods
In contrast to nutrient density, energy density refers to foods
that are high in energy but
low in weight or volume, such as that potato chip. A serving of
deep-fried chips weighs
much less than a plain baked potato, but is considerably higher
in kilocalories. Therefore,
the chip contains more energy per gram. A big, leafy green
salad, on the other hand, is
large in volume but low in energy density, because of its high
water content.
Most high-fat foods are considered energy dense.5 This is
because fat has
9 kilocalories per gram and is thus 2.25 times more energy
dense than either carbohy-
drates or protein at 4 kilocalories per gram. Individuals who
choose low-energy-dense
foods will generally have diets that are lower in fat and higher
in nutrient content.
Eating a low-energy-dense diet can sometimes be the key to
weight loss. Recent
studies have found that leaner individuals ate more low-energy-
dense foods and fewer
kilocalories, while consuming a greater volume of food,
compared with their obese
counterparts.6 Even modest changes in dietary intake may
promote and help maintain
weight loss7 over time.8 One reason for this may be that eating
higher-volume, lower-
energy foods means larger portions for the same number of
kilocalories. Other reasons
may include improved satiety and appetite control.9 In other
words, low-energy foods
will “fill you up before they fill you out.”
If you are trying to maintain your current weight, or lose
weight, you are probably
on a limited energy budget and need to choose foods that are
nutrient dense and low in
kilocalories. Use the guide in Table 2.1 to help stretch your
energy budget while con-
suming the most nutrient-dense foods.
satiety Feeling of satiation, or “fullness,” after
a meal before hunger sets in again.
▲ Figure 2.1 Which Is the Healthier Way to Enjoy Potatoes?
Whereas one ounce of potato chips and one medium baked
potato have similar kilocalories, their nutrient content is worlds
apart. A baked
potato contains more folate, potassium, and vitamin C, and
fewer fat kilocalories, than its fried counterpart. The baked
potato is therefore
more nutrient dense than potato chips.
* Note: Based on the percentage of the DRI for 19- to -50-year-
old males. All these percentages apply to females in the same
age range, except for vitamin C.
Females have lower vitamin C needs than males, so a baked
potato provides over 20 percent of the DRI of this vitamin for
women.
100
0
20
40
60
80
Pe
rc
en
t D
R
I*
Potato chips, 1 oz
Baked potato, medium
Vitamin CPotassiumFolate
7/3/2019 Appendix 13. Food Sources of Dietary Fiber - 2015-
2020 Dietary Guidelines - health.gov
https://health.gov/dietaryguidelines/2015/guidelines/appendix-
13/ 1/6
Appendix 13. Food Sources of Dietary Fiber
Table A13-1.
Dietary Fiber: Food Sources Ranked by Amounts of Dietary
Fiber and
Energy per Standard Food Portions and per 100 Grams of Foods
Food
Standard
Portion Size
Calories in
Standard Portion
Dietary Fiber in Standard
Portion (g)
Calories per 100
grams
High �ber bran ready-to-eat
cereal
⅓ – ¾ cup 60-81 9.1-14.3 200-260
Navy beans, cooked ½ cup 127 9.6 140
Small white beans, cooked ½ cup 127 9.3 142
Yellow beans, cooked ½ cup 127 9.2 144
Previous Column Next Column
a a a
2015-2020 Dietary Guidelines
https://health.gov/dietaryguidelines/2015/guidelines/
7/3/2019 Appendix 13. Food Sources of Dietary Fiber - 2015-
2020 Dietary Guidelines - health.gov
https://health.gov/dietaryguidelines/2015/guidelines/appendix-
13/ 2/6
Food
Standard
Portion Size
Calories in
Standard Portion
Dietary Fiber in Standard
Portion (g)
Calories per 100
grams
Shredded wheat ready-to-eat
cereal (various)
1-1 ¼ cup 155-220 5.0-9.0 321-373
Cranberry (roman) beans,
cooked
½ cup 120 8.9 136
Adzuki beans, cooked ½ cup 147 8.4 128
French beans, cooked ½ cup 114 8.3 129
Split peas, cooked ½ cup 114 8.1 116
Chickpeas, canned ½ cup 176 8.1 139
Lentils, cooked ½ cup 115 7.8 116
Pinto beans, cooked ½ cup 122 7.7 143
Black turtle beans, cooked ½ cup 120 7.7 130
Mung beans, cooked ½ cup 106 7.7 105
Black beans, cooked ½ cup 114 7.5 132
Artichoke, globe or French,
cooked
½ cup 45 7.2 53
Lima beans, cooked ½ cup 108 6.6 115
a a a
7/3/2019 Appendix 13. Food Sources of Dietary Fiber - 2015-
2020 Dietary Guidelines - health.gov
https://health.gov/dietaryguidelines/2015/guidelines/appendix-
13/ 3/6
Food
Standard
Portion Size
Calories in
Standard Portion
Dietary Fiber in Standard
Portion (g)
Calories per 100
grams
Great northern beans, canned ½ cup 149 6.4 114
White beans, canned ½ cup 149 6.3 114
Kidney beans, all types, cooked ½ cup 112 5.7 127
Pigeon peas, cooked ½ cup 102 5.6 121
Cowpeas, cooked ½ cup 99 5.6 116
Wheat bran �akes ready-to-eat
cereal (various)
¾ cup 90-98 4.9-5.5 310-328
Pear, raw 1 medium 101 5.5 57
Pumpkin seeds, whole, roasted 1 ounce 126 5.2 446
Baked beans, canned, plain ½ cup 119 5.2 94
Soybeans, cooked ½ cup 149 5.2 173
Plain rye wafer crackers 2 wafers 73 5.0 334
Avocado ½ cup 120 5.0 160
Broadbeans (fava beans),
cooked
½ cup 94 4.6 110
a a a
7/3/2019 Appendix 13. Food Sources of Dietary Fiber - 2015-
2020 Dietary Guidelines - health.gov
https://health.gov/dietaryguidelines/2015/guidelines/appendix-
13/ 4/6
Food
Standard
Portion Size
Calories in
Standard Portion
Dietary Fiber in Standard
Portion (g)
Calories per 100
grams
Pink beans, cooked ½ cup 126 4.5 149
Apple, with skin 1 medium 95 4.4 52
Green peas, cooked (fresh,
frozen, canned)
½ cup 59-67 3.5-4.4 69-84
Refried beans, canned ½ cup 107 4.4 90
Chia seeds, dried 1 Tbsp 58 4.1 486
Bulgur, cooked ½ cup 76 4.1 83
Mixed vegetables, cooked from
frozen
½ cup 59 4.0 65
Raspberries ½ cup 32 4.0 52
Blackberries ½ cup 31 3.8 43
Collards, cooked ½ cup 32 3.8 33
Soybeans, green, cooked ½ cup 127 3.8 141
Prunes, stewed ½ cup 133 3.8 107
Sweet potato, baked in skin 1 medium 103 3.8 90
a a a
7/3/2019 Appendix 13. Food Sources of Dietary Fiber - 2015-
2020 Dietary Guidelines - health.gov
https://health.gov/dietaryguidelines/2015/guidelines/appendix-
13/ 5/6
Food
Standard
Portion Size
Calories in
Standard Portion
Dietary Fiber in Standard
Portion (g)
Calories per 100
grams
Figs, dried ¼ cup 93 3.7 249
Pumpkin, canned ½ cup 42 3.6 34
Potato, baked, with skin 1 medium 163 3.6 94
Popcorn, air-popped 3 cups 93 3.5 387
Almonds 1 ounce 164 3.5 579
Pears, dried ¼ cup 118 3.4 262
Whole wheat spaghetti, cooked ½ cup 87 3.2 124
Parsnips, cooked ½ cup 55 3.1 71
Sun�ower seed kernels, dry
roasted
1 ounce 165 3.1 582
Orange 1 medium 69 3.1 49
Banana 1 medium 105 3.1 89
Guava 1 fruit 37 3.0 68
Oat bran mu�n 1 small 178 3.0 270
Pearled barley, cooked ½ cup 97 3.0 123
a a a
7/3/2019 Appendix 13. Food Sources of Dietary Fiber - 2015-
2020 Dietary Guidelines - health.gov
https://health.gov/dietaryguidelines/2015/guidelines/appendix-
13/ 6/6
Food
Standard
Portion Size
Calories in
Standard Portion
Dietary Fiber in Standard
Portion (g)
Calories per 100
grams
Winter squash, cooked ½ cup 38 2.9 37
Dates ¼ cup 104 2.9 282
Pistachios, dry roasted 1 ounce 161 2.8 567
Pecans, oil roasted 1 ounce 203 2.7 715
Hazelnuts or �lberts 1 ounce 178 2.7 628
Peanuts, oil roasted 1 ounce 170 2.7 599
Whole wheat paratha bread 1 ounce 92 2.7 326
Quinoa, cooked ½ cup 111 2.6 120
Source: U.S Department of Agriculture, Agricultural Research
Service, Nutrient Data Laboratory. 2014. USDA National
Nutrient Database for Standard Reference, Release 27.
Available at: http://www.ars.usda.gov/nutrientdata
(http://www.ars.usda.gov/nutrientdata).
a a a
a
http://www.ars.usda.gov/nutrientdata
Assignment 5, Diet Analysis
Part B (due July 10):
I have attached the daily food intake for 3 days file
Prepare a summary report to discuss your findings and
recommendations. This summary is based on the
MyDietAnalysis reports that you have already submitted in Part
A. I have attached these reports 4 total which were based on the
3 day food intake entered
Part C (due July 10):
Prepare a detailed report to discuss how your intake compares
to recommended goals. This report is based on the
MyDietAnalysis reports. I have attached these reports 4 total
which were based on the 3 day food intake entered
You will submit Part B, and Part C as separate assignments.
Part B and Part C
This Assignment is essentially, your final project for this
course. Be sure to put time and effort into it.
The Dietary Analysis Assignment is designed to help you assess
your own personal dietary patterns and food choices and make
recommendations for improvement.
This part of the assignment is based on the reports you created
for Part A.
You should spend some time analyzing your diet with My Diet
Analysis tool. Use the data you reported in Part A. Look at the
four reports you submitted in Part A.
Answer the following questions. Your answers should be
thorough and include SPECIFIC insights about your
results. Show that you have spent some time at MyDietAnalysis
website and provide specific details!
1. Use THIS https://www.choosemyplate.gov/nutrition-nutrient-
density page and “All Nutrients Spreadsheet” report to answer
these questions. Look at the "Calories" and "Saturated Fat
Calories" columns to see the details.
a) Define “nutrient density” (review the information on p.41-42
in your textbook).
b) What 2 specific foods that you ate were the most nutrient
dense? Explain WHY you think so.
c) Which 2 foods were the least nutrient dense?
Explain WHY you think so.
2. Using “My Plate” report, list specific foods that you could
change (add, delete, prepare differently, etc.) in order to make
your day’s intake meet the MyPlate requirements in
any 2groups of the recommendations. What groups would you
like to change?
If you have met the recommendations, discuss further whether
you would benefit from changing your diet.
Be VERY SPECIFIC about amounts and foods to add or subtract
in order to meet your MyPlate recommendations. For example,
if you were over the meat/protein recommendation by 3 oz., you
could say something like “I could have 1 less egg for breakfast
and 2 fewer ounces of chicken for dinner in order to bring my
meat group in line.”
Use ChooseMyPlate https://www.choosemyplate.gov/start-
simple-myplate website to find cup and ounce equivalents for
each food group (click on the food groups on the sidebar).
3. How does your actual calo rie intake compare to the
recommended intake? Is it higher, lower, or within 10% of
recommended? Does this concern you? Why or why not?
Explain. Provide specific recommendations if necessary.
Use the "Actual Intakes vs Recommended Intakes" report.
4. Discuss any discrepancies (over or under) in
your MACROnutrients (protein, carbohydrates, fat, saturated
fat, fiber, cholesterol). Are any of these of concern to you?
Why or why not? Explain. Make suggestions on how to change
your diet in order to bring these nutrients to the recommended
levels. Provide specific recommendations if necessary.
Use the "Actual Intakes vs Recommended Intakes" report.
You can use Appendix 13 (attached) of the Dietary Guidelines
for Americans to find foods that are rich in fiber. You can also
use THIShttps://www.mayoclinic.org/healthy-lifestyle/nutrition-
and-healthy-eating/in-depth/high-fiber-foods/art-
20050948 article.
If your report shows too much of some undesirable
macronutrients, track the foods that supplied them. Use "All
Nutrients spreadsheet" report for that.
5. Compare your calorie sources of carbohydrate, protein, fat,
and alcohol with recommended ranges from the Dietary
Reference Intakes (DRIs):
45-65% - Carbohydrates
10-35% - Protein
20-35% - Fat
0 - 5% - Alcohol
Use the "Calorie and Fat Sources" report. If your intake for
protein, carbohydrate, fat and/or alcohol falls outside
recommended ranges, list 1-2 changes that might help bring
your calorie distribution within recommended ranges. Please be
specific. If your intakes are within the ranges, discuss whether
you would want to make any changes and explain why.
6. From your “Actual Intakes vs Recommended Intakes” report,
list 5 MICROnutrients (vitamins and/or minerals) that were not
OK. Pick the micronutrients in which you were the most
significantlyunder OR over the recommendation. State what is
in your report and what is recommended. What are the three
most significant 'deficiencies'? For each micronutrient that you
listed in the 'most deficient', discuss the following:
a) Why this micronutrient is important and why your result may
(or may not) be of concern to you. Provide a reference.
b) Suggest 2specific foods – with portion sizes and the amount
of the nutrient in that portion -- that you could add to (or
subtract from) what you ate during this period to bring that
nutrient intake in line with recommendations. Do this
for each of the 3 most 'deficient' micronutrients.
To find foods that are rich in specific micronutrients, you can
use your textbook
or THIS https://lpi.oregonstate.edu/sites/lpi.oregonstate.edu/file
s/pdf/mic/micronutrients_for_health.pdf website. To check the
amount of the micronutrient in a specific food, use
MyDietAnalysis tool or the USDA websites from Assignment 3.
In MyDietAnalysis, use the Diet Tracker tab to enter the food
and find the amount of the nutrient in a given amount of food.
Be sure to provide a reference to your sources.
When answering Questions 4 and 6, keep in mind that it is
impossible to get exact amounts that are recommended. It is OK
to consume more than the 'recommended' amount of some
nutrients but not the others. Show that you understand this
subject.
Do not analyze your water intake - it is difficult to record water
consumption accurately.
Please write your response to the questions in the numbered
format. Copy the questions into your paper. For Questions 2, 4
and 6, clearly state what your intake was and what is
recommended. Use absolute units (cups, oz, grams, mg, etc.) -
not percents.
In general, state your result from the reports BEFORE analyzing
it and providing recommendations. Keep in mind that your
reviewers do not have access to your actual reports. Make sure
they can understand what you are talking about.
Do not forget to title your paper (create a unique title).
You can use any reliable websites for information. Make sure to
provide a REFERENCE to all sources you used (in-text citation
and the reference list). Use the same APA style as in
Discussions:
- Number your sources in order of their appearance in the text.
- Use the number for in-text citation (in parentheses or
superscript).
- Arrange your reference list in numerical order.
This assignment is worth 80 points you must complete each
criteria stated here:
This criterion is linked to a Learning Outcome 1. Summary
report includes a thorough discussion of 2 specific foods that
were the most nutrient dense and 2 foods that were the least
nutrient dense.
10.0 pts
This criterion is linked to a Learning Outcome 2. Summary
report includes well-thought-out recommendations for
modifying 2 of the 5 food groups to meet the MyPlate
recommendations. Results from the report and the recommended
amounts are clearly stated.
10.0 pts
This criterion is linked to a Learning Outcome 3. Summary
report includes a thorough discussion of the significance of
actual calorie intake vs. recommended intake.
10.0 pts
This criterion is linked to a Learning Outcome 4. Summary
report includes a thorough discussion of the significance of all
MACROnutrient discrepancies. Specific suggestions are
provided. Results from the report and the recommended
amounts are clearly stated.
10.0 pts
This criterion is linked to a Learning Outcome 5. Summary
report includes a thorough discussion of the specific changes
that may bring the calorie distribution within recommended
ranges.
10.0 pts
This criterion is linked to a Learning Outcome 6. Summary
report includes a list of the 5 MICROnutrients that were
over/under recommendations. The importance of THREE most
significant discrepancies are discussed and 2 foods (for each
deficiency, with portion sizes) that would correct the
deficiencies are provided. Reference to a reliable source is
provided. Results from the report and the recommended
amounts are clearly stated.
15.0 pts
This criterion is linked to a Learning Outcome Uses appropriate
English grammar, sentence structure, with few errors in
spelling, punctuation, and capitalization
2.0 pts
This criterion is linked to a Learning Outcome Assignment is in
correct format -- title, appropriate font size, Reference List (if
necessary), etc. Answers are numbered and questions are copied
into the paper. Results from the report and the recommended
amounts are clearly stated.
3.0 pts
This criterion is linked to a Learning Outcome Reviews TWO
submissions by other students, writes thoughtful feedback.
Comments are well organized, critical thought is used. Uses
appropriate English grammar.
10.0 pts
Assignment 5, Diet Analysis
Part B (due July 1
0
):
I have attached
the
daily food intake for 3 days file
Prepare a summary report to discuss your findings and
recommendations. This summary is based on the
MyDietAnalysis reports that you have already submitted in Part
A.
I have attached these reports 4 total
which were based on the 3 day food intake
entered
Part C (due July
10
):
Prepare a detailed report to discuss how your intake compares
to recommended goals. This report is
base
d on the MyDietAnalysis reports.
I have attached these reports 4 total which were based on the 3
day food intake entered
You will submit
Part B, and Part C as separate assignments. Part B an
d Part C
This Assignment is essentially, your final project for this
course. Be sure to put time and effort into it.
The Dietary Analysis Assignment is designed to help you assess
your own personal
dietary patterns and food choic
es and make recommendations for improvement.
This part of the assignment is based on the reports you created
for Part A.
You should spend some time analyzing your diet with My Diet
Analysis tool. Use the
data you reported in Part A. Look at the four re
ports you submitted in Part A.
Answer the following questions. Your answers should be
thorough and
include
SPECIFIC insights
about your results.
Show that you have spent some time at
MyDietAnalysis website and provide specific details!
1.
Use
THIS
https://www.choosemyplate.gov/nutrition
-
nutrient
-
density
page and “
All
Nutrients Spreadsheet
” report to answer these questions. Look at the "Calories" and
"Saturated
Fat Calories" columns to see the details.
a)
Define “nutrient density” (review the information on p.41
-
42 in your textbook).
b)
What
2
specific foods that you ate were the
most
nutrient
dense?
Explain
WHY
you think so.
c)
Which
2
foods were the
least
n
utrient dense?
Explain
WHY
you think so.
2.
Using “
My Plate
” report, list specific foods that you could change (add, delete,
prepare differently, etc.) in order to make your day’s intake
meet the MyPlate
requirements in any
2
groups
of the recommendations. W
hat groups would you like
to change?
If you have met the recommendations, discuss further whether
you would benefit
from changing your diet.
Be VERY SPECIFIC about amounts and foods to add or subtract
in order to meet
your MyPlate recommendations.
Fo
r example
, if you were over the meat/protein
recommendation by 3 oz., you could say something like “I could
have 1 less egg for
breakfast and 2 fewer ounces of chicken for dinner in order to
bring my meat group
Assignment 5, Diet Analysis
Part B (due July 10):
I have attached the daily food intake for 3 days file
Prepare a summary report to discuss your findings and
recommendations. This summary is based on the
MyDietAnalysis reports that you have already submitted in Part
A. I have attached these reports 4 total
which were based on the 3 day food intake entered
Part C (due July 10):
Prepare a detailed report to discuss how your intake compares
to recommended goals. This report is
based on the MyDietAnalysis reports. I have attached these
reports 4 total which were based on the 3
day food intake entered
You will submit Part B, and Part C as separate assignments.
Part B and Part C
This Assignment is essentially, your final project for this
course. Be sure to put time and effort into it.
The Dietary Analysis Assignment is designed to help you assess
your own personal
dietary patterns and food choices and make recommendations
for improvement.
This part of the assignment is based on the reports you created
for Part A.
You should spend some time analyzing your diet with My Diet
Analysis tool. Use the
data you reported in Part A. Look at the four reports you
submitted in Part A.
Answer the following questions. Your answers should be
thorough and
include SPECIFIC insights about your results. Show that you
have spent some time at
MyDietAnalysis website and provide specific details!
1. Use THIS https://www.choosemyplate.gov/nutrition-
nutrient-density page and “All
Nutrients Spreadsheet” report to answer these questions. Look
at the "Calories" and
"Saturated Fat Calories" columns to see the details.
a) Define “nutrient density” (review the information on p.41-42
in your textbook).
b) What 2 specific foods that you ate were the most nutrient
dense? Explain WHY you think so.
c) Which 2 foods were the least nutrient dense? Explain WHY
you think so.
2. Using “My Plate” report, list specific foods that you could
change (add, delete,
prepare differently, etc.) in order to make your day’s intake
meet the MyPlate
requirements in any 2 groups of the recommendations. What
groups would you like
to change?
If you have met the recommendations, discuss further whether
you would benefit
from changing your diet.
Be VERY SPECIFIC about amounts and foods to add or subtract
in order to meet
your MyPlate recommendations. For example, if you were over
the meat/protein
recommendation by 3 oz., you could say something like “I could
have 1 less egg for
breakfast and 2 fewer ounces of chicken for dinner in order to
bring my meat group

More Related Content

Similar to Calorie and Fat SourcesProfile InfoPersonal Eduardo D.docx

Extreme health resolution_secrets weight loss program
Extreme health resolution_secrets weight loss programExtreme health resolution_secrets weight loss program
Extreme health resolution_secrets weight loss programnaeemafzal17
 
Extreme health resolution secrets
Extreme health resolution secretsExtreme health resolution secrets
Extreme health resolution secretsDACARDISVIDEOSjones
 
Extreme health resolution weight loss secrets GetProven
Extreme health resolution weight loss secrets GetProvenExtreme health resolution weight loss secrets GetProven
Extreme health resolution weight loss secrets GetProvenAnujkumar1306
 
Extreme health resolution secrets
Extreme health resolution secretsExtreme health resolution secrets
Extreme health resolution secretsTEchReDiScoVerEd
 
EXTEREME WEIGHT LOSS SECRETES
EXTEREME WEIGHT LOSS SECRETESEXTEREME WEIGHT LOSS SECRETES
EXTEREME WEIGHT LOSS SECRETESakhileshnaithani1
 
Extreme health resolution secrets
Extreme health resolution secretsExtreme health resolution secrets
Extreme health resolution secretsTejasTiwari8
 
Extreme health resolution_secrets (1)
Extreme health resolution_secrets (1)Extreme health resolution_secrets (1)
Extreme health resolution_secrets (1)AnthonyBalongag
 
Extreme Health Resolution_Secrets
Extreme Health Resolution_SecretsExtreme Health Resolution_Secrets
Extreme Health Resolution_SecretsMukeshAggarwal20
 
Weight lose in a 21 days with guarantee
Weight lose in a 21 days with guaranteeWeight lose in a 21 days with guarantee
Weight lose in a 21 days with guaranteeMyYard
 
Extreme health resolutin secrets
Extreme health resolutin secretsExtreme health resolutin secrets
Extreme health resolutin secretsSaidAhmed50
 
Extreme health resolution secrets
Extreme health resolution secretsExtreme health resolution secrets
Extreme health resolution secretsSushil Kumar
 
Extreme health resolution secrets - Weight Loss Programs
Extreme health resolution secrets - Weight Loss ProgramsExtreme health resolution secrets - Weight Loss Programs
Extreme health resolution secrets - Weight Loss ProgramsBiotox Gold
 
Extreme health resolution secrets
Extreme health resolution secretsExtreme health resolution secrets
Extreme health resolution secretsjaison sam
 
Extreme Health Resolution Secrets and Lose Weight magically
Extreme Health Resolution Secrets and Lose Weight magicallyExtreme Health Resolution Secrets and Lose Weight magically
Extreme Health Resolution Secrets and Lose Weight magicallyAnilKumar6683
 
Extreme health resolution secrets
Extreme health resolution secretsExtreme health resolution secrets
Extreme health resolution secretsAbdullah Basalamah
 

Similar to Calorie and Fat SourcesProfile InfoPersonal Eduardo D.docx (17)

Extreme health resolution_secrets weight loss program
Extreme health resolution_secrets weight loss programExtreme health resolution_secrets weight loss program
Extreme health resolution_secrets weight loss program
 
Extreme health resolution secrets
Extreme health resolution secretsExtreme health resolution secrets
Extreme health resolution secrets
 
Extreme health resolution weight loss secrets GetProven
Extreme health resolution weight loss secrets GetProvenExtreme health resolution weight loss secrets GetProven
Extreme health resolution weight loss secrets GetProven
 
Extreme Weight Loss Tips
Extreme Weight Loss TipsExtreme Weight Loss Tips
Extreme Weight Loss Tips
 
Extreme health resolution secrets
Extreme health resolution secretsExtreme health resolution secrets
Extreme health resolution secrets
 
Running head NUTRITION .docx
Running head NUTRITION                                       .docxRunning head NUTRITION                                       .docx
Running head NUTRITION .docx
 
EXTEREME WEIGHT LOSS SECRETES
EXTEREME WEIGHT LOSS SECRETESEXTEREME WEIGHT LOSS SECRETES
EXTEREME WEIGHT LOSS SECRETES
 
Extreme health resolution secrets
Extreme health resolution secretsExtreme health resolution secrets
Extreme health resolution secrets
 
Extreme health resolution_secrets (1)
Extreme health resolution_secrets (1)Extreme health resolution_secrets (1)
Extreme health resolution_secrets (1)
 
Extreme Health Resolution_Secrets
Extreme Health Resolution_SecretsExtreme Health Resolution_Secrets
Extreme Health Resolution_Secrets
 
Weight lose in a 21 days with guarantee
Weight lose in a 21 days with guaranteeWeight lose in a 21 days with guarantee
Weight lose in a 21 days with guarantee
 
Extreme health resolutin secrets
Extreme health resolutin secretsExtreme health resolutin secrets
Extreme health resolutin secrets
 
Extreme health resolution secrets
Extreme health resolution secretsExtreme health resolution secrets
Extreme health resolution secrets
 
Extreme health resolution secrets - Weight Loss Programs
Extreme health resolution secrets - Weight Loss ProgramsExtreme health resolution secrets - Weight Loss Programs
Extreme health resolution secrets - Weight Loss Programs
 
Extreme health resolution secrets
Extreme health resolution secretsExtreme health resolution secrets
Extreme health resolution secrets
 
Extreme Health Resolution Secrets and Lose Weight magically
Extreme Health Resolution Secrets and Lose Weight magicallyExtreme Health Resolution Secrets and Lose Weight magically
Extreme Health Resolution Secrets and Lose Weight magically
 
Extreme health resolution secrets
Extreme health resolution secretsExtreme health resolution secrets
Extreme health resolution secrets
 

More from hacksoni

CAPS794 Presentation RubricLearning Outcome Assess the leader.docx
CAPS794 Presentation RubricLearning Outcome Assess the leader.docxCAPS794 Presentation RubricLearning Outcome Assess the leader.docx
CAPS794 Presentation RubricLearning Outcome Assess the leader.docxhacksoni
 
CAPSTONE CASE The Student will be required to read the Capstone.docx
CAPSTONE CASE The Student will be required to read the Capstone.docxCAPSTONE CASE The Student will be required to read the Capstone.docx
CAPSTONE CASE The Student will be required to read the Capstone.docxhacksoni
 
Capitalism emphasizes fostering individualism while socialism emphas.docx
Capitalism emphasizes fostering individualism while socialism emphas.docxCapitalism emphasizes fostering individualism while socialism emphas.docx
Capitalism emphasizes fostering individualism while socialism emphas.docxhacksoni
 
Capitão et al. Translational Psychiatry ( 2019) 930 httpsdoi.docx
Capitão et al. Translational Psychiatry ( 2019) 930 httpsdoi.docxCapitão et al. Translational Psychiatry ( 2019) 930 httpsdoi.docx
Capitão et al. Translational Psychiatry ( 2019) 930 httpsdoi.docxhacksoni
 
Capital in the Twenty-First CenturyCAPITAL IN THE.docx
Capital in the Twenty-First CenturyCAPITAL IN THE.docxCapital in the Twenty-First CenturyCAPITAL IN THE.docx
Capital in the Twenty-First CenturyCAPITAL IN THE.docxhacksoni
 
Capital-Equipment BudgetingCapital-equipment budgeting is typica.docx
Capital-Equipment BudgetingCapital-equipment budgeting is typica.docxCapital-Equipment BudgetingCapital-equipment budgeting is typica.docx
Capital-Equipment BudgetingCapital-equipment budgeting is typica.docxhacksoni
 
Capital StructureCreate an argument for a publically traded heal.docx
Capital StructureCreate an argument for a publically traded heal.docxCapital StructureCreate an argument for a publically traded heal.docx
Capital StructureCreate an argument for a publically traded heal.docxhacksoni
 
Capital RationingCompare and contrast the Internal Rate of Retur.docx
Capital RationingCompare and contrast the Internal Rate of Retur.docxCapital RationingCompare and contrast the Internal Rate of Retur.docx
Capital RationingCompare and contrast the Internal Rate of Retur.docxhacksoni
 
Capital in the Twenty- First CenturyCAPITAL IN.docx
Capital in the Twenty- First CenturyCAPITAL IN.docxCapital in the Twenty- First CenturyCAPITAL IN.docx
Capital in the Twenty- First CenturyCAPITAL IN.docxhacksoni
 
Capital Investment EvaluationSelect one of the capital investmen.docx
Capital Investment EvaluationSelect one of the capital investmen.docxCapital Investment EvaluationSelect one of the capital investmen.docx
Capital Investment EvaluationSelect one of the capital investmen.docxhacksoni
 
Capacity ToolkitWhat is ‘capacity’ How do I decide whethe.docx
Capacity ToolkitWhat is ‘capacity’ How do I decide whethe.docxCapacity ToolkitWhat is ‘capacity’ How do I decide whethe.docx
Capacity ToolkitWhat is ‘capacity’ How do I decide whethe.docxhacksoni
 
Capital Investment 5Sources of Finance for the Proposed .docx
Capital Investment 5Sources of Finance for the Proposed .docxCapital Investment 5Sources of Finance for the Proposed .docx
Capital Investment 5Sources of Finance for the Proposed .docxhacksoni
 
Capital Investment Case Waterways Corporation is a private.docx
Capital Investment Case Waterways Corporation is a private.docxCapital Investment Case Waterways Corporation is a private.docx
Capital Investment Case Waterways Corporation is a private.docxhacksoni
 
Capital Budgeting ProcessComplete an APA-formatted two-page paper .docx
Capital Budgeting ProcessComplete an APA-formatted two-page paper .docxCapital Budgeting ProcessComplete an APA-formatted two-page paper .docx
Capital Budgeting ProcessComplete an APA-formatted two-page paper .docxhacksoni
 
Can We Know the Universe The following excerpt was publ.docx
Can We Know the Universe The following excerpt was publ.docxCan We Know the Universe The following excerpt was publ.docx
Can We Know the Universe The following excerpt was publ.docxhacksoni
 
Capital Budgeting and Dividend PolicyWe examined two very import.docx
Capital Budgeting and Dividend PolicyWe examined two very import.docxCapital Budgeting and Dividend PolicyWe examined two very import.docx
Capital Budgeting and Dividend PolicyWe examined two very import.docxhacksoni
 
Cape Town contends with worst drought in over a century By D.docx
Cape Town contends with worst drought in over a century By D.docxCape Town contends with worst drought in over a century By D.docx
Cape Town contends with worst drought in over a century By D.docxhacksoni
 
Cape Cod Wind project Please respond to the followingThe Cape.docx
Cape Cod Wind project Please respond to the followingThe Cape.docxCape Cod Wind project Please respond to the followingThe Cape.docx
Cape Cod Wind project Please respond to the followingThe Cape.docxhacksoni
 
Capella Career Center Last updated 62216 1 COMPE.docx
Capella Career Center  Last updated 62216      1 COMPE.docxCapella Career Center  Last updated 62216      1 COMPE.docx
Capella Career Center Last updated 62216 1 COMPE.docxhacksoni
 
Cape Town Water Crisis and the Efficient Use of Scarce Water B.docx
Cape Town Water Crisis and the Efficient Use of Scarce Water B.docxCape Town Water Crisis and the Efficient Use of Scarce Water B.docx
Cape Town Water Crisis and the Efficient Use of Scarce Water B.docxhacksoni
 

More from hacksoni (20)

CAPS794 Presentation RubricLearning Outcome Assess the leader.docx
CAPS794 Presentation RubricLearning Outcome Assess the leader.docxCAPS794 Presentation RubricLearning Outcome Assess the leader.docx
CAPS794 Presentation RubricLearning Outcome Assess the leader.docx
 
CAPSTONE CASE The Student will be required to read the Capstone.docx
CAPSTONE CASE The Student will be required to read the Capstone.docxCAPSTONE CASE The Student will be required to read the Capstone.docx
CAPSTONE CASE The Student will be required to read the Capstone.docx
 
Capitalism emphasizes fostering individualism while socialism emphas.docx
Capitalism emphasizes fostering individualism while socialism emphas.docxCapitalism emphasizes fostering individualism while socialism emphas.docx
Capitalism emphasizes fostering individualism while socialism emphas.docx
 
Capitão et al. Translational Psychiatry ( 2019) 930 httpsdoi.docx
Capitão et al. Translational Psychiatry ( 2019) 930 httpsdoi.docxCapitão et al. Translational Psychiatry ( 2019) 930 httpsdoi.docx
Capitão et al. Translational Psychiatry ( 2019) 930 httpsdoi.docx
 
Capital in the Twenty-First CenturyCAPITAL IN THE.docx
Capital in the Twenty-First CenturyCAPITAL IN THE.docxCapital in the Twenty-First CenturyCAPITAL IN THE.docx
Capital in the Twenty-First CenturyCAPITAL IN THE.docx
 
Capital-Equipment BudgetingCapital-equipment budgeting is typica.docx
Capital-Equipment BudgetingCapital-equipment budgeting is typica.docxCapital-Equipment BudgetingCapital-equipment budgeting is typica.docx
Capital-Equipment BudgetingCapital-equipment budgeting is typica.docx
 
Capital StructureCreate an argument for a publically traded heal.docx
Capital StructureCreate an argument for a publically traded heal.docxCapital StructureCreate an argument for a publically traded heal.docx
Capital StructureCreate an argument for a publically traded heal.docx
 
Capital RationingCompare and contrast the Internal Rate of Retur.docx
Capital RationingCompare and contrast the Internal Rate of Retur.docxCapital RationingCompare and contrast the Internal Rate of Retur.docx
Capital RationingCompare and contrast the Internal Rate of Retur.docx
 
Capital in the Twenty- First CenturyCAPITAL IN.docx
Capital in the Twenty- First CenturyCAPITAL IN.docxCapital in the Twenty- First CenturyCAPITAL IN.docx
Capital in the Twenty- First CenturyCAPITAL IN.docx
 
Capital Investment EvaluationSelect one of the capital investmen.docx
Capital Investment EvaluationSelect one of the capital investmen.docxCapital Investment EvaluationSelect one of the capital investmen.docx
Capital Investment EvaluationSelect one of the capital investmen.docx
 
Capacity ToolkitWhat is ‘capacity’ How do I decide whethe.docx
Capacity ToolkitWhat is ‘capacity’ How do I decide whethe.docxCapacity ToolkitWhat is ‘capacity’ How do I decide whethe.docx
Capacity ToolkitWhat is ‘capacity’ How do I decide whethe.docx
 
Capital Investment 5Sources of Finance for the Proposed .docx
Capital Investment 5Sources of Finance for the Proposed .docxCapital Investment 5Sources of Finance for the Proposed .docx
Capital Investment 5Sources of Finance for the Proposed .docx
 
Capital Investment Case Waterways Corporation is a private.docx
Capital Investment Case Waterways Corporation is a private.docxCapital Investment Case Waterways Corporation is a private.docx
Capital Investment Case Waterways Corporation is a private.docx
 
Capital Budgeting ProcessComplete an APA-formatted two-page paper .docx
Capital Budgeting ProcessComplete an APA-formatted two-page paper .docxCapital Budgeting ProcessComplete an APA-formatted two-page paper .docx
Capital Budgeting ProcessComplete an APA-formatted two-page paper .docx
 
Can We Know the Universe The following excerpt was publ.docx
Can We Know the Universe The following excerpt was publ.docxCan We Know the Universe The following excerpt was publ.docx
Can We Know the Universe The following excerpt was publ.docx
 
Capital Budgeting and Dividend PolicyWe examined two very import.docx
Capital Budgeting and Dividend PolicyWe examined two very import.docxCapital Budgeting and Dividend PolicyWe examined two very import.docx
Capital Budgeting and Dividend PolicyWe examined two very import.docx
 
Cape Town contends with worst drought in over a century By D.docx
Cape Town contends with worst drought in over a century By D.docxCape Town contends with worst drought in over a century By D.docx
Cape Town contends with worst drought in over a century By D.docx
 
Cape Cod Wind project Please respond to the followingThe Cape.docx
Cape Cod Wind project Please respond to the followingThe Cape.docxCape Cod Wind project Please respond to the followingThe Cape.docx
Cape Cod Wind project Please respond to the followingThe Cape.docx
 
Capella Career Center Last updated 62216 1 COMPE.docx
Capella Career Center  Last updated 62216      1 COMPE.docxCapella Career Center  Last updated 62216      1 COMPE.docx
Capella Career Center Last updated 62216 1 COMPE.docx
 
Cape Town Water Crisis and the Efficient Use of Scarce Water B.docx
Cape Town Water Crisis and the Efficient Use of Scarce Water B.docxCape Town Water Crisis and the Efficient Use of Scarce Water B.docx
Cape Town Water Crisis and the Efficient Use of Scarce Water B.docx
 

Recently uploaded

fourth grading exam for kindergarten in writing
fourth grading exam for kindergarten in writingfourth grading exam for kindergarten in writing
fourth grading exam for kindergarten in writingTeacherCyreneCayanan
 
Nutritional Needs Presentation - HLTH 104
Nutritional Needs Presentation - HLTH 104Nutritional Needs Presentation - HLTH 104
Nutritional Needs Presentation - HLTH 104misteraugie
 
Class 11th Physics NEET formula sheet pdf
Class 11th Physics NEET formula sheet pdfClass 11th Physics NEET formula sheet pdf
Class 11th Physics NEET formula sheet pdfAyushMahapatra5
 
Introduction to Nonprofit Accounting: The Basics
Introduction to Nonprofit Accounting: The BasicsIntroduction to Nonprofit Accounting: The Basics
Introduction to Nonprofit Accounting: The BasicsTechSoup
 
1029-Danh muc Sach Giao Khoa khoi 6.pdf
1029-Danh muc Sach Giao Khoa khoi  6.pdf1029-Danh muc Sach Giao Khoa khoi  6.pdf
1029-Danh muc Sach Giao Khoa khoi 6.pdfQucHHunhnh
 
Presentation by Andreas Schleicher Tackling the School Absenteeism Crisis 30 ...
Presentation by Andreas Schleicher Tackling the School Absenteeism Crisis 30 ...Presentation by Andreas Schleicher Tackling the School Absenteeism Crisis 30 ...
Presentation by Andreas Schleicher Tackling the School Absenteeism Crisis 30 ...EduSkills OECD
 
Measures of Central Tendency: Mean, Median and Mode
Measures of Central Tendency: Mean, Median and ModeMeasures of Central Tendency: Mean, Median and Mode
Measures of Central Tendency: Mean, Median and ModeThiyagu K
 
Paris 2024 Olympic Geographies - an activity
Paris 2024 Olympic Geographies - an activityParis 2024 Olympic Geographies - an activity
Paris 2024 Olympic Geographies - an activityGeoBlogs
 
Software Engineering Methodologies (overview)
Software Engineering Methodologies (overview)Software Engineering Methodologies (overview)
Software Engineering Methodologies (overview)eniolaolutunde
 
Russian Escort Service in Delhi 11k Hotel Foreigner Russian Call Girls in Delhi
Russian Escort Service in Delhi 11k Hotel Foreigner Russian Call Girls in DelhiRussian Escort Service in Delhi 11k Hotel Foreigner Russian Call Girls in Delhi
Russian Escort Service in Delhi 11k Hotel Foreigner Russian Call Girls in Delhikauryashika82
 
Grant Readiness 101 TechSoup and Remy Consulting
Grant Readiness 101 TechSoup and Remy ConsultingGrant Readiness 101 TechSoup and Remy Consulting
Grant Readiness 101 TechSoup and Remy ConsultingTechSoup
 
Key note speaker Neum_Admir Softic_ENG.pdf
Key note speaker Neum_Admir Softic_ENG.pdfKey note speaker Neum_Admir Softic_ENG.pdf
Key note speaker Neum_Admir Softic_ENG.pdfAdmir Softic
 
Interactive Powerpoint_How to Master effective communication
Interactive Powerpoint_How to Master effective communicationInteractive Powerpoint_How to Master effective communication
Interactive Powerpoint_How to Master effective communicationnomboosow
 
Unit-IV- Pharma. Marketing Channels.pptx
Unit-IV- Pharma. Marketing Channels.pptxUnit-IV- Pharma. Marketing Channels.pptx
Unit-IV- Pharma. Marketing Channels.pptxVishalSingh1417
 
Explore beautiful and ugly buildings. Mathematics helps us create beautiful d...
Explore beautiful and ugly buildings. Mathematics helps us create beautiful d...Explore beautiful and ugly buildings. Mathematics helps us create beautiful d...
Explore beautiful and ugly buildings. Mathematics helps us create beautiful d...christianmathematics
 
Sports & Fitness Value Added Course FY..
Sports & Fitness Value Added Course FY..Sports & Fitness Value Added Course FY..
Sports & Fitness Value Added Course FY..Disha Kariya
 
Arihant handbook biology for class 11 .pdf
Arihant handbook biology for class 11 .pdfArihant handbook biology for class 11 .pdf
Arihant handbook biology for class 11 .pdfchloefrazer622
 
Measures of Dispersion and Variability: Range, QD, AD and SD
Measures of Dispersion and Variability: Range, QD, AD and SDMeasures of Dispersion and Variability: Range, QD, AD and SD
Measures of Dispersion and Variability: Range, QD, AD and SDThiyagu K
 
APM Welcome, APM North West Network Conference, Synergies Across Sectors
APM Welcome, APM North West Network Conference, Synergies Across SectorsAPM Welcome, APM North West Network Conference, Synergies Across Sectors
APM Welcome, APM North West Network Conference, Synergies Across SectorsAssociation for Project Management
 
General AI for Medical Educators April 2024
General AI for Medical Educators April 2024General AI for Medical Educators April 2024
General AI for Medical Educators April 2024Janet Corral
 

Recently uploaded (20)

fourth grading exam for kindergarten in writing
fourth grading exam for kindergarten in writingfourth grading exam for kindergarten in writing
fourth grading exam for kindergarten in writing
 
Nutritional Needs Presentation - HLTH 104
Nutritional Needs Presentation - HLTH 104Nutritional Needs Presentation - HLTH 104
Nutritional Needs Presentation - HLTH 104
 
Class 11th Physics NEET formula sheet pdf
Class 11th Physics NEET formula sheet pdfClass 11th Physics NEET formula sheet pdf
Class 11th Physics NEET formula sheet pdf
 
Introduction to Nonprofit Accounting: The Basics
Introduction to Nonprofit Accounting: The BasicsIntroduction to Nonprofit Accounting: The Basics
Introduction to Nonprofit Accounting: The Basics
 
1029-Danh muc Sach Giao Khoa khoi 6.pdf
1029-Danh muc Sach Giao Khoa khoi  6.pdf1029-Danh muc Sach Giao Khoa khoi  6.pdf
1029-Danh muc Sach Giao Khoa khoi 6.pdf
 
Presentation by Andreas Schleicher Tackling the School Absenteeism Crisis 30 ...
Presentation by Andreas Schleicher Tackling the School Absenteeism Crisis 30 ...Presentation by Andreas Schleicher Tackling the School Absenteeism Crisis 30 ...
Presentation by Andreas Schleicher Tackling the School Absenteeism Crisis 30 ...
 
Measures of Central Tendency: Mean, Median and Mode
Measures of Central Tendency: Mean, Median and ModeMeasures of Central Tendency: Mean, Median and Mode
Measures of Central Tendency: Mean, Median and Mode
 
Paris 2024 Olympic Geographies - an activity
Paris 2024 Olympic Geographies - an activityParis 2024 Olympic Geographies - an activity
Paris 2024 Olympic Geographies - an activity
 
Software Engineering Methodologies (overview)
Software Engineering Methodologies (overview)Software Engineering Methodologies (overview)
Software Engineering Methodologies (overview)
 
Russian Escort Service in Delhi 11k Hotel Foreigner Russian Call Girls in Delhi
Russian Escort Service in Delhi 11k Hotel Foreigner Russian Call Girls in DelhiRussian Escort Service in Delhi 11k Hotel Foreigner Russian Call Girls in Delhi
Russian Escort Service in Delhi 11k Hotel Foreigner Russian Call Girls in Delhi
 
Grant Readiness 101 TechSoup and Remy Consulting
Grant Readiness 101 TechSoup and Remy ConsultingGrant Readiness 101 TechSoup and Remy Consulting
Grant Readiness 101 TechSoup and Remy Consulting
 
Key note speaker Neum_Admir Softic_ENG.pdf
Key note speaker Neum_Admir Softic_ENG.pdfKey note speaker Neum_Admir Softic_ENG.pdf
Key note speaker Neum_Admir Softic_ENG.pdf
 
Interactive Powerpoint_How to Master effective communication
Interactive Powerpoint_How to Master effective communicationInteractive Powerpoint_How to Master effective communication
Interactive Powerpoint_How to Master effective communication
 
Unit-IV- Pharma. Marketing Channels.pptx
Unit-IV- Pharma. Marketing Channels.pptxUnit-IV- Pharma. Marketing Channels.pptx
Unit-IV- Pharma. Marketing Channels.pptx
 
Explore beautiful and ugly buildings. Mathematics helps us create beautiful d...
Explore beautiful and ugly buildings. Mathematics helps us create beautiful d...Explore beautiful and ugly buildings. Mathematics helps us create beautiful d...
Explore beautiful and ugly buildings. Mathematics helps us create beautiful d...
 
Sports & Fitness Value Added Course FY..
Sports & Fitness Value Added Course FY..Sports & Fitness Value Added Course FY..
Sports & Fitness Value Added Course FY..
 
Arihant handbook biology for class 11 .pdf
Arihant handbook biology for class 11 .pdfArihant handbook biology for class 11 .pdf
Arihant handbook biology for class 11 .pdf
 
Measures of Dispersion and Variability: Range, QD, AD and SD
Measures of Dispersion and Variability: Range, QD, AD and SDMeasures of Dispersion and Variability: Range, QD, AD and SD
Measures of Dispersion and Variability: Range, QD, AD and SD
 
APM Welcome, APM North West Network Conference, Synergies Across Sectors
APM Welcome, APM North West Network Conference, Synergies Across SectorsAPM Welcome, APM North West Network Conference, Synergies Across Sectors
APM Welcome, APM North West Network Conference, Synergies Across Sectors
 
General AI for Medical Educators April 2024
General AI for Medical Educators April 2024General AI for Medical Educators April 2024
General AI for Medical Educators April 2024
 

Calorie and Fat SourcesProfile InfoPersonal Eduardo D.docx

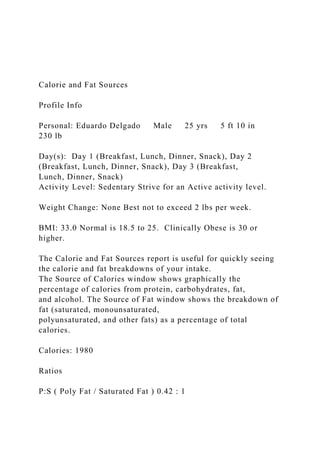
  • 1. Calorie and Fat Sources Profile Info Personal: Eduardo Delgado Male 25 yrs 5 ft 10 in 230 lb Day(s): Day 1 (Breakfast, Lunch, Dinner, Snack), Day 2 (Breakfast, Lunch, Dinner, Snack), Day 3 (Breakfast, Lunch, Dinner, Snack) Activity Level: Sedentary Strive for an Active activity level. Weight Change: None Best not to exceed 2 lbs per week. BMI: 33.0 Normal is 18.5 to 25. Clinically Obese is 30 or higher. The Calorie and Fat Sources report is useful for quickly seeing the calorie and fat breakdowns of your intake. The Source of Calories window shows graphically the percentage of calories from protein, carbohydrates, fat, and alcohol. The Source of Fat window shows the breakdown of fat (saturated, monounsaturated, polyunsaturated, and other fats) as a percentage of total calories. Calories: 1980 Ratios P:S ( Poly Fat / Saturated Fat ) 0.42 : 1
  • 2. Potassium : Sodium 0.91 : 1 Calcium : Phosphorus 0.71 : 1 CSI ( Cholesterol / Saturated Fat ) 29.23 Exchanges Starch 5.19 Other Carbs 6.76 Lean Meat 9.58 Alcohol 0.79 Fruit 3.44 Vegetables 4.62 Fat 6.53 NonFatMilk 0.62 Source of Fat Saturated Fat 6 % Mono Fat 7 % Poly Fat 3 % Trans Fat 0 % N/A * 6 %
  • 3. * Complete fat source information is not available for all foods. N/A Fat accounts for the missing information. Less than 10% of Calories* Minimize* Source of Calories Protein 21 % Carbohydrate 54 % Fat 21 % %4Alcohol 10-35% of Calories (adults 19+ yrs)*~ 45-65% of Calories (adults 19+ yrs)* 20-35% of Calories (adults 19+ yrs)* Do not exceed 2 standard drinks for men and 1 standard drink for women* * Dietary Reference Intakes ~ Protein recommendations have not been adjusted to take into account endurance/strength athletes who fall into the active and very active categories, but do take into account pregnancy and lactation. 7/14/19 6:23 PM Page 1 of 1
  • 4. Module 3 - SLP THE INCOME STATEMENT Before you start the assignment, test your understanding of concepts covered in the assignment. It is not a graded quiz, but a tool for reviewing some key points. The tool can be used multiple times. The purpose of this SLP is to apply ratio analysis to assess the financial health of ABC Company. Use the income statement presented in the case during this module to compute general or overall profitability ratios. Compute three ratios using at least one of the income statement accounts for each ratio. Some profitability ratios include both income and balance sheet accounts. The balance sheet accounts are found in module 2. Assume that ABC Company is a small specialty retail store. Ratios are relevant when assessed over time or across companies. IBIS is a comprehensive resource containing market research and statistics, which can be used to compare ABC Company to the industry and leaders in the industry. 1. Show the computation of the three ratios. 2. Comment on the purpose and information conveyed by each ratio. 3. What did you learn about ABC Company by reviewing the three ratios? 4. What is your conclusion about the profitability of the company? 5. How successful is ABC Company relative to the industry average and leaders in the small specialty retail store industry? Write two paragraphs or more. Include ratios found in the IBIS database to support your conclusion. The IBIS database is accessed through the Trident library. See the steps below. SLP Assignment Expectations Show the formulas for the computations. Two to three sentences are sufficient to respond to questions 1 through 4.
  • 5. See above for question 5 instructions. Do not use an essay format. Show sources when appropriate and APA format is suggested, but not required. Module 3 - Case THE INCOME STATEMENT Assignment Overview The background material for this module explains and shows examples of income statements. Pay attention to the layout and definitions of the income statement before reviewing the income statement for ABC Company shown below. Case Assignment The background information for the module includes the basic ideas, but for more ideas go to the optional background source principlesofaccounting.com. The site also offers multiple videos that you may find relevant. You may also use other sites to for ideas to complete the table. Do not forget to reference the sources used. Answer the questions below and explain your answer with numbers, computations, or a sentence or two. 1. Explain the term cost of sales in your own words. Is likely that the balance sheet of this company includes inventory? 2. Gross profit (margin) is a key piece of financial information. Why is it so important? 3. Explain operating expenses? What does the term mean? 4. Does ABC Company have any employees? Explain. 5. There is an error in the income statement. Property taxes are overstated by $10,000. How is the income statement affected by a correction of property taxes? 6. What happens to net income if the company hires a new manager at a salary of $80,000? 7. Does the company own any equipment? Is it informative to also check the balance sheet to answer this question? Explain.
  • 6. 8. Does the company have debt? How much debt? Explain how the income statement and balance sheet provide answers to the questions? 9. How do we know that ABC Company is using the accrual basis of accounting? Hint: Do not forget to look at the balance sheet from the prior module. 10. What happens to income statement at the end of the period? Is it continuous or does it close (terminate)? Assignment Expectations Respond to all questions showing your computations and/or using your own words. Do not use an essay format. Show sources when appropriate and APA format is suggested, but not required. · The objective for this assignment is to evaluate accounting concepts of income statement. Privacy Policy | Contact MyPlate Profile Info Personal: Eduardo Delgado Male 25 yrs 5 ft 10 in 230 lb Day(s): Day 1 (Breakfast, Lunch, Dinner, Snack), Day 2 (Breakfast, Lunch, Dinner, Snack), Day 3 (Breakfast, Lunch, Dinner, Snack) Activity Level: Sedentary Strive for an Active activity level. Weight Change: None Best not to exceed 2 lbs per week. BMI: 33.0 Normal is 18.5 to 25. Clinically Obese is 30 or higher.
  • 7. The MyPlate Food Guide report displays graphically how close the foodlist compares to the lastest USDA Dietary Guidelines (see ChooseMyPlate.gov for more info). Group Percent Amount Dairy Intake 21 % 0.6 Dairy Recommendation 3.0 cup equivalent cup equivalent Protein Foods Intake 172 % 12. Protein Foods Recommendation 7.0 oz equivalent oz equivalent Vegetables Intake 81 % 3.2 Vegetables Recommendation 4.0 cup equivalent cup equivalent Fruits Intake 76 % 1.9 Fruits Recommendation 2.5
  • 8. cup equivalent cup equivalent Grains Intake 38 % 3.8 Grains Recommendation 10. oz equivalent oz equivalent Comparison 3000 Calorie Pattern Make Half Your Grains Whole Vary Your Vegetables Oils & Empty Calories Dark Green Vegetables Orange Vegetables Dry Beans & Peas Starchy Vegetables Other Vegetables cups weekly3.0 cups weekly2.5 cups weekly3.5
  • 9. cups weekly9.0 cups weekly10. Aim for at least 5.0 oz equivalents whole grains a day Aim for 10.0 teaspoons of oils a day Limit your extra fats & sugars to 512 Calories a Intake vs. Recommendation oz equivalent is a 1 ounce estimate, rounded to consumer friendly units. For example, an oz equivalent of Grains is 1 slice of bread, or 1/2 cup of rice. An oz equivalent of Protein Foods 1 oz of meat, 1 egg, or 1/4 cup cooked beans. * * 7/14/19 6:26 PM Page 2 of 2 All Nutrients Spreadsheet This report shows all nutrient values in a spreadsheet format. Nutrients are displayed horizontally, with totals at the bottom of the list. Profile Info Personal: Eduardo Delgado Male 25 yrs 5 ft 10 in
  • 10. 230 lb Day(s): Day 1 (Breakfast, Lunch, Dinner, Snack), Day 2 (Breakfast, Lunch, Dinner, Snack), Day 3 (Breakfast, Lunch, Dinner, Snack) Activity Level: Sedentary Strive for an Active activity level. Weight Change: None Best not to exceed 2 lbs per week. BMI: 33.0 Normal is 18.5 to 25. Clinically Obese is 30 or higher. ItemDay Meal Amount Cals FatCal SatFatCal Prot (g) Day 1 Breakfast orange, fresh, medium, 2 5/8" ea1 61.6 1.4 0.1 1.2 egg, hard boiled, large (USDA) ea2 155 95.4 29.3 12.6 coffee, brewed, with tap water cup1 2.4 0.4 0 0.3 sugar, white, granulated (USDA) Tbs1 48.7 0 0 0 bread, whole grain artisan, side2 620 81 9 20 water, municipal tap (USDA) fl-oz16 0 0 0 0 milk, 1%, with vitamins A & D cup0.5 51.2 10.6 6.9 4.1 Lunch chicken breast, chunk, canned, oz3 67.5 13.5 0 13.5 bread, whole grain artisan, side2 620 81 9 20 soup, vegetable, canned, cup1 163.8 20.3 3.2 5.5 spinach, fresh, leaf (USDA) ea6 13.8 1.6 0.3 1.7
  • 11. tomatoes, fresh, year round slice2 7.2 0.7 0.1 0.4 mustard, yellow, prepared tsp1 3 1.4 0.1 0.2 water, non-carbonated (USDA: fl-oz16 0 0 0 0 Dinner chicken breast filet, flame oz6 225.6 31.2 7.8 29.5 peas, green, boiled, drained cup0.5 67.2 1.5 0.3 4.3 potato skin, baked (USDA) ea1 114.8 0.4 0.1 2.5 wine, red (USDA) fl-oz5.5 137.4 0 0 0.1 water, municipal tap (USDA) (2) fl-oz8 0 0 0 0 Snack cookie, milk chocolate, Milano ea2 113.3 54 24 1.3 water, municipal tap (USDA) (3) fl-oz8 0 0 0 0 Day Total -- 2472.7 394.6 90.3 117.2 Day 2 Breakfast muffin, toaster, wheat bran, ea1 106.4 28.7 4.6 1.9 sausage, beef & chicken, hot pce5 142.4 96 39.6 9.7 mango, fresh (USDA) ea1 201.6 11.4 2.7 2.8 milk, 1%, with vitamins A & D cup0.3 34.2 7.1 4.6 2.7 coffee, brewed, with tap water cup1 2.4 0.4 0 0.3 water, municipal tap (USDA) fl-oz16 0 0 0 0
  • 12. Lunch chicken breast, oven roasted, oz5.5 123.2 5.3 1.7 26.2 salad mix, classic iceberg (Dole) cup1.5 15 0 0 1 tomatoes, cherry, red, fresh, ea5 15.3 1.4 0.2 0.7 ItemDay Meal Amount Cals FatCal SatFatCal Prot (g) Day 2 Lunch onion, red, fresh, rings (USDA) ea6 14.4 0.3 0.1 0.4 croutons, seasoned, cubes ea10 11.6 4.1 1.2 0.3 salad dressing, italian (USDA) tsp2 23.5 18.6 2.6 0 water, Poland Spring (USDA: fl-oz16 0 0 0 0 Dinner halibut, atlantic, baked, fillet oz6 188.8 24.6 5.4 38.3 lemon juice, fresh (USDA) tsp1 1.1 0.1 0 0 broccoli florets, fresh (USDA) cup2 39.8 4.3 0.4 4.2 rice mix, long grain & wild, oz4 397.9 0 0 11.9 wine, white, pinot grigio (USDA) fl-oz5.5 134.2 0 0 0.1 water, municipal tap (USDA) (2) fl-oz8 0 0 0 0 Snack banana, fresh, large, 8" to 8 ea1 121 4 1.4 1.5 water, municipal tap (USDA) (3) fl-oz8 0 0 0 0 Day Total -- 1572.8 206.4 64.4 102
  • 13. Day 3 Breakfast english muffin, plain (USDA: ea1 132.2 9.2 1.5 4.6 almond butter (USDA) Tbs2 196.5 159.8 18.8 6.7 banana, fresh, large, 8" to 8 ea1 121 4 1.4 1.5 milk, 1%, with vitamins A & D cup1 102.5 21.2 13.9 8.2 water, municipal tap (USDA) fl-oz16 0 0 0 0 Lunch crackers, saltine, original, Zesta ea6 72 16.2 0 1.2 pears, fresh (USDA) med1 101.5 2.2 0.2 0.6 sandwich, turkey breast, with ea1 280 31.5 9 18 soup, homestyle chicken noodle indv cup1 110 27 13.5 8 water, Dasani, non-carbonated fl-oz16 0 0 0 0 Dinner beef steak, top sirloin, broiled, oz6 437.1 241.1 94.9 45.6 mashed potatoes, prepared from cup0.5 118.6 39.9 24.7 2 asparagus, fresh (USDA) cup1 26.8 1.4 0.4 2.9 water, municipal tap (USDA) (2) fl-oz16 0 0 0 0 Snack cashews, salted, dry roasted, cup0.2 196.6 142.8 28.2 5.2 water, municipal tap (USDA) (3) fl-oz8 0 0 0 0 Day Total -- 1894.9 696.3 206.3 104.5
  • 14. Average Day Total -- 1980.1 432.4 120.3 107.9 ItemDay Meal Carbs (g) Sugar (g) SugAdd (g) Fiber (g) Fib-S (g) Fib-I (g) Day 1 Breakfast orange, fresh, medium, 2 5/8" 15.4 12.2 0 3.1 2.1 1.1 egg, hard boiled, large (USDA) 1.1 1.1 0 0 0 0 coffee, brewed, with tap water 0 0 0 0 0 0 sugar, white, granulated (USDA) 12.6 12.6 12.6 0 0 0 bread, whole grain artisan, 126 50 12 water, municipal tap (USDA) 0 0 0 0 0 0 milk, 1%, with vitamins A & D 6.1 6.1 0 0 0 0 Lunch chicken breast, chunk, canned, 0 0 0 0 0 0 bread, whole grain artisan, 126 50 12 soup, vegetable, canned, 30.5 10.9 5.3 spinach, fresh, leaf (USDA) 2.2 0.2 0 1.3 tomatoes, fresh, year round 1.6 1 0 0.5 ItemDay Meal Carbs (g) Sugar (g) SugAdd (g) Fiber (g) Fib-S (g) Fib-I (g)
  • 15. Day 1 Lunch mustard, yellow, prepared 0.3 0 0.2 water, non-carbonated (USDA: 0 0 0 0 0 0 Dinner chicken breast filet, flame 17.4 12.1 0 0 0 peas, green, boiled, drained 12.5 4.7 0 4.4 1.2 3.2 potato skin, baked (USDA) 26.7 0.8 0 4.6 wine, red (USDA) 4.2 1 0 0 0 0 water, municipal tap (USDA) (2) 0 0 0 0 0 0 Snack cookie, milk chocolate, Milano 13.3 7.3 0.7 water, municipal tap (USDA) (3) 0 0 0 0 0 0 Day Total 395.8 170.2 12.6 44.1 3.3 4.3 Day 2 Breakfast muffin, toaster, wheat bran, 18.9 7.8 2.8 0.5 2.3 sausage, beef & chicken, hot 2 0 0 0 0 0 mango, fresh (USDA) 50.3 45 0 5.3 3 2.2 milk, 1%, with vitamins A & D 4.1 4.1 0 0 0 0 coffee, brewed, with tap water 0 0 0 0 0 0 water, municipal tap (USDA) 0 0 0 0 0 0 Lunch chicken breast, oven roasted, 3.4 0.1 0 0 0 salad mix, classic iceberg (Dole) 4 2 0 1
  • 16. tomatoes, cherry, red, fresh, 3.3 2.2 0 1 onion, red, fresh, rings (USDA) 3.4 1.5 0 0.6 croutons, seasoned, cubes 1.6 0.1 0.1 salad dressing, italian (USDA) 1.2 1.1 0 0 0 water, Poland Spring (USDA: 0 0 0 0 0 0 Dinner halibut, atlantic, baked, fillet 0 0 0 0 0 0 lemon juice, fresh (USDA) 0.4 0.1 0 0 0 0 broccoli florets, fresh (USDA) 7.2 2.1 3.2 0.4 2.9 rice mix, long grain & wild, 87.5 2 2 wine, white, pinot grigio (USDA) 3.3 water, municipal tap (USDA) (2) 0 0 0 0 0 0 Snack banana, fresh, large, 8" to 8 31.1 16.6 0 3.5 water, municipal tap (USDA) (3) 0 0 0 0 0 0 Day Total 221.5 84.8 0 19.6 3.9 7.4 Day 3 Breakfast english muffin, plain (USDA: 26.2 almond butter (USDA) 6 2 0 3.3 0.4 2.9 banana, fresh, large, 8" to 8 31.1 16.6 0 3.5 milk, 1%, with vitamins A & D 12.2 12.2 0 0 0 0
  • 17. water, municipal tap (USDA) 0 0 0 0 0 0 Lunch crackers, saltine, original, Zesta 14.4 0 0 0 0 0 pears, fresh (USDA) 27.1 17.4 0 5.5 1.1 4.4 sandwich, turkey breast, with 46 7 5 soup, homestyle chicken noodle 14 2 1 water, Dasani, non-carbonated 0 0 0 0 0 0 Dinner beef steak, top sirloin, broiled, 0 0 0 0 0 0 mashed potatoes, prepared from 17.6 1.5 1.6 asparagus, fresh (USDA) 5.2 2.4 0 2.7 ItemDay Meal Carbs (g) Sugar (g) SugAdd (g) Fiber (g) Fib-S (g) Fib-I (g) Day 3 Dinner water, municipal tap (USDA) (2) 0 0 0 0 0 0 Snack cashews, salted, dry roasted, 11.2 1.7 0 1 0.5 0.5 water, municipal tap (USDA) (3) 0 0 0 0 0 0 Day Total 211 62.8 0 23.7 2 7.8 Average Day Total 276.1 105.9 4.2 29.1 3.1 6.5 ItemDay Meal Fat (g) Fat-S (g) Fat-T (g) Fat-M (g) Fat-P (g) Chol (mg)
  • 18. Day 1 Breakfast orange, fresh, medium, 2 5/8" 0.2 0 0 0 0 0 egg, hard boiled, large (USDA) 10.6 3.3 4.1 1.4 373 coffee, brewed, with tap water 0 0 0 0 0 0 sugar, white, granulated (USDA) 0 0 0 0 0 0 bread, whole grain artisan, 9 1 0 0 water, municipal tap (USDA) 0 0 0 0 0 0 milk, 1%, with vitamins A & D 1.2 0.8 0 0.3 0 6.1 Lunch chicken breast, chunk, canned, 1.5 0 52.5 bread, whole grain artisan, 9 1 0 0 soup, vegetable, canned, 2.3 0.4 0.5 1 0 spinach, fresh, leaf (USDA) 0.2 0 0 0 0.1 0 tomatoes, fresh, year round 0.1 0 0 0 0 0 mustard, yellow, prepared 0.2 0 0 0.1 0 0 water, non-carbonated (USDA: 0 0 0 0 0 Dinner chicken breast filet, flame 3.5 0.9 0 69.4 peas, green, boiled, drained 0.2 0 0 0 0.1 0 potato skin, baked (USDA) 0 0 0 0 0 0 wine, red (USDA) 0 0 0 0 0 0
  • 19. water, municipal tap (USDA) (2) 0 0 0 0 0 0 Snack cookie, milk chocolate, Milano 6 2.7 0 3.3 water, municipal tap (USDA) (3) 0 0 0 0 0 0 Day Total 43.8 10 0 5.1 2.7 504.4 Day 2 Breakfast muffin, toaster, wheat bran, 3.2 0.5 0.8 1.7 3.1 sausage, beef & chicken, hot 10.7 4.4 5.3 0.4 36.3 mango, fresh (USDA) 1.3 0.3 0 0.5 0.2 0 milk, 1%, with vitamins A & D 0.8 0.5 0 0.2 0 4.1 coffee, brewed, with tap water 0 0 0 0 0 0 water, municipal tap (USDA) 0 0 0 0 0 0 Lunch chicken breast, oven roasted, 0.6 0.2 0.2 0.1 56.1 salad mix, classic iceberg (Dole) 0 0 0 0 0 0 tomatoes, cherry, red, fresh, 0.2 0 0 0 0 0 onion, red, fresh, rings (USDA) 0 0 0 0 0 0 croutons, seasoned, cubes 0.5 0.1 0.2 0.1 0.2 salad dressing, italian (USDA) 2.1 0.3 0 0.5 1 0 water, Poland Spring (USDA: 0 0 0 0 0 0 Dinner halibut, atlantic, baked, fillet 2.7 0.6 0 1 0.6 102.1
  • 20. lemon juice, fresh (USDA) 0 0 0 0 0 0 broccoli florets, fresh (USDA) 0.5 0 0 0 0.2 0 ItemDay Meal Fat (g) Fat-S (g) Fat-T (g) Fat-M (g) Fat-P (g) Chol (mg) Day 2 Dinner rice mix, long grain & wild, 0 0 0 0 0 0 wine, white, pinot grigio (USDA) 0 0 0 0 0 water, municipal tap (USDA) (2) 0 0 0 0 0 0 Snack banana, fresh, large, 8" to 8 0.4 0.2 0 0 0.1 0 water, municipal tap (USDA) (3) 0 0 0 0 0 0 Day Total 22.9 7.2 0.1 8.8 4.5 201.8 Day 3 Breakfast english muffin, plain (USDA: 1 0.2 0 0.2 0.5 almond butter (USDA) 17.8 2.1 0 10.4 4.4 0 banana, fresh, large, 8" to 8 0.4 0.2 0 0 0.1 0 milk, 1%, with vitamins A & D 2.4 1.5 0.1 0.7 0.1 12.2 water, municipal tap (USDA) 0 0 0 0 0 0 Lunch crackers, saltine, original, Zesta 1.8 0 0 0 0.6 0 pears, fresh (USDA) 0.2 0 0 0.1 0.1 0
  • 21. sandwich, turkey breast, with 3.5 1 0 20 soup, homestyle chicken noodle 3 1.5 0 30 water, Dasani, non-carbonated 0 0 0 0 0 Dinner beef steak, top sirloin, broiled, 26.8 10.5 11.2 1 163.3 mashed potatoes, prepared from 4.4 2.7 0.2 1.1 0.2 11.6 asparagus, fresh (USDA) 0.2 0 0 0 0.1 0 water, municipal tap (USDA) (2) 0 0 0 0 0 0 Snack cashews, salted, dry roasted, 15.9 3.1 0 9.4 2.7 0 water, municipal tap (USDA) (3) 0 0 0 0 0 0 Day Total 77.4 22.9 0.3 33 9.7 237 Average Day Total 48 13.4 0.1 15.6 5.6 314.4 ItemDay Meal Water (g) A-RAE(mcg)A-Car (mcg) B1 (mg) B2 (mg) B3 (mg) Day 1 Breakfast orange, fresh, medium, 2 5/8" 113.6 14.7 93 0.1 0 0.4 egg, hard boiled, large (USDA) 74.6 149 11 0.1 0.5 0.1 coffee, brewed, with tap water 235.4 0 0 0 0.2 0.4 sugar, white, granulated (USDA) 0 0 0 0 0 0 bread, whole grain artisan,
  • 22. water, municipal tap (USDA) 473.1 0 0 0 0 0 milk, 1%, with vitamins A & D 109.7 71 2.4 0 0.2 0.1 Lunch chicken breast, chunk, canned, bread, whole grain artisan, soup, vegetable, canned, 208.6 216.8 2205 0.3 0.2 3.9 spinach, fresh, leaf (USDA) 54.8 281.3 3375.6 0 0.1 0.4 tomatoes, fresh, year round 37.8 16.7 179.6 0 0 0.2 mustard, yellow, prepared 4.2 0.3 2.6 0 0 0 water, non-carbonated (USDA: 473.6 Dinner chicken breast filet, flame 0 0 peas, green, boiled, drained 62.3 32 376 0.2 0.1 1.6 potato skin, baked (USDA) 27.4 0.3 3.5 0.1 0.1 1.8 wine, red (USDA) 139.9 0.2 1.6 0 0 0.4 water, municipal tap (USDA) (2) 236.6 0 0 0 0 0 ItemDay Meal Water (g) A-RAE(mcg)A-Car (mcg) B1 (mg) B2 (mg) B3 (mg) Day 1 Snack cookie, milk chocolate, Milano 0 0 water, municipal tap (USDA) (3) 236.6 0 0 0 0 0
  • 23. Day Total 2488.2 782.2 6250.3 0.8 1.4 9.3 Day 2 Breakfast muffin, toaster, wheat bran, 9.2 19.1 0.3 0.1 0.1 0.8 sausage, beef & chicken, hot 30.4 0 0 0.3 0.1 1.9 mango, fresh (USDA) 280.4 181.8 2150.4 0.1 0.1 2.2 milk, 1%, with vitamins A & D 73.1 47.3 1.6 0 0.1 0.1 coffee, brewed, with tap water 235.4 0 0 0 0.2 0.4 water, municipal tap (USDA) 473.1 0 0 0 0 0 Lunch chicken breast, oven roasted, 119.6 0 0 0 0 5.3 salad mix, classic iceberg (Dole) 125 tomatoes, cherry, red, fresh, 80.3 35.4 381.6 0 0 0.5 onion, red, fresh, rings (USDA) 32.1 0 0.4 0 0 0 croutons, seasoned, cubes 0.1 0.2 0.2 0 0 0.1 salad dressing, italian (USDA) 6.2 0.2 2.1 0 0 0 water, Poland Spring (USDA: 474 0 0 0 0 Dinner halibut, atlantic, baked, fillet 129.5 40.8 0 0.1 0.1 13.5 lemon juice, fresh (USDA) 4.7 0 0.1 0 0 0 broccoli florets, fresh (USDA) 128.8 213 0.1 0.2 0.9
  • 24. rice mix, long grain & wild, 29.8 0.6 6 wine, white, pinot grigio (USDA) 140.6 water, municipal tap (USDA) (2) 236.6 0 0 0 0 0 Snack banana, fresh, large, 8" to 8 101.9 4.4 35.4 0 0.1 0.9 water, municipal tap (USDA) (3) 236.6 0 0 0 0 0 Day Total 2792.4 697 2572 1.4 1 32.6 Day 3 Breakfast english muffin, plain (USDA: 24.3 0 almond butter (USDA) 0.5 0 0.3 0 0.3 1 banana, fresh, large, 8" to 8 101.9 4.4 35.4 0 0.1 0.9 milk, 1%, with vitamins A & D 219.4 141.9 4.9 0 0.4 0.2 water, municipal tap (USDA) 473.1 0 0 0 0 0 Lunch crackers, saltine, original, Zesta pears, fresh (USDA) 149.4 2.2 24.9 0 0 0.3 sandwich, turkey breast, with soup, homestyle chicken noodle water, Dasani, non-carbonated 473.4 Dinner beef steak, top sirloin, broiled, 96.6 0 0 0.1 0.2 12.3 mashed potatoes, prepared from 79.4 39.9 9.4 0.1 0 1.1
  • 25. asparagus, fresh (USDA) 124.9 50.6 601.7 0.2 0.2 1.3 water, municipal tap (USDA) (2) 473.1 0 0 0 0 0 Snack cashews, salted, dry roasted, 0.6 0 0 0.1 0.1 0.5 water, municipal tap (USDA) (3) 236.6 0 0 0 0 0 Day Total 2453.2 239 676.6 0.5 1.3 17.6 Average Day Total 2577.9 572.7 3166.3 0.9 1.3 19.8 ItemDay Meal B6 (mg) B12 (mcg) C (mg) D (mcg) E-Toco (mg)Fola (mcg) Day 1 Breakfast orange, fresh, medium, 2 5/8" 0.1 0 69.7 0 0.2 39.3 egg, hard boiled, large (USDA) 0.1 1.1 0 2.2 1 44 coffee, brewed, with tap water 0 0 0 0 0 4.7 sugar, white, granulated (USDA) 0 0 0 0 0 0 bread, whole grain artisan, water, municipal tap (USDA) 0 0 0 0 0 0 milk, 1%, with vitamins A & D 0 0.6 0 1.5 0 6.1 Lunch chicken breast, chunk, canned, bread, whole grain artisan,
  • 26. soup, vegetable, canned, 0.4 0 2 0 3.6 30.2 spinach, fresh, leaf (USDA) 0.1 0 16.9 0 1.2 116.4 tomatoes, fresh, year round 0 0 5.5 0 0.2 6 mustard, yellow, prepared 0 0 0 0 0 0.4 water, non-carbonated (USDA: Dinner chicken breast filet, flame 2.1 peas, green, boiled, drained 0.2 0 11.4 0 0.1 50.4 potato skin, baked (USDA) 0.4 0 7.8 0 0 12.8 wine, red (USDA) 0.1 0 0 0 0 1.6 water, municipal tap (USDA) (2) 0 0 0 0 0 0 Snack cookie, milk chocolate, Milano 0 water, municipal tap (USDA) (3) 0 0 0 0 0 0 Day Total 1.4 1.7 115.3 3.7 6.4 311.9 Day 2 Breakfast muffin, toaster, wheat bran, 0 0 0 0.3 10.2 sausage, beef & chicken, hot 0.1 0.5 0 1.1 mango, fresh (USDA) 0.4 0 122.3 0 3 144.5 milk, 1%, with vitamins A & D 0 0.4 0 1 0 4.1 coffee, brewed, with tap water 0 0 0 0 0 4.7
  • 27. water, municipal tap (USDA) 0 0 0 0 0 0 Lunch chicken breast, oven roasted, 0.2 0.1 0 1.6 salad mix, classic iceberg (Dole) 6 tomatoes, cherry, red, fresh, 0 0 11.6 0 0.4 12.8 onion, red, fresh, rings (USDA) 0 0 2.7 0 0 6.8 croutons, seasoned, cubes 0 0 0 0 0 2.6 salad dressing, italian (USDA) 0 0 0 0 0.2 0 water, Poland Spring (USDA: 0 0 0 0 Dinner halibut, atlantic, baked, fillet 1.1 2.2 0 9.9 1.3 23.8 lemon juice, fresh (USDA) 0 0 2 0 0 1 broccoli florets, fresh (USDA) 0.2 0 132.3 0 100.8 rice mix, long grain & wild, 9.5 0 198.9 wine, white, pinot grigio (USDA) water, municipal tap (USDA) (2) 0 0 0 0 0 0 Snack banana, fresh, large, 8" to 8 0.5 0 11.8 0 0.1 27.2 water, municipal tap (USDA) (3) 0 0 0 0 0 0 Day Total 2.6 3.2 298.3 10.8 5.5 540.1
  • 28. ItemDay Meal B6 (mg) B12 (mcg) C (mg) D (mcg) E-Toco (mg)Fola (mcg) Day 3 Breakfast english muffin, plain (USDA: 22.8 almond butter (USDA) 0 0 0 0 7.7 17 banana, fresh, large, 8" to 8 0.5 0 11.8 0 0.1 27.2 milk, 1%, with vitamins A & D 0.1 1.1 0 2.9 0 12.2 water, municipal tap (USDA) 0 0 0 0 0 0 Lunch crackers, saltine, original, Zesta 0 pears, fresh (USDA) 0 0 7.6 0 0.2 12.5 sandwich, turkey breast, with 12 2 soup, homestyle chicken noodle 6 water, Dasani, non-carbonated Dinner beef steak, top sirloin, broiled, 0.9 3 0 0.8 13.6 mashed potatoes, prepared from 0.2 0.1 6.3 0.2 0.1 8.4 asparagus, fresh (USDA) 0.1 0 7.5 0 1.5 69.7 water, municipal tap (USDA) (2) 0 0 0 0 0 0 Snack cashews, salted, dry roasted, 0.1 0 0 0 0.3 23.6 water, municipal tap (USDA) (3) 0 0 0 0 0 0 Day Total 2 4.2 51.3 5.1 10.8 206.9
  • 29. Average Day Total 2 3 155 6.5 7.6 353 ItemDay Meal Calc (mg) Iron (mg) Magn (mg) Phos (mg) Potas (mg) Selen (mcg) Day 1 Breakfast orange, fresh, medium, 2 5/8" 52.4 0.1 13.1 18.3 237.1 0.6 egg, hard boiled, large (USDA) 50 1.2 10 172 126 30.8 coffee, brewed, with tap water 4.7 0 7.1 7.1 116 0 sugar, white, granulated (USDA) 0.1 0 0 0 0.2 0.1 bread, whole grain artisan, water, municipal tap (USDA) 14.2 0 4.7 0 4.7 0 milk, 1%, with vitamins A & D 152.5 0 13.4 115.9 183 4 Lunch chicken breast, chunk, canned, bread, whole grain artisan, soup, vegetable, canned, 50.4 1.7 63 113.4 1091.2 10.1 spinach, fresh, leaf (USDA) 59.4 1.6 47.4 29.4 334.8 0.6 tomatoes, fresh, year round 4 0.1 4.4 9.6 94.8 0 mustard, yellow, prepared 3.2 0.1 2.4 5.4 7.6 1.7 water, non-carbonated (USDA: 14.2 0 0 Dinner chicken breast filet, flame 34.7 1.2
  • 30. peas, green, boiled, drained 21.6 1.2 31.2 93.6 216.8 1.5 potato skin, baked (USDA) 19.7 4.1 24.9 58.6 332.3 0.4 wine, red (USDA) 12.9 0.7 19.4 37.2 205.4 0.3 water, municipal tap (USDA) (2) 7.1 0 2.4 0 2.4 0 Snack cookie, milk chocolate, Milano 0 1 water, municipal tap (USDA) (3) 7.1 0 2.4 0 2.4 0 Day Total 508.3 13.1 245.8 660.5 2954.7 50.1 Day 2 Breakfast muffin, toaster, wheat bran, 13.3 1 7.1 96.6 60.2 6.9 sausage, beef & chicken, hot 6.6 0.5 7.7 74.8 130.4 9.7 mango, fresh (USDA) 37 0.5 33.6 47 564.5 2 ItemDay Meal Calc (mg) Iron (mg) Magn (mg) Phos (mg) Potas (mg) Selen (mcg) Day 2 Breakfast milk, 1%, with vitamins A & D 101.7 0 8.9 77.3 122 2.7 coffee, brewed, with tap water 4.7 0 7.1 7.1 116 0 water, municipal tap (USDA) 14.2 0 4.7 0 4.7 0 Lunch chicken breast, oven roasted, 9.4 0.5 14 93.6 104.5 11.8
  • 31. salad mix, classic iceberg (Dole) 20 0.4 0 tomatoes, cherry, red, fresh, 8.5 0.2 9.4 20.4 201.4 0 onion, red, fresh, rings (USDA) 8.3 0.1 3.6 10.4 52.6 0.2 croutons, seasoned, cubes 2.4 0.1 1 3.5 4.5 0.7 salad dressing, italian (USDA) 1.3 0 0.5 1.5 8.2 0.2 water, Poland Spring (USDA: 4.7 0 4.7 0 0 0 Dinner halibut, atlantic, baked, fillet 15.3 0.3 47.6 488.2 898.1 94.2 lemon juice, fresh (USDA) 0.3 0 0.3 0.4 5.2 0 broccoli florets, fresh (USDA) 68.2 1.2 35.5 93.7 461.5 4.2 rice mix, long grain & wild, 119.4 5.4 417.8 wine, white, pinot grigio (USDA) water, municipal tap (USDA) (2) 7.1 0 2.4 0 2.4 0 Snack banana, fresh, large, 8" to 8 6.8 0.4 36.7 29.9 486.9 1.4 water, municipal tap (USDA) (3) 7.1 0 2.4 0 2.4 0 Day Total 456.1 10.6 227.3 1044.4 3643.2 134.1 Day 3 Breakfast english muffin, plain (USDA: 102.6 0.8 almond butter (USDA) 111 1.1 89.3 162.6 239.4 0.8 banana, fresh, large, 8" to 8 6.8 0.4 36.7 29.9 486.9 1.4
  • 32. milk, 1%, with vitamins A & D 305 0.1 26.8 231.8 366 8 water, municipal tap (USDA) 14.2 0 4.7 0 4.7 0 Lunch crackers, saltine, original, Zesta 0 0.7 12 pears, fresh (USDA) 16 0.3 12.5 21.4 206.5 0.2 sandwich, turkey breast, with 300 2.7 soup, homestyle chicken noodle 20 0.7 water, Dasani, non-carbonated 0 0 0 0 0 Dinner beef steak, top sirloin, broiled, 30.6 3.1 37.4 341.9 556.2 49.3 mashed potatoes, prepared from 25.2 0.3 18.9 47.2 298.2 0.8 asparagus, fresh (USDA) 32.2 2.9 18.8 69.7 270.7 3.1 water, municipal tap (USDA) (2) 14.2 0 4.7 0 4.7 0 Snack cashews, salted, dry roasted, 15.4 2 89 167.8 193.5 4 water, municipal tap (USDA) (3) 7.1 0 2.4 0 2.4 0 Day Total 1000.3 15 341.2 1072.3 2641.1 67.6 Average Day Total 654.9 12.9 271.5 925.7 3079.7 83.9 ItemDay Meal Sod (mg) Zinc (mg) Omega3 (g) Omega6 (g) Alc (g) Caff (mg) Day 1 Breakfast orange, fresh, medium, 2 5/8" 0 0.1 0 0 0 0
  • 33. egg, hard boiled, large (USDA) 124 1 0.1 1.3 0 0 coffee, brewed, with tap water 4.7 0 0 0 0 94.7 sugar, white, granulated (USDA) 0.1 0 0 0 0 0 bread, whole grain artisan, 0 0 0 water, municipal tap (USDA) 14.2 0 0 0 0 0 ItemDay Meal Sod (mg) Zinc (mg) Omega3 (g) Omega6 (g) Alc (g) Caff (mg) Day 1 Breakfast milk, 1%, with vitamins A & D 53.7 0.5 0 0 0 0 Lunch chicken breast, chunk, canned, 315 0 0 bread, whole grain artisan, 0 0 0 soup, vegetable, canned, 970.2 1 0 0.9 0 0 spinach, fresh, leaf (USDA) 47.4 0.3 0.1 0 0 0 tomatoes, fresh, year round 2 0.1 0 0 0 0 mustard, yellow, prepared 55.2 0 0 0 0 0 water, non-carbonated (USDA: 4.7 0 0 0 0 Dinner chicken breast filet, flame 1215 0 0 peas, green, boiled, drained 2.4 1 0 0.1 0 0
  • 34. potato skin, baked (USDA) 12.2 0.3 0 0 0 0 wine, red (USDA) 6.5 0.2 0 0 17.1 0 water, municipal tap (USDA) (2) 7.1 0 0 0 0 0 Snack cookie, milk chocolate, Milano 40 0 water, municipal tap (USDA) (3) 7.1 0 0 0 0 0 Day Total 2881.5 4.5 0.2 2.4 17.1 94.7 Day 2 Breakfast muffin, toaster, wheat bran, 179.2 0.1 0.2 1.5 0 0 sausage, beef & chicken, hot 847 1.1 0 0 mango, fresh (USDA) 3.4 0.3 0.2 0.1 0 0 milk, 1%, with vitamins A & D 35.8 0.3 0 0 0 0 coffee, brewed, with tap water 4.7 0 0 0 0 94.7 water, municipal tap (USDA) 14.2 0 0 0 0 0 Lunch chicken breast, oven roasted, 1694.9 0.4 0 0.1 0 0 salad mix, classic iceberg (Dole) 15 0 0 0 0 tomatoes, cherry, red, fresh, 4.2 0.1 0 0 0 0 onion, red, fresh, rings (USDA) 1.4 0.1 0 0 0 0 croutons, seasoned, cubes 27.2 0 0 0.1 0 0 salad dressing, italian (USDA) 97.3 0 0.1 0.9 0 0
  • 35. water, Poland Spring (USDA: 4.7 0 0 0 0 0 Dinner halibut, atlantic, baked, fillet 139.5 0.7 0.5 0.1 0 0 lemon juice, fresh (USDA) 0.1 0 0 0 0 0 broccoli florets, fresh (USDA) 38.3 0.6 0.2 0 0 0 rice mix, long grain & wild, 1332.9 0 0 0 0 wine, white, pinot grigio (USDA) 0 0 17.3 0 water, municipal tap (USDA) (2) 7.1 0 0 0 0 0 Snack banana, fresh, large, 8" to 8 1.4 0.2 0 0.1 0 0 water, municipal tap (USDA) (3) 7.1 0 0 0 0 0 Day Total 4455.4 4 1.2 2.8 17.3 94.7 Day 3 Breakfast english muffin, plain (USDA: 196.6 0 0.5 0 0 almond butter (USDA) 72.6 1 0 4.4 0 0 banana, fresh, large, 8" to 8 1.4 0.2 0 0.1 0 0 milk, 1%, with vitamins A & D 107.4 1 0 0.1 0 0 water, municipal tap (USDA) 14.2 0 0 0 0 0 Lunch crackers, saltine, original, Zesta 240 0 0 ItemDay Meal Sod (mg) Zinc (mg) Omega3 (g) Omega6 (g) Alc
  • 36. (g) Caff (mg) Day 3 Lunch pears, fresh (USDA) 1.8 0.2 0 0.1 0 0 sandwich, turkey breast, with 760 0 0 soup, homestyle chicken noodle 720 0 0 water, Dasani, non-carbonated 0 0 0 0 0 0 Dinner beef steak, top sirloin, broiled, 91.9 8.2 0.2 0.7 0 0 mashed potatoes, prepared from 332.8 0.3 0 0.2 0 0 asparagus, fresh (USDA) 2.7 0.7 0 0 0 0 water, municipal tap (USDA) (2) 14.2 0 0 0 0 0 Snack cashews, salted, dry roasted, 219.2 1.9 0 2.6 0 0 water, municipal tap (USDA) (3) 7.1 0 0 0 0 0 Day Total 2781.9 13.5 0.4 8.6 0 0 Average Day Total 3372.9 7.4 0.6 4.6 11.5 63.1 ItemDay Meal MPFruit (cup) MPDairy (cup) MPGrain (oz eq) MPVeg
  • 37. (cup) MPProt (oz eq) XxFruit Day 1 Breakfast orange, fresh, medium, 2 5/8" 0.7 0 0 0 0 1 egg, hard boiled, large (USDA) 0 0 0 0 2 0 coffee, brewed, with tap water 0 0 0 0 0 0 sugar, white, granulated (USDA) 0 0 0 0 0 0 bread, whole grain artisan, 0 0 0 0 0 0 water, municipal tap (USDA) 0 0 0 0 0 0 milk, 1%, with vitamins A & D 0 0.5 0 0 0 0 Lunch chicken breast, chunk, canned, 0 0 0 0 1.9 0 bread, whole grain artisan, 0 0 0 0 0 0 soup, vegetable, canned, 0 0 0 2 0 0 spinach, fresh, leaf (USDA) 0 0 0 1 0 0 tomatoes, fresh, year round 0 0 0 0.2 0 0 mustard, yellow, prepared 0 0 0 0 0 0 water, non-carbonated (USDA: 0 0 0 0 0 0 Dinner chicken breast filet, flame 0 0 0 0 6 0
  • 38. peas, green, boiled, drained 0 0 0 0.5 0 0 potato skin, baked (USDA) 0 0 0 0.4 0 0 wine, red (USDA) 0 0 0 0 0 0 water, municipal tap (USDA) (2) 0 0 0 0 0 0 Snack cookie, milk chocolate, Milano 0 0 0 0 0 0 water, municipal tap (USDA) (3) 0 0 0 0 0 0 Day Total 0.7 0.5 0 4.1 10 1 Day 2 Breakfast muffin, toaster, wheat bran, 0 0 0 0 0 0 sausage, beef & chicken, hot 0 0 0 0 1.9 0 mango, fresh (USDA) 2 0 0 0 0 3.4 milk, 1%, with vitamins A & D 0 0.3 0 0 0 0 coffee, brewed, with tap water 0 0 0 0 0 0 water, municipal tap (USDA) 0 0 0 0 0 0 Lunch chicken breast, oven roasted, 0 0 0 0 5.5 0 salad mix, classic iceberg (Dole) 0 0 0 1.5 0 0 tomatoes, cherry, red, fresh, 0 0 0 0.4 0 0 ItemDay Meal MPFruit
  • 39. (cup) MPDairy (cup) MPGrain (oz eq) MPVeg (cup) MPProt (oz eq) XxFruit Day 2 Lunch onion, red, fresh, rings (USDA) 0 0 0 0.2 0 0 croutons, seasoned, cubes 0 0 0.1 0 0 0 salad dressing, italian (USDA) 0 0 0 0 0 0 water, Poland Spring (USDA: 0 0 0 0 0 0 Dinner halibut, atlantic, baked, fillet 0 0 0 0 6 0 lemon juice, fresh (USDA) 0 0 0 0 0 0 broccoli florets, fresh (USDA) 0 0 0 2 0 0 rice mix, long grain & wild, 0 0 5.2 0 0 0 wine, white, pinot grigio (USDA) 0 0 0 0 0 0 water, municipal tap (USDA) (2) 0 0 0 0 0 0
  • 40. Snack banana, fresh, large, 8" to 8 0.9 0 0 0 0 2.1 water, municipal tap (USDA) (3) 0 0 0 0 0 0 Day Total 3 0.3 5.3 4.2 13.4 5.4 Day 3 Breakfast english muffin, plain (USDA: 0 0 1.6 0 0 0 almond butter (USDA) 0 0 0 0 2 0 banana, fresh, large, 8" to 8 0.9 0 0 0 0 2.1 milk, 1%, with vitamins A & D 0 1 0 0 0 0 water, municipal tap (USDA) 0 0 0 0 0 0 Lunch crackers, saltine, original, Zesta 0 0 0.9 0 0 0 pears, fresh (USDA) 1.1 0 0 0 0 1.8 sandwich, turkey breast, with 0 0 2.8 0 1.4 0 soup, homestyle chicken noodle 0 0 0.8 0 0.8 0 water, Dasani, non-carbonated 0 0 0 0 0 0 Dinner beef steak, top sirloin, broiled, 0 0 0 0 6 0 mashed potatoes, prepared from 0 0 0 0.5 0 0 asparagus, fresh (USDA) 0 0 0 1 0 0 water, municipal tap (USDA) (2) 0 0 0 0 0 0 Snack cashews, salted, dry roasted, 0 0 0 0 2.4 0
  • 41. water, municipal tap (USDA) (3) 0 0 0 0 0 0 Day Total 2 1 6 1.5 12.7 3.9 Average Day Total 1.9 0.6 3.8 3.2 12 3.4 ItemDay Meal XxOCarb XxStarch XxVeg XxFat XxAlc XxNoFtMlk Day 1 Breakfast orange, fresh, medium, 2 5/8" 0 0 0 0 0 0 egg, hard boiled, large (USDA) 0 0 0 1.4 0 0 coffee, brewed, with tap water 0 0 0 0 0 0 sugar, white, granulated (USDA) 0.8 0 0 0 0 0 bread, whole grain artisan, 8.4 0 0 1.8 0 0 water, municipal tap (USDA) 0 0 0 0 0 0 milk, 1%, with vitamins A & D 0 0 0 0 0 0.5 Lunch chicken breast, chunk, canned, 0 0 0 0 0 0 bread, whole grain artisan, 8.4 0 0 1.8 0 0 soup, vegetable, canned, 0 0 6.1 0.4 0 0 spinach, fresh, leaf (USDA) 0 0 0.4 0 0 0 tomatoes, fresh, year round 0 0 0.3 0 0 0 ItemDay Meal XxOCarb XxStarch XxVeg XxFat XxAlc
  • 42. XxNoFtMlk Day 1 Lunch mustard, yellow, prepared 0 0 0 0 0 0 water, non-carbonated (USDA: 0 0 0 0 0 0 Dinner chicken breast filet, flame 0 0 0 0 0 0 peas, green, boiled, drained 0 0 2.5 0 0 0 potato skin, baked (USDA) 0 1.8 0 0 0 0 wine, red (USDA) 0.3 0 0 0 1.2 0 water, municipal tap (USDA) (2) 0 0 0 0 0 0 Snack cookie, milk chocolate, Milano 0.9 0 0 1.2 0 0 water, municipal tap (USDA) (3) 0 0 0 0 0 0 Day Total 18.8 1.8 9.3 6.7 1.2 0.5 Day 2 Breakfast muffin, toaster, wheat bran, 1.2 0 0 0.6 0 0 sausage, beef & chicken, hot 0 0 0 1.6 0 0 mango, fresh (USDA) 0 0 0 0 0 0 milk, 1%, with vitamins A & D 0 0 0 0 0 0.3 coffee, brewed, with tap water 0 0 0 0 0 0 water, municipal tap (USDA) 0 0 0 0 0 0 Lunch chicken breast, oven roasted, 0 0 0 0 0 0
  • 43. salad mix, classic iceberg (Dole) 0 0 0.8 0 0 0 tomatoes, cherry, red, fresh, 0 0 0.6 0 0 0 onion, red, fresh, rings (USDA) 0 0 0.7 0 0 0 croutons, seasoned, cubes 0 0.1 0 0.1 0 0 salad dressing, italian (USDA) 0 0 0 0.4 0 0 water, Poland Spring (USDA: 0 0 0 0 0 0 Dinner halibut, atlantic, baked, fillet 0 0 0 0 0 0 lemon juice, fresh (USDA) 0 0 0 0 0 0 broccoli florets, fresh (USDA) 0 0 1.4 0 0 0 rice mix, long grain & wild, 0 5.8 0 0 0 0 wine, white, pinot grigio (USDA) 0.2 0 0 0 1.2 0 water, municipal tap (USDA) (2) 0 0 0 0 0 0 Snack banana, fresh, large, 8" to 8 0 0 0 0 0 0 water, municipal tap (USDA) (3) 0 0 0 0 0 0 Day Total 1.5 5.9 3.5 2.7 1.2 0.3 Day 3 Breakfast english muffin, plain (USDA: 0 1.7 0 0 0 0 almond butter (USDA) 0 0 0 3.2 0 0 banana, fresh, large, 8" to 8 0 0 0 0 0 0
  • 44. milk, 1%, with vitamins A & D 0 0 0 0.1 0 1 water, municipal tap (USDA) 0 0 0 0 0 0 Lunch crackers, saltine, original, Zesta 0 1 0 0.2 0 0 pears, fresh (USDA) 0 0 0 0 0 0 sandwich, turkey breast, with 0 3.1 0 0.2 0 0 soup, homestyle chicken noodle 0 0.9 0 0.3 0 0 water, Dasani, non-carbonated 0 0 0 0 0 0 Dinner beef steak, top sirloin, broiled, 0 0 0 2.8 0 0 mashed potatoes, prepared from 0 1.2 0 0.6 0 0 asparagus, fresh (USDA) 0 0 1 0 0 0 ItemDay Meal XxOCarb XxStarch XxVeg XxFat XxAlc XxNoFtMlk Day 3 Dinner water, municipal tap (USDA) (2) 0 0 0 0 0 0 Snack cashews, salted, dry roasted, 0 0 0 2.9 0 0 water, municipal tap (USDA) (3) 0 0 0 0 0 0 Day Total 0 7.9 1 10.2 0 1 Average Day Total 6.8 5.2 4.6 6.5 0.8 0.6 ItemDay Meal XxLnMeat
  • 45. Day 1 Breakfast orange, fresh, medium, 2 5/8" 0 egg, hard boiled, large (USDA) 1.8 coffee, brewed, with tap water 0 sugar, white, granulated (USDA) 0 bread, whole grain artisan, 0 water, municipal tap (USDA) 0 milk, 1%, with vitamins A & D 0 Lunch chicken breast, chunk, canned, 1.9 bread, whole grain artisan, 0 soup, vegetable, canned, 0 spinach, fresh, leaf (USDA) 0 tomatoes, fresh, year round 0 mustard, yellow, prepared 0 water, non-carbonated (USDA: 0 Dinner chicken breast filet, flame 4.2 peas, green, boiled, drained 0 potato skin, baked (USDA) 0 wine, red (USDA) 0
  • 46. water, municipal tap (USDA) (2) 0 Snack cookie, milk chocolate, Milano 0 water, municipal tap (USDA) (3) 0 Day Total 8 Day 2 Breakfast muffin, toaster, wheat bran, 0 sausage, beef & chicken, hot 1.4 mango, fresh (USDA) 0 milk, 1%, with vitamins A & D 0 coffee, brewed, with tap water 0 water, municipal tap (USDA) 0 Lunch chicken breast, oven roasted, 3.7 salad mix, classic iceberg (Dole) 0 tomatoes, cherry, red, fresh, 0 onion, red, fresh, rings (USDA) 0 croutons, seasoned, cubes 0 salad dressing, italian (USDA) 0 water, Poland Spring (USDA: 0 Dinner halibut, atlantic, baked, fillet 5.5
  • 47. lemon juice, fresh (USDA) 0 broccoli florets, fresh (USDA) 0 ItemDay Meal XxLnMeat Day 2 Dinner rice mix, long grain & wild, 0 wine, white, pinot grigio (USDA) 0 water, municipal tap (USDA) (2) 0 Snack banana, fresh, large, 8" to 8 0 water, municipal tap (USDA) (3) 0 Day Total 10.6 Day 3 Breakfast english muffin, plain (USDA: 0 almond butter (USDA) 1 banana, fresh, large, 8" to 8 0 milk, 1%, with vitamins A & D 0 water, municipal tap (USDA) 0 Lunch crackers, saltine, original, Zesta 0 pears, fresh (USDA) 0 sandwich, turkey breast, with 1.3
  • 48. soup, homestyle chicken noodle 0.7 water, Dasani, non-carbonated 0 Dinner beef steak, top sirloin, broiled, 6.5 mashed potatoes, prepared from 0 asparagus, fresh (USDA) 0 water, municipal tap (USDA) (2) 0 Snack cashews, salted, dry roasted, 0.8 water, municipal tap (USDA) (3) 0 Day Total 10.2 Average Day Total 9.6 7/14/19 6:24 PM Page 15 of 15 Actual Intakes -vs- Recommended Intakes Profile Info Personal: Eduardo Delgado Male 25 yrs 5 ft 10 in 230 lb Day(s): Day 1 (Breakfast, Lunch, Dinner, Snack), Day 2 (Breakfast, Lunch, Dinner, Snack), Day 3 (Breakfast, Lunch, Dinner, Snack)
  • 49. Activity Level: Sedentary Strive for an Active activity level. Weight Change: None Best not to exceed 2 lbs per week. BMI: 33.0 Normal is 18.5 to 25. Clinically Obese is 30 or higher. The actual intakes -vs- recommended intakes report displays the amount of nutrients consumed as they compare to your dietary intake recommendations. Nutrient Actual Rec. Percent Basic Components Calories 1,980. 3,012.5 66 % Calories from Fat 432.42 843.50 51 % 20-35% of Calories (adults 19+ yrs)* Calories from SatFat 120.35 271.13 44 % Less than 10% of Calories+ Protein (g) 107.89 83.46 129 % 10-35% of Calories (adults 19+ yrs)*~ Carbohydrates (g) 276.08 414.22 67 % 45-65% of Calories (adults 19+ yrs)* Total Sugars (g) 105.95 Added Sugar (g)++ 4.19 Less than 10% of Calories+ Dietary Fiber (g) 29.10 42.18 69 % Soluble Fiber (g) 3.07 InSoluble Fiber (g) 6.48 Fat (g) 48.05 93.72 51 % 20-35% of Calories (adults 19+ yrs)* Saturated Fat (g) 13.37 30.13 44 % Less than 10% of Calories+ Trans Fat (g) 0.12 Minimize+
  • 50. Mono Fat (g) 15.64 33.47 47 % Poly Fat (g) 5.63 30.13 19 % Cholesterol (mg) 314.40 300.00 105 % Limit+ Water (g) 2,577. 3,700.0 70 % Vitamins Vitamin A - RAE (mcg) 572.74 900.00 64 % Beta-carotene (mcg) 3,166. Vitamin B1 - Thiamin (mg) 0.91 1.20 76 % Vitamin B2 - Riboflavin 1.26 1.30 97 % Vitamin B3 - Niacin (mg) 19.84 16.00 124 % Vitamin B6 (mg) 1.99 1.30 153 % Do not exceed 100 mg* Vitamin B12 (mcg) 3.03 2.40 126 % Over 50 should take a supplement or eat fortified foods* Vitamin C (mg) 154.95 90.00 172 % Vitamin D - mcg (mcg) 6.54 15.00 44 % 15 to no more than 100 mcg* Vitamin E - a-Toco (mg) 7.57 15.00 50 % Folate (mcg) 352.99 400.00 88 % Women of child-bearing age should take a supplement or fortified foods with 400 mcg* Minerals Calcium (mg) 654.91 1,000.0 65 % Do not exceed 2500 mg* Iron (mg) 12.90 8.00 161 % Do not exceed 45 mg* Magnesium (mg) 271.45 400.00 68 % Do not exceed 350 mg by supplement* Phosphorus (mg) 925.72 700.00 132 % Do not exceed 4000 mg* Potassium (mg) 3,079. 4,700.0 66 % At least 4700 mg per day* Selenium (mcg) 83.94
  • 51. Sodium (mg) 3,372. 2,300.0 147 % Less than 2300 mg per day* - less than 1500 mg for some people+ Zinc (mg) 7.36 11.00 67 % Do not exceed 40 mg* Other Omega-3 (g) 0.59 Omega-6 (g) 4.64 Alcohol (g) 11.48 Do not exceed 2 standard drinks for men and 1 standard drink for women+ Caffeine (mg) 63.15 Up to 400 mg (three to five 8-oz cups of coffee per day)+ ~ Protein recommendations have not been adjusted to take into account endurance/strength athletes who fall into the active and very active categories, but do take into account pregnancy and lactation. ++The nutrient content of the items in the MDA food database depend on manufacturers' reporting accurate information. Since many do not have data yet on added sugars, this number may not be an accurate reflection of added sugar intake. * Dietary Reference Intakes + 2015 Dietary Guidelines for Americans 7/14/19 6:25 PM Page 2 of 2
  • 52. Daily Food Record Name (print):__Eduardo Delgado______________ Day/Date of Intake: June 27 thru June 29 Male__x____ Female ______ Age _25______ Meal Date Time Of Day Food Item Amount Description (Brand or restaurant) How Prepared (if applicable) Breakfast 6/27 7:00 am Naval Orange 1 Low-fat milk ½ a cup A-2
  • 53. eggs 2 Hard Boiled Black coffee 1 cup Sugar 1 tbs Whole grain bread 2 Ezekiel 4:9 Sesame toasted Water 16 ounce
  • 54. 6/28 7:30 a.m. Bran muffin 1 medium Chicken sausage 1 serving Jim Dean Skillet mango 1 small Low-fat milk 1/3 cup Black coffee 1 cup
  • 55. Water 16 ounce 6/29 8:30 a.m. Whole Wheat English Muffin 1 Thomas Almond Butter 2 tbsp Justin Banana 1 Low-fat milk 8 ounces A-2
  • 56. Water 16 ounce Lunch 6/27 12:30 p.m. A chicken sandwich with Chicken breast meat 3 ounces Valley Fresh canned Low-sodium vegetable soup 1 cup Healthy Choice Spinach leaves ¼ cup Raw
  • 57. tomato 2 slices Raw mustard Light spread Whole grain bread 2 slices Ezekiel 4:9 Sesame Water 16 ounce 6/28 1:00 p.m. Chicken breast 5.5 ounce Baked
  • 58. Salad mix 1.5 cup Dole Tossed Cherry tomatoes 5 red onions 6 slicd croutons 8-10 small Italian Dressing 2 tsp Newman water
  • 59. 16 ounce 6/29 12:40 p.m. chicken noodle soup 1 cup Subway Saltine crackers 6 Zesta Turkey Sub whole wheat 6” Subway Water 16 ounce Pear 1 medium
  • 60. Dinner Dinner 6/27 7:00 p.m. Chicken breast 6 ounce Baked Peas 1/2 cup Steamed Potatoes 1 medium Baked Wine Red 5.5 ounce Josh Water 8 ounces
  • 61. 6/28 7:30 p.m Halibut with lemon 6 ounce Baked Broccoli Florets 2 cups Wild rice 4 ounces Uncle Ben White Wine 5.5 ounces Robert Mondavi Water 8 ounces
  • 62. 6/29 7:15 p.m. Sirloin steak 6 ounce Grilled red potatoes ½ a cup Mashed Asparagus 1 cup Baked Water 16 ounces Snacks 6/27 10:00 p.m. Milano Cookie 2pk Pepperidge Farm
  • 63. Water 8 ounce 6/28 3:10 p.m. Banana 1 Water 8 ounce 6/29 8:10 p.m. Cashews 10-15 Planters Water 8 ounce
  • 64. · Record food items as completely as possible, listing separate ingredients when indicated (e.g., don’t just write “sandwich”, but include type of bread, filling, vegetables added, sauces and condiments). · Don’t forget beverages, including alcoholic beverages, sodas, and water. · Estimate the amounts or serving size you consume as closely as possible in units, such as cups, ounces, teaspoons, and teaspoons. (NOTE: “one serving”, “one bowl”, or “one piece” are not acceptable units as they are subjective measures and don’t relay quantifiable amounts.) You may want to measure foods to obtain a more accurate estimate of quantity. · When indicated, include preparation method or other details that may help describe the food, for example: indicate whether a chicken breast is baked, grilled, breaded, fried, etc. or whether vegetables are raw, steamed, “Southern style”, sautéed, fried, etc. What Are the Key Principles of Healthy Eating? 41 Healthy Eating Means Consuming a Variety of Foods Choosing a variety of foods improves the quality of the diet because the more var- ied the food choices, the better the chance of consuming
  • 65. adequate amounts of all the essential nutrients.2 Even within one food group, the nutrient composition of foods can vary dramatically. For example, while broccoli is a good source of folate, it has less than half the vitamin A of a carrot. Similarly, if the only fruit you eat is bananas, your diet would include an excellent source of potassium, but could be low in vitamin C. Because no single food or food group contains everything you need to be healthy, you should choose a variety of foods from within each food group and among food groups each day. This is the basic principle of the Fruits & Veggies—More Matters campaign developed by the Produce for Better Health Foundation and the Centers for Disease Control and Prevention.3 This campaign promotes eating a vari- ety of colorful fruits and vegetables—which are rich in vitamins, minerals, fiber, and phytochemicals—each day to help reduce the risk of cancer and heart disease and slow the effects of aging. Healthy Eating Means Moderate Intake of All Foods According to many registered dietitian nutritionists (RDNs), “there are no good or bad foods, just good or bad habits.” What they mean is that all foods—even less nutritious foods—can be part of a healthy diet, as long as they are consumed in moderation. Foods such as sweets and fried or packaged snack foods should be eaten only in small amounts to avoid consuming too much sugar and saturated fat, as well as too many kilocalories.
  • 66. Finally, these foods can displace more nutritious choices, resulting in a diet that lacks essential nutrients. Even some healthy foods, such as nutrient- dense nuts, can be high in kilocalories and should be consumed in moderation. Healthy eating doesn’t mean you can’t enjoy your favorite foods. It simply means eating those foods in moderation by lim- iting the portion size and number of servings you eat. Many people overestimate the appropriate portion sizes of foods. An entire body of research is devoted to studying factors that affect how much we put on our plates. The important point is that, in general, we tend to consume portions larger than necessary to meet our kilocalorie needs. See the Health Connection on pages 65–67 for examples of visuals you can use to estimate portion sizes. For suggestions on eating a balanced, varied, and moderate diet, see the Table Tips. Healthy Eating Includes Nutrient-Dense Foods Healthy eating also means choosing foods that are nutrient dense. Nutrient-dense foods are high in nutrients, such as vitamins and minerals, but low in energy (kilocalories), pro- viding more nutrients per kilocalorie (and in each bite) than less nutrient-dense foods.4 Fresh fruits and vegetables, for example, are nutrient dense because they are high in B vitamins, vitamin C, and minerals such as calcium and magnesium, as well as dietary fiber, while usually providing fewer than 60 kilocalories per serving.
  • 67. Nutrient-dense foods are also low in saturated fat and added sugars. To illustrate this concept, compare the nutrient density of two versions of the same food: a baked potato and potato chips (Figure 2.1). Although a medium baked potato and one ounce of potato chips have about the same number of kilocalories, the baked potato provides much higher amounts of vitamins and minerals than the deep- fried chips. Though many foods, such as vegetables, are clearly nutrient dense, and other foods, such as candy, are clearly not, some foods do not fit neatly into these two categories. Items such as dried fruits, nuts, peanut butter, and avocados are higher in kilocalories, but they are also excellent sources of important nutrients, including polyunsaturated fatty acids, calcium, and iron. Other foods, such as whole milk or yogurt, are higher portion Quantity of a food usually eaten at one sitting. Choosing a variety of nutrient-dense foods you enjoy is a key to eating a healthy diet. TABLE TIPS Tips for a Balanced, Varied, and Moderate Diet Keep healthy snacks such as whole- grain crackers in your dorm room and combine them with protein-rich peanut
  • 68. butter or low-fat yogurt. Pop a snack-pack size of light micro- wave popcorn for a portion-controlled whole-grain snack while you study. Adopt a multicolor code to guide your food choices. Add tomato slices and a low-fat cheese slice to your whole-grain sandwich and carrots to your tossed green salad to ensure that your choices are adequate and varied. Pack your own snack-sized portions of dried fruit, trail mix, whole-wheat crack- ers, baby carrots, or salt-free pretzels to carry in your backpack. Snack-sized bags of nuts and seeds are a nutri- tious way to help you avoid the vending machine and eat smaller, more moder- ate portions. Keep your sweets to no more than about 100 kilocalories a day. 42 Chapter 2 | Tools for Healthy Eating in saturated fat and kilocalories than their nonfat or low-fat counterparts, but still pro- vide significant amounts of calcium, riboflavin, vitamins A and D, and protein. Some foods, such as fruit-flavored yogurt and some fortified cereals, contain added sugars in addition to several essential nutrients. Do you think these
  • 69. foods can be considered nutrient dense? In all of these scenarios, the answer is yes. Whereas nutrient dense usually means high in nutrients and low in energy, foods that are high in nutrients and high in energy can also be considered nutrient dense. The key is to be aware of the extra kilocalories and make up for them elsewhere in the diet. If you don’t like skim milk and won’t drink it, but do enjoy the taste of whole milk, then drinking whole milk is a more healthy choice than drinking soda. Healthy Eating Includes Low-Energy-Dense Foods In contrast to nutrient density, energy density refers to foods that are high in energy but low in weight or volume, such as that potato chip. A serving of deep-fried chips weighs much less than a plain baked potato, but is considerably higher in kilocalories. Therefore, the chip contains more energy per gram. A big, leafy green salad, on the other hand, is large in volume but low in energy density, because of its high water content. Most high-fat foods are considered energy dense.5 This is because fat has 9 kilocalories per gram and is thus 2.25 times more energy dense than either carbohy- drates or protein at 4 kilocalories per gram. Individuals who choose low-energy-dense foods will generally have diets that are lower in fat and higher in nutrient content.
  • 70. Eating a low-energy-dense diet can sometimes be the key to weight loss. Recent studies have found that leaner individuals ate more low-energy- dense foods and fewer kilocalories, while consuming a greater volume of food, compared with their obese counterparts.6 Even modest changes in dietary intake may promote and help maintain weight loss7 over time.8 One reason for this may be that eating higher-volume, lower- energy foods means larger portions for the same number of kilocalories. Other reasons may include improved satiety and appetite control.9 In other words, low-energy foods will “fill you up before they fill you out.” If you are trying to maintain your current weight, or lose weight, you are probably on a limited energy budget and need to choose foods that are nutrient dense and low in kilocalories. Use the guide in Table 2.1 to help stretch your energy budget while con- suming the most nutrient-dense foods. satiety Feeling of satiation, or “fullness,” after a meal before hunger sets in again. ▲ Figure 2.1 Which Is the Healthier Way to Enjoy Potatoes? Whereas one ounce of potato chips and one medium baked potato have similar kilocalories, their nutrient content is worlds apart. A baked potato contains more folate, potassium, and vitamin C, and fewer fat kilocalories, than its fried counterpart. The baked potato is therefore more nutrient dense than potato chips. * Note: Based on the percentage of the DRI for 19- to -50-year-
  • 71. old males. All these percentages apply to females in the same age range, except for vitamin C. Females have lower vitamin C needs than males, so a baked potato provides over 20 percent of the DRI of this vitamin for women. 100 0 20 40 60 80 Pe rc en t D R I* Potato chips, 1 oz Baked potato, medium Vitamin CPotassiumFolate
  • 72. 7/3/2019 Appendix 13. Food Sources of Dietary Fiber - 2015- 2020 Dietary Guidelines - health.gov https://health.gov/dietaryguidelines/2015/guidelines/appendix- 13/ 1/6 Appendix 13. Food Sources of Dietary Fiber Table A13-1. Dietary Fiber: Food Sources Ranked by Amounts of Dietary Fiber and Energy per Standard Food Portions and per 100 Grams of Foods Food Standard Portion Size Calories in Standard Portion Dietary Fiber in Standard Portion (g) Calories per 100 grams High �ber bran ready-to-eat cereal ⅓ – ¾ cup 60-81 9.1-14.3 200-260 Navy beans, cooked ½ cup 127 9.6 140 Small white beans, cooked ½ cup 127 9.3 142 Yellow beans, cooked ½ cup 127 9.2 144
  • 73. Previous Column Next Column a a a 2015-2020 Dietary Guidelines https://health.gov/dietaryguidelines/2015/guidelines/ 7/3/2019 Appendix 13. Food Sources of Dietary Fiber - 2015- 2020 Dietary Guidelines - health.gov https://health.gov/dietaryguidelines/2015/guidelines/appendix- 13/ 2/6 Food Standard Portion Size Calories in Standard Portion Dietary Fiber in Standard Portion (g) Calories per 100 grams Shredded wheat ready-to-eat cereal (various) 1-1 ¼ cup 155-220 5.0-9.0 321-373 Cranberry (roman) beans, cooked
  • 74. ½ cup 120 8.9 136 Adzuki beans, cooked ½ cup 147 8.4 128 French beans, cooked ½ cup 114 8.3 129 Split peas, cooked ½ cup 114 8.1 116 Chickpeas, canned ½ cup 176 8.1 139 Lentils, cooked ½ cup 115 7.8 116 Pinto beans, cooked ½ cup 122 7.7 143 Black turtle beans, cooked ½ cup 120 7.7 130 Mung beans, cooked ½ cup 106 7.7 105 Black beans, cooked ½ cup 114 7.5 132 Artichoke, globe or French, cooked ½ cup 45 7.2 53 Lima beans, cooked ½ cup 108 6.6 115 a a a 7/3/2019 Appendix 13. Food Sources of Dietary Fiber - 2015- 2020 Dietary Guidelines - health.gov https://health.gov/dietaryguidelines/2015/guidelines/appendix-
  • 75. 13/ 3/6 Food Standard Portion Size Calories in Standard Portion Dietary Fiber in Standard Portion (g) Calories per 100 grams Great northern beans, canned ½ cup 149 6.4 114 White beans, canned ½ cup 149 6.3 114 Kidney beans, all types, cooked ½ cup 112 5.7 127 Pigeon peas, cooked ½ cup 102 5.6 121 Cowpeas, cooked ½ cup 99 5.6 116 Wheat bran �akes ready-to-eat cereal (various) ¾ cup 90-98 4.9-5.5 310-328 Pear, raw 1 medium 101 5.5 57 Pumpkin seeds, whole, roasted 1 ounce 126 5.2 446 Baked beans, canned, plain ½ cup 119 5.2 94
  • 76. Soybeans, cooked ½ cup 149 5.2 173 Plain rye wafer crackers 2 wafers 73 5.0 334 Avocado ½ cup 120 5.0 160 Broadbeans (fava beans), cooked ½ cup 94 4.6 110 a a a 7/3/2019 Appendix 13. Food Sources of Dietary Fiber - 2015- 2020 Dietary Guidelines - health.gov https://health.gov/dietaryguidelines/2015/guidelines/appendix- 13/ 4/6 Food Standard Portion Size Calories in Standard Portion Dietary Fiber in Standard Portion (g) Calories per 100 grams Pink beans, cooked ½ cup 126 4.5 149
  • 77. Apple, with skin 1 medium 95 4.4 52 Green peas, cooked (fresh, frozen, canned) ½ cup 59-67 3.5-4.4 69-84 Refried beans, canned ½ cup 107 4.4 90 Chia seeds, dried 1 Tbsp 58 4.1 486 Bulgur, cooked ½ cup 76 4.1 83 Mixed vegetables, cooked from frozen ½ cup 59 4.0 65 Raspberries ½ cup 32 4.0 52 Blackberries ½ cup 31 3.8 43 Collards, cooked ½ cup 32 3.8 33 Soybeans, green, cooked ½ cup 127 3.8 141 Prunes, stewed ½ cup 133 3.8 107 Sweet potato, baked in skin 1 medium 103 3.8 90 a a a 7/3/2019 Appendix 13. Food Sources of Dietary Fiber - 2015- 2020 Dietary Guidelines - health.gov
  • 78. https://health.gov/dietaryguidelines/2015/guidelines/appendix- 13/ 5/6 Food Standard Portion Size Calories in Standard Portion Dietary Fiber in Standard Portion (g) Calories per 100 grams Figs, dried ¼ cup 93 3.7 249 Pumpkin, canned ½ cup 42 3.6 34 Potato, baked, with skin 1 medium 163 3.6 94 Popcorn, air-popped 3 cups 93 3.5 387 Almonds 1 ounce 164 3.5 579 Pears, dried ¼ cup 118 3.4 262 Whole wheat spaghetti, cooked ½ cup 87 3.2 124 Parsnips, cooked ½ cup 55 3.1 71 Sun�ower seed kernels, dry roasted
  • 79. 1 ounce 165 3.1 582 Orange 1 medium 69 3.1 49 Banana 1 medium 105 3.1 89 Guava 1 fruit 37 3.0 68 Oat bran mu�n 1 small 178 3.0 270 Pearled barley, cooked ½ cup 97 3.0 123 a a a 7/3/2019 Appendix 13. Food Sources of Dietary Fiber - 2015- 2020 Dietary Guidelines - health.gov https://health.gov/dietaryguidelines/2015/guidelines/appendix- 13/ 6/6 Food Standard Portion Size Calories in Standard Portion Dietary Fiber in Standard Portion (g) Calories per 100 grams Winter squash, cooked ½ cup 38 2.9 37
  • 80. Dates ¼ cup 104 2.9 282 Pistachios, dry roasted 1 ounce 161 2.8 567 Pecans, oil roasted 1 ounce 203 2.7 715 Hazelnuts or �lberts 1 ounce 178 2.7 628 Peanuts, oil roasted 1 ounce 170 2.7 599 Whole wheat paratha bread 1 ounce 92 2.7 326 Quinoa, cooked ½ cup 111 2.6 120 Source: U.S Department of Agriculture, Agricultural Research Service, Nutrient Data Laboratory. 2014. USDA National Nutrient Database for Standard Reference, Release 27. Available at: http://www.ars.usda.gov/nutrientdata (http://www.ars.usda.gov/nutrientdata). a a a a http://www.ars.usda.gov/nutrientdata Assignment 5, Diet Analysis Part B (due July 10): I have attached the daily food intake for 3 days file Prepare a summary report to discuss your findings and recommendations. This summary is based on the MyDietAnalysis reports that you have already submitted in Part A. I have attached these reports 4 total which were based on the 3 day food intake entered Part C (due July 10):
  • 81. Prepare a detailed report to discuss how your intake compares to recommended goals. This report is based on the MyDietAnalysis reports. I have attached these reports 4 total which were based on the 3 day food intake entered You will submit Part B, and Part C as separate assignments. Part B and Part C This Assignment is essentially, your final project for this course. Be sure to put time and effort into it. The Dietary Analysis Assignment is designed to help you assess your own personal dietary patterns and food choices and make recommendations for improvement. This part of the assignment is based on the reports you created for Part A. You should spend some time analyzing your diet with My Diet Analysis tool. Use the data you reported in Part A. Look at the four reports you submitted in Part A. Answer the following questions. Your answers should be thorough and include SPECIFIC insights about your results. Show that you have spent some time at MyDietAnalysis website and provide specific details! 1. Use THIS https://www.choosemyplate.gov/nutrition-nutrient- density page and “All Nutrients Spreadsheet” report to answer these questions. Look at the "Calories" and "Saturated Fat Calories" columns to see the details. a) Define “nutrient density” (review the information on p.41-42 in your textbook). b) What 2 specific foods that you ate were the most nutrient dense? Explain WHY you think so. c) Which 2 foods were the least nutrient dense? Explain WHY you think so. 2. Using “My Plate” report, list specific foods that you could change (add, delete, prepare differently, etc.) in order to make your day’s intake meet the MyPlate requirements in any 2groups of the recommendations. What groups would you like to change? If you have met the recommendations, discuss further whether
  • 82. you would benefit from changing your diet. Be VERY SPECIFIC about amounts and foods to add or subtract in order to meet your MyPlate recommendations. For example, if you were over the meat/protein recommendation by 3 oz., you could say something like “I could have 1 less egg for breakfast and 2 fewer ounces of chicken for dinner in order to bring my meat group in line.” Use ChooseMyPlate https://www.choosemyplate.gov/start- simple-myplate website to find cup and ounce equivalents for each food group (click on the food groups on the sidebar). 3. How does your actual calo rie intake compare to the recommended intake? Is it higher, lower, or within 10% of recommended? Does this concern you? Why or why not? Explain. Provide specific recommendations if necessary. Use the "Actual Intakes vs Recommended Intakes" report. 4. Discuss any discrepancies (over or under) in your MACROnutrients (protein, carbohydrates, fat, saturated fat, fiber, cholesterol). Are any of these of concern to you? Why or why not? Explain. Make suggestions on how to change your diet in order to bring these nutrients to the recommended levels. Provide specific recommendations if necessary. Use the "Actual Intakes vs Recommended Intakes" report. You can use Appendix 13 (attached) of the Dietary Guidelines for Americans to find foods that are rich in fiber. You can also use THIShttps://www.mayoclinic.org/healthy-lifestyle/nutrition- and-healthy-eating/in-depth/high-fiber-foods/art- 20050948 article. If your report shows too much of some undesirable macronutrients, track the foods that supplied them. Use "All Nutrients spreadsheet" report for that. 5. Compare your calorie sources of carbohydrate, protein, fat, and alcohol with recommended ranges from the Dietary Reference Intakes (DRIs): 45-65% - Carbohydrates 10-35% - Protein 20-35% - Fat
  • 83. 0 - 5% - Alcohol Use the "Calorie and Fat Sources" report. If your intake for protein, carbohydrate, fat and/or alcohol falls outside recommended ranges, list 1-2 changes that might help bring your calorie distribution within recommended ranges. Please be specific. If your intakes are within the ranges, discuss whether you would want to make any changes and explain why. 6. From your “Actual Intakes vs Recommended Intakes” report, list 5 MICROnutrients (vitamins and/or minerals) that were not OK. Pick the micronutrients in which you were the most significantlyunder OR over the recommendation. State what is in your report and what is recommended. What are the three most significant 'deficiencies'? For each micronutrient that you listed in the 'most deficient', discuss the following: a) Why this micronutrient is important and why your result may (or may not) be of concern to you. Provide a reference. b) Suggest 2specific foods – with portion sizes and the amount of the nutrient in that portion -- that you could add to (or subtract from) what you ate during this period to bring that nutrient intake in line with recommendations. Do this for each of the 3 most 'deficient' micronutrients. To find foods that are rich in specific micronutrients, you can use your textbook or THIS https://lpi.oregonstate.edu/sites/lpi.oregonstate.edu/file s/pdf/mic/micronutrients_for_health.pdf website. To check the amount of the micronutrient in a specific food, use MyDietAnalysis tool or the USDA websites from Assignment 3. In MyDietAnalysis, use the Diet Tracker tab to enter the food and find the amount of the nutrient in a given amount of food. Be sure to provide a reference to your sources. When answering Questions 4 and 6, keep in mind that it is impossible to get exact amounts that are recommended. It is OK to consume more than the 'recommended' amount of some nutrients but not the others. Show that you understand this subject. Do not analyze your water intake - it is difficult to record water
  • 84. consumption accurately. Please write your response to the questions in the numbered format. Copy the questions into your paper. For Questions 2, 4 and 6, clearly state what your intake was and what is recommended. Use absolute units (cups, oz, grams, mg, etc.) - not percents. In general, state your result from the reports BEFORE analyzing it and providing recommendations. Keep in mind that your reviewers do not have access to your actual reports. Make sure they can understand what you are talking about. Do not forget to title your paper (create a unique title). You can use any reliable websites for information. Make sure to provide a REFERENCE to all sources you used (in-text citation and the reference list). Use the same APA style as in Discussions: - Number your sources in order of their appearance in the text. - Use the number for in-text citation (in parentheses or superscript). - Arrange your reference list in numerical order. This assignment is worth 80 points you must complete each criteria stated here: This criterion is linked to a Learning Outcome 1. Summary report includes a thorough discussion of 2 specific foods that were the most nutrient dense and 2 foods that were the least nutrient dense. 10.0 pts This criterion is linked to a Learning Outcome 2. Summary report includes well-thought-out recommendations for modifying 2 of the 5 food groups to meet the MyPlate recommendations. Results from the report and the recommended amounts are clearly stated. 10.0 pts This criterion is linked to a Learning Outcome 3. Summary report includes a thorough discussion of the significance of actual calorie intake vs. recommended intake. 10.0 pts
  • 85. This criterion is linked to a Learning Outcome 4. Summary report includes a thorough discussion of the significance of all MACROnutrient discrepancies. Specific suggestions are provided. Results from the report and the recommended amounts are clearly stated. 10.0 pts This criterion is linked to a Learning Outcome 5. Summary report includes a thorough discussion of the specific changes that may bring the calorie distribution within recommended ranges. 10.0 pts This criterion is linked to a Learning Outcome 6. Summary report includes a list of the 5 MICROnutrients that were over/under recommendations. The importance of THREE most significant discrepancies are discussed and 2 foods (for each deficiency, with portion sizes) that would correct the deficiencies are provided. Reference to a reliable source is provided. Results from the report and the recommended amounts are clearly stated. 15.0 pts This criterion is linked to a Learning Outcome Uses appropriate English grammar, sentence structure, with few errors in spelling, punctuation, and capitalization 2.0 pts This criterion is linked to a Learning Outcome Assignment is in correct format -- title, appropriate font size, Reference List (if necessary), etc. Answers are numbered and questions are copied into the paper. Results from the report and the recommended amounts are clearly stated. 3.0 pts This criterion is linked to a Learning Outcome Reviews TWO submissions by other students, writes thoughtful feedback. Comments are well organized, critical thought is used. Uses appropriate English grammar. 10.0 pts
  • 86. Assignment 5, Diet Analysis Part B (due July 1 0 ): I have attached the daily food intake for 3 days file Prepare a summary report to discuss your findings and recommendations. This summary is based on the MyDietAnalysis reports that you have already submitted in Part A. I have attached these reports 4 total which were based on the 3 day food intake entered Part C (due July 10 ): Prepare a detailed report to discuss how your intake compares to recommended goals. This report is base d on the MyDietAnalysis reports. I have attached these reports 4 total which were based on the 3 day food intake entered You will submit Part B, and Part C as separate assignments. Part B an
  • 87. d Part C This Assignment is essentially, your final project for this course. Be sure to put time and effort into it. The Dietary Analysis Assignment is designed to help you assess your own personal dietary patterns and food choic es and make recommendations for improvement. This part of the assignment is based on the reports you created for Part A. You should spend some time analyzing your diet with My Diet Analysis tool. Use the data you reported in Part A. Look at the four re ports you submitted in Part A. Answer the following questions. Your answers should be thorough and include SPECIFIC insights about your results. Show that you have spent some time at MyDietAnalysis website and provide specific details! 1. Use THIS
  • 88. https://www.choosemyplate.gov/nutrition - nutrient - density page and “ All Nutrients Spreadsheet ” report to answer these questions. Look at the "Calories" and "Saturated Fat Calories" columns to see the details. a) Define “nutrient density” (review the information on p.41 - 42 in your textbook). b) What 2 specific foods that you ate were the most nutrient dense?
  • 89. Explain WHY you think so. c) Which 2 foods were the least n utrient dense? Explain WHY you think so. 2. Using “ My Plate ” report, list specific foods that you could change (add, delete, prepare differently, etc.) in order to make your day’s intake meet the MyPlate requirements in any
  • 90. 2 groups of the recommendations. W hat groups would you like to change? If you have met the recommendations, discuss further whether you would benefit from changing your diet. Be VERY SPECIFIC about amounts and foods to add or subtract in order to meet your MyPlate recommendations. Fo r example , if you were over the meat/protein recommendation by 3 oz., you could say something like “I could have 1 less egg for breakfast and 2 fewer ounces of chicken for dinner in order to bring my meat group Assignment 5, Diet Analysis Part B (due July 10): I have attached the daily food intake for 3 days file Prepare a summary report to discuss your findings and recommendations. This summary is based on the MyDietAnalysis reports that you have already submitted in Part A. I have attached these reports 4 total which were based on the 3 day food intake entered Part C (due July 10): Prepare a detailed report to discuss how your intake compares
  • 91. to recommended goals. This report is based on the MyDietAnalysis reports. I have attached these reports 4 total which were based on the 3 day food intake entered You will submit Part B, and Part C as separate assignments. Part B and Part C This Assignment is essentially, your final project for this course. Be sure to put time and effort into it. The Dietary Analysis Assignment is designed to help you assess your own personal dietary patterns and food choices and make recommendations for improvement. This part of the assignment is based on the reports you created for Part A. You should spend some time analyzing your diet with My Diet Analysis tool. Use the data you reported in Part A. Look at the four reports you submitted in Part A. Answer the following questions. Your answers should be thorough and include SPECIFIC insights about your results. Show that you have spent some time at MyDietAnalysis website and provide specific details! 1. Use THIS https://www.choosemyplate.gov/nutrition- nutrient-density page and “All Nutrients Spreadsheet” report to answer these questions. Look at the "Calories" and "Saturated Fat Calories" columns to see the details. a) Define “nutrient density” (review the information on p.41-42 in your textbook). b) What 2 specific foods that you ate were the most nutrient dense? Explain WHY you think so. c) Which 2 foods were the least nutrient dense? Explain WHY you think so. 2. Using “My Plate” report, list specific foods that you could change (add, delete,
  • 92. prepare differently, etc.) in order to make your day’s intake meet the MyPlate requirements in any 2 groups of the recommendations. What groups would you like to change? If you have met the recommendations, discuss further whether you would benefit from changing your diet. Be VERY SPECIFIC about amounts and foods to add or subtract in order to meet your MyPlate recommendations. For example, if you were over the meat/protein recommendation by 3 oz., you could say something like “I could have 1 less egg for breakfast and 2 fewer ounces of chicken for dinner in order to bring my meat group