SlideShare a Scribd company logo
1 of 308
Organizing warehouse
management
N. Faber
Netherlands Defence Academy, Breda, The Netherlands, and
M.B.M. de Koster and A. Smidts
Rotterdam School of Management,
Erasmus University, Rotterdam, The Netherlands
Abstract
Purpose – The purpose of this paper is to investigate how
warehouse management, understood as a
cluster of planning and control decisions and procedures, is
organized and driven by task complexity
(TC) and market dynamics (MD).
Design/methodology/approach – A multi-variable conceptual
model is developed based on the
literature and tested among 215 warehouses using a survey.
Findings – The results suggest that TC and MD are the main
drivers of warehouse management,
measured by planning extensiveness (PE), decision rules
complexity, and control sophistication.
Differences between production and distribution warehouses are
found with respect to the relationship
between assortment changes and PE. Furthermore, TC appears
to be a main driver of the specificity of
the warehouse management (information) system (WMS).
Research limitations/implications – This paper is based on 215
warehouses in The Netherlands
and Flanders (Belgium); future research may test the model on a
different sample. More research
should be conducted to further validate the measures of the core
dimensions of warehouse
management.
Practical implications – Different levels of TC and MD
characterize warehouses. Such a
characterization is a first step in determining generic warehouse
functionalities and helping managers
to decide on the best software for their warehouse operations.
Originality/value – The paper defines the core dimensions of
warehouse management, makes them
measurable, tests them and assesses how these drivers impact
specificity of WMS. The paper shows
that PE in production warehouses is driven by different
variables than in distribution centers.
Keywords Logistics, Survey, Conceptual framework, Empirical,
Information management,
Operations planning
Paper type Research paper
1. Introduction
The warehouse is today playing a more vital role than it ever
has in the success
(or failure) of businesses (Frazelle, 2002). Warehouses play a
critical intermediate role
between supply chain members, affecting both supply chain
costs and service (Kiefer
and Novack, 1999). In an attempt to rationalize supply chain
processes and to manage
them more efficiently, many companies have set up centralized
production and
warehouse facilities over the last decades (HIDC/BCI, 2001).
This has resulted in larger
warehouses responsible for the distribution to a greater
diversity of more demanding
The current issue and full text archive of this journal is
available at
www.emeraldinsight.com/0144-3577.htm
The authors gratefully acknowledge Michael Murtin, Emile
Bouwman, Sanne van Rhenen,
Wessel Koning and Sebatiaan Ruys for their hard work in
collecting data (via the telephone) for
this study.
Received 14 December 2011
Revised 30 March 2012
14 June 2012
Accepted 17 September 2012
International Journal of Operations &
Production Management
Vol. 33 No. 9, 2013
pp. 1230-1256
q Emerald Group Publishing Limited
0144-3577
DOI 10.1108/IJOPM-12-2011-0471
IJOPM
33,9
1230
customers in a vaster region and, consequently, with more
complex internal logistic
processes (see the survey of ELA/AT Kearney, 2005).
As a consequence, managing complex warehouses effectively
and efficiently has
become a challenging task. An important question therefore is
how warehouse
management, as a cluster of planning and control decisions and
procedures, is organized
in order to meet today’s challenges. Warehouse management
encompasses the control
and optimization of complex warehouse and distribution
processes (Ten Hompel and
Schmidt, 2006), and it depends on the tasks to be performed and
on the market the
warehouse operates in. In the area of production management, it
is commonly accepted
that the produced volume and product variety (i.e. task
complexity) and the rate of
change of the external environment (i.e. market dynamics) are
the main drivers of the
planning and control structure (Bertrand et al., 1990; De Toni
and Panizzolo, 1997; Hatch,
1997; Peterson and Silver, 1979; Van Assen, 2005). However,
systematic research into the
drivers of the warehouse planning and control structure seems
to be lacking.
Rouwenhorst et al. (2000) and Gu et al. (2007, 2010) conclude
in their reviews of
warehouse management literature that analysis-oriented
research on isolated
subproblems is dominant in the current warehouse management
literature. This
study takes the first step in exploring the drivers of warehouse
management.
Warehouse processes that need to be planned and controlled
include: inbound flow
handling, product-to-location assignment, product storage,
order-to-stock location
allocation, order batching and release, order picking, packing,
value-added logistics
activities, and shipment (Ackerman and La Londe, 1980;
Frazelle, 2002). Particularly
storage and order picking are complex, often labor-intensive
processes that determine
warehouse performance to a large part.
Our first contribution is to define and make measurable the core
characteristics of
warehouse management. To the best of our knowledge, there is
currently hardly any
literature that clearly captures warehouse management as a
coherent whole. Because
this study is just a first step in exploring the dimensions of
warehouse management,
we consider warehouse management at a high level of
aggregation. We propose and
define the constructs necessary to do this, focusing on both
planning and
control activities within the warehouse and on the decision rules
used to schedule
and optimize the inbound, storage, and retrieval processes in the
warehouse.
Second, we establish and test the drivers of warehouse
management. Following the
literature on production systems (Van Assen, 2005), we
distinguish task complexity and
market dynamics as the main drivers of the warehouse planning
and control activities
and of the decision rules used. Task complexity measures the
depth and breadth of
the tasks a warehouse has to perform and is internally oriented.
Market dynamics
measures the rate of change of the external environment in
which a warehouse operates.
In general, we expect that a more complex warehouse task
results in more complex
decision rules for scheduling and optimizing inbound, storage,
and outbound activities.
Warehouse planning and control depends both on the
complexity of the warehouse task
and on the dynamics of the market. We test these propositions
in our study.
Our third contribution relates to a specific aspect of warehouse
management: the
warehouse management (information) system (WMS).
Information systems play a
significant role in managing complex processes (LeBlanc,
2000). We assess the degree
to which the drivers of warehouse management impact the
specificity of the
information system. Establishing the dependency of the WMS’s
specificity on these
Organizing
warehouse
management
1231
drivers may help managers to decide on the most effective
information system to suit
the warehouse management’s needs. Since many standard
warehouse management
software systems are available on the market (Loudin, 1998;
Randal, 1999), selecting
one can be a difficult task.
We carried out a survey to test our theory and collected data on
215 warehouses and
distribution centers in The Netherlands and Flanders (Belgium).
Warehousing is of
particular importance to The Netherlands and Flanders due to
their geographical
location with deep-sea ports (Rotterdam and Antwerp), major
European air-cargo hubs
(Schiphol and Zaventem), and direct connections via water
(barge and short-sea), road,
and rail to a large part of industrial Europe. More than half of
all European Distribution
Centers (EDCs) are located in this region (BCI, 1997;
HIDC/BCI, 2001; Kuipers, 1999). The
level of performance of warehousing operations in the region is
generally high,
represented in high labor productivity and low error rates
(OECD, 2006). High costs of
land and labor, and increasing labor shortages are forcing
companies to invest in people
and automation systems with a relatively long-term investment
horizon.
The organization of this paper is as follows. In Sections 2 and
3, we develop our
constructs and formulate our hypotheses. In Section 4, we
describe our research
methodology, including the sample selection and data collection
approaches and the
measures of the constructs. Section 5 describes the results of
the data analysis and
hypotheses testing. Section 6 concludes the paper.
2. General framework for warehouse management
2.1 Warehouse management
Analogous to production management (Bertrand et al., 1990),
the objective of warehouse
management is to efficiently and effectively coordinate all
warehouse processes and
activities (Harmon, 1993; Tompkins et al., 2003). Warehouse
management includes all
planning and control procedures to operate the warehouse.
Planning and control is
concerned with managing the ongoing activities of the
operations so as to
satisfy customer demand (Slack et al., 2001). The main purpose
of planning and
control is to ensure that operations run effectively and produce
products and services as
they should (Slack et al., 2001). Whereas planning involves
deciding what should be done
and how, control is the process of ensuring that the desired
output (plan) is obtained
(Anthony and Young, 1984; Van Goor et al., 2003). Planning is
therefore proactive and
control is reactive. Together, plans and controls regulate
outputs. Within planning, we
distinguish a tactical and an operational level. At the tactical
decision level, warehouses
draw up plans to make efficient use of resources and to fulfill
market demand. However,
due to the highly dynamic environment, for many warehouses
the tactical planning
horizon is only days or weeks rather than months. At the
operational level, decision rules
are used to sequence, schedule, and optimize planned activities
(Slack et al., 2001).
In the literature, the dimensions of warehouse management have
not yet been
explored. Based on the above literature and interviews with
experts, we propose to
broadly define warehouse management as a combination of the
planning and control
systems and the decision rules used for inbound, storage, and
outbound flows. We now
consider each aspect in more detail.
Tactical planning system. A plan is a formalization of what is
intended to happen at
some time in the future (Slack et al., 2001). Plans or norms
specify a desired output
(expressed in quantity, quality, cost, timing, etc.) at some future
time. The most
IJOPM
33,9
1232
important tactical issues in warehouses include: stock planning,
storage-location
assignment planning, transport planning, and capacity
(personnel and equipment)
planning. For a comprehensive overview of these and other
planning processes, see
Van den Berg (1999) and Van den Berg and Zijm (1999).
Stock planning decides which products are kept in storage in
what quantities, and
determines when shipments arrive. Intelligent stock planning
may reduce warehousing
costs. Storage location planning decides the location types (for
example, shelf, pallet,
high-bay or block-stack) and the zones within these storage
areas where the products
will be stored. An effective storage-location assignment plan
may reduce the need for
space and the mean travel time for storage/retrieval and order
picking. Capacity
planning and transport planning determine the required
personnel, equipment, and
transport capacities.
Making such tactical plans is time consuming and should only
be done if they lead
to performance improvements. Therefore, the number of tactical
plans may vary
per warehouse. We define the construct planning extensiveness
by the number of
tactical plans a warehouse explicitly draws up.
Inbound, storage and outbound decision rules. Tactical plans
determine which
products arrive in what quantities, where these should be stored
and how much
personnel, equipment, and transport is needed to process the
products and orders.
Tactical plans define a framework for the operational planning
level (Van den Berg,
1999). Operational decisions typically deal with the sequencing,
scheduling, and
routing of order picking and storage/retrieval operations. There
are many different
rules that can help operations make these decisions and improve
performance
(Chen et al., 2010; Rouwenhorst et al., 2000). For an overview
of decision rules focusing
on storage and order picking, see De Koster et al. (2007) or
Wäscher (2004).
The complexity of the decision rules implemented in a
warehouse differs
per warehouse. Complexity is a well-defined construct in
management literature (Alter,
1999; Hatch, 1997; Huber, 1984). The complexity of a system
depends on the number of
differentiated components of the system, the number of
interacting components, and
the nature of the interaction between components (Alter, 1999).
We therefore define the
construct decision rules complexity as the number of different
types of decision rules
used for inbound, storage, and outbound activities and the
perceived complexity of
these rules.
Control system. When plans are implemented, things do not
always happen as
expected (Slack et al., 2001). For example, customers may
change their minds about
what they want and when they want it, suppliers may not deliver
on time, machines
may fail, inventory records may be inaccurate, and staff may be
absent due to sickness.
Control is the process of coping with these changes (Slack et
al., 2001). It relates to the
feedback and corrective action function of the management
system. By monitoring
what actually happens and making the necessary changes,
control makes the
adjustments which allow operations to achieve the objectives
that were laid down in
the plan (Slack et al., 2001).
Thus, monitoring, analyzing, reporting and intervening are core
functions of the
control system. For this purpose, information about the progress
and realization of the
plans is essential (Anthony and Young, 1984). The time to
respond to deviations and
changes is limited. Therefore, in this study, we consider the
speed at which data
is transformed into information by the control system as the
most important
Organizing
warehouse
management
1233
dimension of control. Accurate and timely information on the
shop floor is essential
to control operations.
Information can be recorded and presented on paper, online, or
in real-time if
radio-frequency technology is used with mobile terminals and
scanners, or with voice
response. As the speed of the transformation of data into
information increases, the
control system becomes more sophisticated. However, the
degree of sophistication of the
control system must be justified economically, i.e. the higher
accuracy and the lower
stock-outs must outweigh the extra costs of the control system.
As a consequence, the
sophistication of the control system differs per warehouse. We
define the construct
control sophistication as the speed of transforming data into
information used by
warehouse employees to decide and act upon.
Based on the above-mentioned dimensions of warehouse
management, we define
warehouse management as a combination of planning
extensiveness, decision rules
complexity, and control sophistication.
2.2 Warehouse management (information) system
In most warehouses, information systems support warehouse
management. Such
information systems can be either built specifically for a
warehouse (tailor-made) or
bought off-the-shelf (standard software package). Software is
primarily focused on
broad or specific functionality (Lynch, 1985). A software
product with broad
functionality supports a large number of different processes in
an organization (e.g. an
ERP system). Although ERP systems can be configured to the
customer’s processes, the
fine-tuning is complex (Somers and Nelson, 2003) and
configuring the system involves
making compromises and has its limits (Davenport, 1998).
Software products with
specific functionality support a smaller number of processes in
an organization but with
more intensity (e.g. WMS). The specificity of the information
system will differ per
warehouse. We define the construct information system
specificity by distinguishing six
different types of information systems with an ascending degree
of specificity.
2.3 Drivers of warehouse management
The basic premise of our study is that the best approach to
warehouse management
depends on the specific characteristics of the warehouse.
Traditional contingency
theorists such as Burns and Stalker (1961) and Lawrence and
Lorsch (1967) suggest
that effectiveness derives from structuring an administrative
arrangement appropriate
to the nature of an organization’s environment. In the
operations management literature,
it is also a generally accepted assumption that the
environmental context influences
the appropriateness of the organization of the planning and
control system (Sousa and
Voss, 2008). Van Goor et al. (2003) state that the characteristics
of the market, the
products, and the processes determine the way supply chains are
managed; and
according to Fisher (1997) and Lee (2002), the choice of a
supply chain control depends on
the product type and the predictability of the market.
The need to consider the environmental context is obvious and
widely accepted in
literature. With regard to warehouse management, the
environment refers to the
immediate operating environment that is beyond the control of
management in the short
run. Therefore, we decided to concentrate on narrowly defined
parts of the environment
rather than overall industry parameters. Analogous to Van
Assen (2005), in this study,
IJOPM
33,9
1234
the warehouse operations environment consists of the external
warehouse environment
(i.e. the market) and the internal warehouse system.
The core concept that captures the effects of the organization’s
environment on its
performance is uncertainty (Thompson, 1967). Researchers in
organizational theory
identify two major dimensions of uncertainty: complexity and
dynamism (Duncan, 1972;
Hatch, 1997; Miller and Friesen, 1983; Premkumar and Zailani,
2005). Complexity refers
to the number and diversity of the elements in an environment
(Hatch, 1997). The
warehouse system can be characterized by the products (SKUs)
that have to be stored
and picked, the processes to store and pick these products, and
the orders that request
the delivery of these products. Complexity increases as the
number and diversity of
SKUs, order lines, and processes increase. In general, if the
number of SKUs increases,
more storage space (often different type and control logic) will
be needed and more
products have to be registered and managed in the warehouse
information system. Some
warehouses have a greater number and/or variety of processes
and some of these
activities are labor intensive and have substantial impact on
order throughput time. The
number of order lines is a good indicator for the total amount of
work in order picking
and thereby for the total amount of work to be done in the
warehouse. In general,
the majority of warehouse work is in order picking (Drury,
1988). We conceptualize
environmental complexity with regard to warehouse
management as the complexity of
the task a warehouse has to perform. Thus, we define the
construct task complexity by:
. the number of different products (SKUs) handled in the
warehouse;
. the number and variety of the processes carried out by the
warehouse; and
. the number of order lines processed by the warehouse per day.
Task complexity affects warehouse management through the
comprehensibility of the
work to be done.
Environmental dynamism is characterized by the rate of change
and technology
innovation in the industry as well as the uncertainty or
unpredictability of the actions of
competitors and customers (Burns and Stalker, 1961; Lawrence
and Lorsch, 1967;
Thompson, 1967). At the level of the immediate operating
environment, warehouse
management interacts directly with customers. Other factors
relevant to the warehouse’s
goal setting, such as competitors, suppliers, government,
technology, economy, and labor
have a less direct influence on warehouse management and, for
this reason, are not
considered in this study. We conceptualize environmental
dynamism with regard to
warehouse management as the dynamism in the customer
market. We define the
construct market dynamics by:
. the unpredictability of market demand; and
. the rate of change in the taste and preference among
customers.
Unpredictability of market demand refers to the difficulty of
forecasting customer
behavior (Khandwalla, 1977). It is difficult to know just how
customers will react to
very new products and services, and to anticipate the various
problems that might
occur. The rate of change in customers’ preferences refers to the
turbulence of the
market. Warehouses that operate in more turbulent markets are
likely to have to
continually modify their products and services in order to
satisfy customers’ changing
preferences. A dynamic market also manifests itself in frequent
assortment changes.
Organizing
warehouse
management
1235
Market dynamics affects warehouse management through the
predictability of
the work to be done.
The consideration of task complexity and market dynamics
provides a sound
starting point to study the drivers of warehouse management.
Our full research model
is shown in Figure 1. Task complexity and market dynamics are
expected to strongly
affect how warehouse management is organized. The
organization of warehouse
management takes shape in three dimensions (planning
extensiveness, decision rules
complexity, control sophistication), and is reflected in
warehouse management’s
information system specificity.
It should be noted that warehouse management is not solely
determined by these
two main drivers. In reality, many other elements must be in
place for warehouse
management to be successful. These include an educated and
well-trained workforce,
appropriate alliances with customers and suppliers, well-
designed strategic planning
processes, well-designed lay-out and systems, well-designed
work processes, etc. Task
complexity and market dynamics were selected for this study
because they play a key
role in designing and managing warehouse systems.
To our knowledge, the relationship between the dependent
constructs planning
extensiveness, decision rules complexity, control sophistication,
and information
system specificity and the independent constructs task
complexity and market
dynamics has not been addressed in the literature.
3. Hypotheses
The task a warehouse has to perform is complex if the number
of SKUs, process
diversity, and number of daily order lines are high. As the
complexity of a system
Figure 1.
Research model
Warehouse Management
Structure
Task Complexity
Number of SKUs
Planning Extensiveness
Number of plans
Decision Rules Complexity
Market Dynamics
Process Diversity
Number of order lines
Control Sophistication
Speed of transformation of information
Number of different types of decision rules
Nature of decision rules
• Demand Unpredictability
•
•
•
•
Assortment Changes
Warehouse Management
(Information) System
Information System Specificity
•
•
•
•
IJOPM
33,9
1236
increases, managing the system becomes harder (Van Assen,
2005). Each resource has
to be aligned to perform the warehousing activities. This can be
done efficiently only if
the resources and the relationships between these resources are
coordinated in a timely,
complete, and reliable fashion (Van Assen, 2005). This means
that tactical and
operational planning is necessary. The first hypothesis of our
study is:
H1. The more complex the warehouse task, the more extensive
the planning.
It can be expected that the decision rules (i.e. operational plans)
used to schedule and
optimize activities in the warehouse will be complex when the
task is complex. For
example, a large number of SKUs generally implies that many
of them will need
different storage and order picking logic and conditions (think
of size, weight, physical
condition, packaging, and product carriers like totes or pallets),
all laid down in
decision rules. If the number of SKUs, process diversity, and
number of order lines is
small, we expect the decision rules to be simple. The second
hypothesis of our study is:
H2. The more complex the warehouse task, the more complex
the decision rules.
If the warehouse task is complex, the organizational structure
can be adapted to deal
with this (Espejo and Watt, 1988), and management may
delegate responsibilities
downward in the organization to reduce complexity (Mintzberg,
1983). However, the
lower levels of the organization have to justify their decisions
by regularly reporting
progress and results to management. We therefore expect a more
complex warehouse
task to require more comprehensive and thus, more
sophisticated instruments to
control the task. The third hypothesis of our study is:
H3. The more complex the warehouse task, the more
sophisticated the control system.
Based on a sample of 20 production and distribution
warehouses, Faber et al. (2002) found
that complex warehouses (measured by the number of order
lines processed per day and
the number of active SKUs), use tailor-made software solutions
whereas simple
warehouses use standard software solutions to support
warehouse management. Hence
we expect that if the warehouse task is complex, a standard
software solution will
be difficult to find because the situation is too specific. In such
situations, only a tailor-made,
specific solution or a standard, specific software package with
substantial customization
will be effective. A simple warehouse task can be supported by
standard, broad solutions or
even by no automated information system. The fourth
hypothesis of our study is:
H4. The more complex the warehouse task, the more specific
the functionality of
the information system.
Major characteristics of a dynamic market are demand
unpredictability (DU) and
frequent assortment changes. Extensive tactical planning is not
effective in a highly
dynamic environment because plans have to change constantly.
Short-term planning
or coordination by feedback (Perrow, 1967), i.e. negotiated
alterations in the nature or
sequence of tasks, would be more effective in this situation. In
contrast, if the market is
stable, extensive planning is advisable in order to make
efficient use of warehouse
resources (personnel, machines, transport, and stock locations)
and to minimize stock.
These arguments lead to the fifth hypothesis of this study:
H5. The more dynamic the market of a warehouse, the less
extensive the planning.
Organizing
warehouse
management
1237
As decision rules are internally oriented, externally driven
unpredictability of demand
and assortment changes will have much less influence on the
complexity of decision
rules. Thus, we do not propose an influence of market dynamics
on decision rules
complexity.
Some operations are reasonably predictable and usually run
according to plan.
In these situations, the need for control is minimal (Slack et al.,
2001). Dynamism affects
the reliability of the information and the assumptions that are
used in planning. The
higher the rate of change, the more momentarily available
information is (Van Assen,
2005). The internal reporting system has to process and deliver
information rapidly to
keep up with changes. Also, in a dynamic market, online
information exchange with
partners (suppliers and/or customers) in the supply and demand
chain is needed to
respond to market changes. The sixth hypothesis of our study is,
therefore:
H6. The more dynamic the market of a warehouse, the more
sophisticated the
control system.
The H6 of this study are shown in Figure 2. All hypotheses are
directional, which
means the relationships are positive or negative. We carried out
a survey to test our
hypotheses.
4. Method
4.1 Data collection and sample
Data were collected by means of a survey among warehouse
managers. The final
questionnaire consisted of 55 questions divided into ten sections
(general data,
warehouse type, assortment, order lines, processes, market
situation, planning, decision
rules, control, and information systems). The questionnaire was
extensively pre-tested
for clarity and for assessing the length of the interview. A face-
to-face pretest with two
warehouse managers of different warehouses indicated that we
had to improve the
wording of a number of questions and response categories. Later
on, we tested the
Figure 2.
Hypotheses
Warehouse Management
StructureH5
Task Complexity
Planning Extensiveness
Decision Rules Complexity
–
+H1
H2 +
Control Sophistication
Warehouse Management
(Information) System
H3
H6
+
+
Market Dynamics
Information System Specificity
H4 +
IJOPM
33,9
1238
improved questionnaire by telephone on two other warehouse
managers representing
two more warehouses. This led to some minor changes in the
questionnaire.
A single database on warehouses in The Netherlands does not
exist. We aimed at a
complete representation of medium and large warehouses. We
constructed a database
by cooperating with HIDC, the Holland International
Distribution Council, who owns a
database of all multinational warehouse operations in The
Netherlands (HIDC/BCI,
2001). We extended the database with the membership lists of
well-known logistics
associations in The Netherlands (www.NDL.nl,
www.FENEX.nl, IMCC and VLM) and
Flanders (Belgium) (www.VIL.be,
www.warehouseandlogisitcs.com and www.bruca
rgo.be). All, except two of these lists, were available on the
internet. The remaining two
were disclosed at our request. The database was further
completed with recent lists of
attendees of workshops and conferences on warehouse
management. We targeted
warehouses representing various industry sectors, with different
positions in the
supply chain (varying from production-related warehouses, i.e.
storing not only
finished products but also raw materials and components – to
wholesale and retail
warehouses), and different outsourcing relations. After
eliminating duplicate listings
and incomplete addresses, our sample population consisted of
765 warehouses, which
provides good coverage of the medium and larger warehouses in
The Netherlands and
Flanders. These warehouses were approached in two waves.
The first wave of 250 warehouses gathered from the HIDC
database and lists of
attendees of workshops and conferences was contacted by
telephone and asked to
collaborate. Obtaining answers to the questions was an
elaborate job. For one thing, the
targeted managers were very busy, and a single contact
sometimes required about three
to four calls to complete the questionnaire (several calls were
required to ensure that the
managers had prepared the questionnaire which contained many
questions on factual
data). 101 warehouses were willing to participate. The most
often-heard argument for
non-response was that the questionnaire was too time
consuming.
Due to the rather small absolute sample size of the first wave, in
the second wave, we
approached 515 warehouses, based on the membership lists of
logistics associations in
The Netherlands and Flanders, by sending a cover letter and the
questionnaire by e-mail.
Two steps were taken to increase response. First, the survey
instrument and process
were made as user friendly as possible by using various media,
i.e. a web-based
questionnaire on the internet, an electronic questionnaire, and a
hardcopy. Second, we
approached all non-responding addressees a second time by e-
mail. The most
often-heard argument for non-response was lack of time. In the
second wave,
114 warehouses filled in the questionnaire. If deemed
necessary, follow-up calls were
made to verify responses, solve ambiguities, or to ask the
respondent to check objective
data. After carefully checking the responses of both waves for
completeness and
eligibility, 215 completed questionnaires could be used for this
study, representing a
response rate of 28 percent. Given the low response rates for
surveys in the logistics
industry in general (Muilerman, 2001), this response rate is
good.
Because the respondents represent an organization, they must be
knowledgeable about
the main constructs (Huber and Power, 1985). We requested a
logistics or warehousing
executive, preferably the warehouse manager, to complete the
questionnaire. The
warehouse manager is probably one of the few people with
sufficient knowledge about the
data in our questionnaire. For this reason, we had to use a single
respondent. Table I shows
that we were quite successful in contacting the preferred
informant: 85 percent of the
Organizing
warehouse
management
1239
respondents are senior warehouse managers and 15 percent are
logistics staff members.
Table I also shows other demographic data such as warehouse
types, general industry
classification, and number of warehouse employees.
Table I shows that our sample covers a wide variety of
industries, from automotive
to retail, and it represents all types of warehouses. The average
number of full-time
direct employees is 78, the average number of stored SKUs per
warehouse in our
sample is 14,000, and the average number of shipped order lines
is over 10,000 per day.
Although our research is limited to The Netherlands and
Flanders, warehousing
practices in these regions are not different from elsewhere in
Western Europe. In fact,
many companies run multiple similar facilities elsewhere in
Western Europe
(Quak and De Koster, 2007). Overall, we conclude that the
response is large enough
and sufficiently diverse to draw meaningful conclusions for
medium and large
warehouses.
4.2 Measures
Keller et al. (2002) provide a directory of all multi-item scales
published in leading
logistics journals from 1961 to 2000. Most scales for the
constructs included in this study
were not available in the literature. Hence, we developed our
own measures for these
constructs. An important issue in this regard is whether
constructs are considered
reflective or formative (Diamantopoulos and Winklhofer, 2001).
The choice of
Respondent’s
position %
Type of
warehouse % Sector %
Number of
warehouse
employees %
Senior
manager
85.1 Production
warehouse
10.2 Automotive 5.6 , 10 14.0
Logistics
staff
14.9 Distribution
center
insourced
58.1 Healthcare 3.3 11-20 15.8
Distribution
center
outsourced
31.7 Pharmaceutical 3.3 21-30 13.0
Defence/police 4.2 31-50 13.5
Foodretail 5.1 51-70 10.7
Agricultural products/
food products
7.4 71-100 10.2
Information and
communication
technology
11.2 101-160 11.2
Industrial products 18.1 161-250 6.0
Other products
(mainly consumer
products)
28.4 251-370 1.9
Public warehouses 13.5 371-520 2.3
520-700 1.4
Total 100 Total 100.0 Total 100.0 Total 100.0
Mean 78
SD 106
Note: n ¼ 215
Table I.
Sample description
IJOPM
33,9
1240
a formative versus a reflective specification depends on the
causal priority between the
measurable items and the latent variable ( Jarvis et al., 2003).
In operationalizing the constructs of our study, we closely
followed the
recommendations of Churchill (1979) and particularly Rossiter
(2002), who updates
and elaborates the Churchill paradigm of scale development.
Each construct was defined
and four experts in the domain of warehouse management (two
academics and two
warehouse managers) provided specific items to measure these
constructs. After several
discussion rounds, our experts concluded that all constructs in
our study are formative.
Fundamental to formative constructs is that all items of the
construct contribute to the
construct; omitting an item is omitting a part of the construct.
Therefore, we kept items
in our construct even if they did not correlate strongly with
other items in that particular
construct. The resulting indicators per construct are presented
and discussed below.
A compilation of the constructs and their measures is
summarized in Appendix.
Task complexity is measured by summing up the standardized
scores of:
. Number of SKUs (TCa). This variable is measured as the log
of the number of
SKUs since the effect of the number of SKUs on task
complexity is expected to be
skewed (Faber et al., 2002; De Koster and Balk, 2008).
. Process diversity (TCb). Following Faber et al. (2002) and
Schoenherr et al. (2010),
this variable is measured by both the number of special
processes and the number of
modes in which processes can be carried out in the warehouse.
Instead of measuring
the number of all the different processes, we only measure the
number of special
processes. Nearly all warehouses perform processes such as
receiving, storage,
internal replenishment from bulk to pick areas, order picking,
and shipping, but
some warehouses also perform special processes. Examples
include product
repacking, return handling, customs clearance, cycle counting
for stock integrity,
cross-docking, and value adding activities. We measure the
number of special
processes on a binary scale with five special processes as a split
value; five is a fairly
large value since most warehouses have at least some special
processes. Warehouse
processes can be carried out in different modes. For example,
storing products in a
shelf area differs substantially from storing products in a pallet
area with regard to
procedures, product carriers, and material-handling equipment
used. The same is
true for order picking in such areas. Complexity is driven by the
average number of
modes in which processes are carried out. We measure this
average number of
modes on a binary scale with three as a split value; three is a
relatively small value,
justified by a low average number of modes per process in most
warehouses.
. Number of order lines (TCc). This variable is measured as the
log of the number
of order lines since the effect of the number of order lines on
task complexity is
expected to be skewed (Faber et al., 2002).
To measure market dynamics (MD), we used Miller and
Friesen’s (1983) perceptual
measures for dynamism. Here, market dynamics is measured as
the sum of the
standardized scores of:
. Demand unpredictability (DU). This variable is measured as
the sum score of
three questions asking for perceived demand predictability in
the very short, in
the short, and in the long-run, each measured on a three-point
scale (predictable,
limited predictability, and difficult to predict).
Organizing
warehouse
management
1241
. Assortment changes (AC). The frequency and amount of
assortment change is
measured on a three-point scale (hardly, to a limited extent, and
to a great extent).
Warehouse management structure is measured by three
constructs:
(1) Planning extensiveness (PE). We measure this construct by
the number of
tactical plans that are explicitly drawn up in the warehouse
(ranging from 0 to a
maximum of four plans).
(2) Decision rules complexity (DC). We measure the number of
different types of
decision rules (DCa) by counting activities that are
systematically executed
using decision rules. We distinguished 12 activities (see
Appendix for the full
list). We measure the nature of the decision rules (DCb) by
asking the
respondent’s opinion on the perceived complexity of both
inbound and
outbound rules, each measured on a three-point scale (ranging
from simple to
complex). The score for decision rules complexity is obtained
by summing the
standardized scores of both parts (DCa, DCb).
(3) Control sophistication (CS). This construct is measured by
two indicators: the
sophistication of the internal reporting system and the online
information
exchange with partners (using, e.g. EDI). The sophistication of
the reporting
system is the degree to which data in a warehouse are recorded
and monitored
online (CS1, CS2), and the reaction time to unforeseen
situations (CS3). The
aspects are all measured on a binary scale. Online information
exchange
(scheduling information, plans, orders, etc.) with business
partners is the degree
of online information sharing with suppliers and customers,
respectively, on a
yes/no scale (CS4, CS5). The total score is the sum of all
aspects of the reporting
system and online information exchange with partners.
Information system specificity (IS). This is measured by
distinguishing six different
types of information systems with an ascending degree of
specificity, ranging from no
automated system to a tailor-made system (see Appendix for
precise levels).
At the construct level, we assume all subdimensions to
contribute equally to a
construct.
5. Results
To assess the relationship between warehouse characteristics
and warehouse
management, we performed a series of regression analyses. The
correlations between
the variables specified in Table II are the input for the
regressions. The results are shown
in Table III. The regressions were conducted both at the
construct level (see results on
upper part of Table III) and at the subdimension level (results
on lower part of Table III).
At the subdimension level, we conducted stepwise regression
among the five
independent variables and we present results only for variables
for which p , 0.10
(two-tailed). We chose a higher p-value because of the
exploratory character of this
study. We also tested for interaction effects between the main
constructs. These turned
out to be not significant for any of the dimensions of warehouse
management.
H1 predicted a positive relationship between task complexity
and planning
extensiveness, whereas H5 predicted a negative relationship
between market dynamics
and planning extensiveness. The results in Table III confirm a
significant and positive
effect of task complexity (standardized regression coefficient
beta ¼ 0.29, p , 0.001)
IJOPM
33,9
1242
T
C
T
ca
T
C
b
T
C
c
M
D
D
U
A
C
P
E
D
C
C
S
IS
T
a
sk
co
m
p
le
x
it
y
(T
C
)
1
.0
0
L
o
g
n
o
.
o
f
S
K
U
s
(T
C
a
)
0
.8
1
*
1
.0
0
P
ro
ce
ss
d
iv
er
si
ty
(T
C
b
)
0
.6
6
*
0
.3
3
*
1
.0
0
L
o
g
n
o
.
o
f
o
rd
er
li
n
es
(T
C
c)
0
.7
2
*
0
.4
5
*
0
.1
2
1
.0
0
M
a
rk
et
d
y
n
a
m
ic
s
(M
D
)
0
.0
8
0
.0
9
*
*
0
.1
4
*
*
*
2
0
.0
4
1
.0
0
D
em
a
n
d
u
n
p
re
d
ic
ta
b
il
it
y
(D
U
)
2
0
.1
7
*
*
*
2
0
.0
5
0
.0
3
2
0
.3
4
*
0
.7
0
*
1
.0
0
A
ss
o
rt
m
en
t
ch
a
n
g
es
(A
C
)
0
.2
9
*
0
.1
8
*
*
0
.1
6
*
*
*
0
.2
8
*
0
.7
0
*
2
0
.0
3
1
.0
0
P
la
n
n
in
g
ex
te
n
si
v
en
es
s
(P
E
)
0
.2
8
*
0
.0
7
0
.1
8
*
*
0
.3
8
*
2
0
.1
0
2
0
.2
7
*
0
.1
2
1
.0
0
D
ec
is
io
n
ru
le
s
co
m
p
le
x
it
y
(D
C
)
0
.4
4
*
0
.2
8
*
0
.2
8
*
0
.3
9
*
2
0
.0
1
2
0
.1
4
*
*
*
0
.1
2
0
.3
5
*
1
.0
0
C
o
n
tr
o
l
so
p
h
is
ti
ca
ti
o
n
(C
S
)
0
.2
1
*
*
0
.1
8
*
*
0
.1
4
*
*
*
0
.1
4
*
*
*
0
.0
7
0
.0
0
0
.0
9
0
.1
1
0
.2
7
*
1
.0
0
In
fo
rm
a
ti
o
n
sy
st
em
sp
ec
ifi
ci
ty
(I
S
)
0
.3
3
*
0
.1
8
*
*
0
.2
2
*
0
.3
5
*
0
.0
8
2
0
.0
3
0
.1
4
*
*
*
0
.1
8
*
*
0
.2
3
*
0
.2
3
*
1
.0
0
n
2
1
2
2
1
5
2
1
5
2
1
2
2
1
3
2
1
4
2
1
4
2
1
5
2
1
5
2
1
2
2
1
3
M
in
.
2
2
.5
5
1
.3
2
1
.1
8
2
1
.8
6
3
1
0
2
1
.6
6
5
0
M
a
x
.
2
.0
2
5
.4
1
4
5
.3
2
.0
3
9
3
4
2
.4
2
1
0
5
M
ea
n
0
3
.6
3
2
.9
8
3
.1
6
0
5
.7
4
2
.4
8
2
.6
3
0
7
.6
6
2
.7
1
S
D
1
0
.7
4
0
.8
0
.9
2
1
1
.7
4
0
.5
4
1
.2
2
1
1
.4
8
1
.8
N
o
te
:
S
ig
n
ifi
ca
n
t
a
t:
*
p
,
0
.0
0
1
,
*
*
p
,
0
.0
1
,
*
*
*
p
,
0
.0
5
Table II.
Correlations
Organizing
warehouse
management
1243
and a negative effect of market dynamics (b ¼ 20.14, p , 0.038).
Table III shows that
task complexity and market dynamics explain approximately 10
percent of the variance
in planning extensiveness. However, the regression analysis in
the lower part of Table III
shows that 21 percent of the variance in planning extensiveness
is explained by the
subdimensions. Especially “number of order lines” has a strong
positive effect on
planning extensiveness.
A detailed examination of the relationship between market
dynamics and planning
extensiveness indicates that the two subdimensions of market
dynamics appear to work
in opposite directions. As expected, the subdimension “demand
unpredictability” has a
significant negative effect on planning extensiveness
(correlation ¼ 20.27, p , 0.001,
Table II), which means that if demand is more difficult to
predict, planning will be less
extensive. Contrary to our expectation, the subdimension
“assortment changes” appears
to affect planning extensiveness marginally positively
(correlation ¼ 0.12, p , 0.074,
Table II). This means that if the assortment of the warehouse
changes often, tactical
planning will be more extensive. This result seems to suggest
that changes in the
assortment of a warehouse are predictable. Our initial
expectation was based on theories
that mainly focus on production situations in which changes in
the assortment are
considered unpredictable thus increasing uncertainty (Fisher,
1997). Indeed, frequent
product changes may be rather unpredictable in a production
environment.
Planning
extensiveness (PE)
Decision rules
complexity (DC)
Control
sophistication
(CS)
Information
system specificity
(IS)
b t p B t p b t p b t p
Construct level analysis
Task
complexity (TC) 0.29 4.41 0.000 0.44 7.00 0.000 0.20 2.96
0.003 0.33 5.00 0.000
Market
dynamics (MD) 20.14 22.08 0.038 20.05 20.71 0.477 0.04 0.54
0.587 0.04 0.60 0.553
R
2
0.10 0.19 0.04 0.11
n 210 210 207 208
Subdimension analysis
Task
complexity (TC)
Log no. of
SKUs (TCa) 20.17 22.29 0.023 0.19 2.75 0.007
Process
diversity (TCb) 0.18 2.70 0.007 0.23 3.69 0.000 0.17 2.55 0.011
Log no. of order
lines (TCc) 0.38 5.13 0.000 0.37 5.91 0.000 0.33 5.10 0.000
Market
dynamics (MD)
Demand
unpredictability
(DU) 20.16 22.37 0.019
Assortment
changes (AC)
R
2
0.21 0.21 0.04 0.15
n 210 210 207 208
Table III.
Regressions
IJOPM
33,9
1244
However, when information about product changes and new
products is exchanged
between production and distribution, a distribution center
should be able to predict the
changes in the assortment. This even encourages distribution
centers to put more effort
into planning to cope with these changes.
Support for this interpretation can be found when comparing the
production
warehouses and the distribution centers in our sample with
respect to the effect of the
subdimension “assortment changes” on planning extensiveness.
Production warehouses
store and distribute raw materials, semi-finished and finished
products in a production
environment. Distribution centers store products between point-
of-production and
point-of-consumption and are located close to the products’
markets. In other words,
production warehouses are located upstream, whereas
distribution centers are located
downstream in the supply-and-demand chain. We therefore
expect a negative effect of
negative effect of assortment changes in production warehouses.
Although we have to be
cautious since the number of production warehouses is
relatively small in our sample
(n ¼ 22), the results of a separate regression (Table IV) for
production warehouses show a
significant negative effect (b ¼ 20.45, p , 0.027). This means
that the more the
assortment changes, the less extensive is the planning. Changes
in the assortment are
difficult to predict and therefore difficult to plan for in
production warehouses.
In distribution centers (n ¼ 193), no significant effect of
assortment changes on planning
extensiveness shows up in Table IV because the effects of the
other variables, especially
“number of order lines” are more dominant. The results of
correlation analyses (Table V)
Production warehouses Distribution centers
Planning extensiveness (PE) Planning extensiveness (PE)
b t p b t p
Construct level analysis
Task complexity (TC) 20.12 20.64 0.530 0.32 4.65 0.000
Market dynamics (MD) 20.60 23.20 0.005 20.10 21.40 0.162
R
2
0.39 0.11
n 21 189
Subdimension analysis
Task complexity (TC)
No. of SKUs (TCa) 20.14 21.85 0.066
Process diversity (TCb) 0.18 2.60 0.010
No. of order lines (TCc) 0.40 5.07 0.000
Market dynamics (MD)
Demand unpredictability (DU) 20.46 22.48 0.023 20.15 22.08
0.039
Assortment changes (AC) 20.45 22.42 0.027
R
2 0.38 0.22
n 21 189
Table IV.
Regression production
warehouses vs
distribution centers
Production warehouses Distribution centers
Planning extensiveness (PE) Planning extensiveness (PE)
R p n r p n
Assortment changes (AC) 20.38 0.083 22 0.18 0.015 192
Table V.
Correlation “assortment
changes” and planning
extensiveness
Organizing
warehouse
management
1245
show a significant positive correlation (correlation ¼ 0.18, p ,
0.015)) between
“assortment changes” and planning extensiveness for
distribution centers, and a
negative correlation (correlation ¼ 20.38, p , 0.083) for
production warehouses. Our
results indicate that because distribution centers are located
downstream in the supply
chain, assortment changes can be predicted and planned.
Table IV shows, in addition, that market dynamics drives
planning extensiveness
(b ¼ 20.60, p , 0.005) in production warehouses, and that task
complexity drives
planning extensiveness (b ¼ 0.32, p , 0.001) in distribution
centers. Distribution centers
appear to process significantly more order lines (mean ¼
11,715, SD ¼ 27,585) than
production warehouses (mean ¼ 881, SD ¼ 766) (t ¼ 3.47, p ,
0.001), which explains the
stronger effect of task complexity on planning extensiveness in
distribution warehouses.
H2 predicted a positive relationship between task complexity
and decision rules
complexity. Table III shows that 19 percent of the variance in
decision rules complexity
is explained by task complexity. The results in Table III
confirm a significant and
positive effect of task complexity (b ¼ 0.44, p , 0.001): the
more complex the
warehouse task, the more complex are the decision rules. As
expected, market
dynamics has no significant effect on decision rules complexity
( p , 0.477).
H3 and H6 predicted an effect of both task complexity and
market dynamics on control
sophistication. The results in Table III confirm H3 (b ¼ 0.20, p
, 0.003) and rejects H6
(b ¼ 0.04, p , 0.587). A more complex warehouse task requires
more sophisticated
control, while a more dynamic market does not affect control.
Only 4 percent of the
variance in control sophistication can be explained by task
complexity. We conclude that
task complexity and market dynamics do not explain the
variances in control
sophistication; other factors may play a role, and further
research is needed here.
H4 predicted that warehouses with a complex task need a more
customized and
tailor-made information system. Table III shows that the
information system
specificity is indeed significantly and positively affected by
task complexity (b ¼ 0.33,
p , 0.001). 11 percent of the variance in information system
specificity is explained by
task complexity. We conclude that a more specific and
customized information system
is required once a warehouse task becomes more complex. As
expected, market
dynamics has no effect on information system specifictiy.
We tested for several control variables, such as industry sector
and respondent’s
position, by adding variables to the subdimension regression of
Table III, applying a
Chow (F-change) test for increase in explained variance. We
only found significant
effects of industry sector for three warehousing dimensions, i.e.
decision rules
complexity (F-change ¼ 2.72, p , 0.007), control sophistication
(F-change ¼ 2.11,
p , 0.036), and information system specificity (F-change ¼ 3.11,
p , 0.002). No effect
of industry sector was found for planning extensiveness ( p .
0.24).
A more detailed analysis reveals that information system
specificity is significantly
higher than average for the sector public warehouses ( p ,
0.001). A possible
explanation for why public warehouses use significantly more
specific information
systems (72 percent have implemented a WMS) could be that
logistic-service providers
serve multiple clients in such warehouses (on average 4.4
within a single facility.
De Koster and Warffemius (2005) which all require specific
processes. Such a diversity of
processes is, in general, not sufficiently supported by generic
warehouse management
systems. This could also explain the significantly higher-than-
average decision rules
complexity in public warehouses ( p , 0.013). In addition,
decision rules complexity
IJOPM
33,9
1246
is significantly lower ( p , 0.018) than average for the
healthcare/pharmaceutical sector.
This might be due to a smaller-than-average diversity in
outbound processes. In this
sector, all shipments are in small quantities, picked from
storage systems, fit for piece
picking. A greater diversity can be often observed in the
dedicated systems in other
industry sectors, since next to piece picking, box and pallet
picking also takes place.
Finally, control sophistication is significantly lower for
defence/police warehouses
( p , 0.002) and for industrial products warehouses ( p , 0.038).
For defence/police
warehouses, especially online information exchange with
business partners is
particularly low. This could be explained by the important role
of security and data
protection in such warehouses. Warehouses with industrial
products are located
upstream in the supply chain. As lead times generally increase
upstream in supply
chains, this implies that such warehouses have a longer
planning horizon and do not
have to respond in real-time to changes and unforeseen
situations.
To summarize, we find clear support for H1, H2, H4, and H5,
but weak support for
H3, and no support for H6 (Figure 3). For H1 and H5, we found
different effects for
production warehouses and distribution centers. H1 is supported
by distribution
centers, but not by production warehouses; and H5 is supported
by production
warehouses, but not by distribution centers. With regard to
market dynamics, the
subdimension “demand unpredictability” behaves as expected,
but the effect of the
subdimension “assortment changes” seems to be different in
distribution centers than
in production warehouses. The variable “assortment changes”
does not seem to be a
characteristic of a dynamic market in distribution centers.
Importantly, most
subdimensions of the independent constructs have significant
effects and differ in size.
This indicates the importance of measuring the constructs in a
detailed manner and
analyzing the subdimensions separately.
6. Conclusions and future research
In this paper, we proposed and defined warehouse management
by three constructs:
planning extensiveness, decision rules complexity, and control
sophistication.
Figure 3.
Results
Warehouse Management
StructureH5
Task Complexity
Planning Extensiveness
(in distribution centers)
Decision Rules Complexity
–
+H1
H2 +
Planning Extensiveness
(in production warehouses)
Control Sophistication
Warehouse Management
H3 +
Market Dynamics (Information) System
Information System Specificity
H4 +
Organizing
warehouse
management
1247
We developed a model linking the two main drivers of
warehouse management,
task complexity and market dynamics, and tested this model in a
large sample of
warehouses. In the process, we developed new measures for
most constructs.
We empirically find that warehouse management is largely
driven by task
complexity and to a much lesser extent by market dynamics.
Our results show that
the more complex the warehouse task is, the more extensive is
the planning and the more
complex are the decision rules. Furthermore, a complex
warehouse task leads to a more
sophisticated control system. Our H5 is weakly supported by the
data. This is mainly
due to the role of the subdimension “assortment changes” in the
market dynamics
construct. Assortment changes appear to have a different effect
in distribution centers
than in production warehouses. Whereas the subdimension
“demand unpredictability”
indeed leads to less extensive planning, frequent assortment
changes lead to more
extensive planning in distribution centers. In hindsight, this
makes sense as changing
assortments is regular business (think of regular promotions,
seasonal products) in
many distribution centers, and stock and location plans have to
anticipate this.
Furthermore, we find that distribution centers process
significantly more order lines
per day than production warehouses. This phenomenon, together
with the opposite
effect of “assortment changes”, explains why planning
extensiveness is driven by
market dynamics in production warehouses and by task
complexity in distribution
centers. Our H6 is not supported by the data. Apparently, only
task complexity plays a
dominant role.
We expected to find the choice of the WMS (measured by
information system
specificity) to be driven by task complexity. Indeed, the data
confirm our H4 that the more
complex the warehouse task is, the more specific is the
functionality of the information
system. Other factors than TC obviously play a role in the WMS
choice. For example,
logistics service providers do not base their WMS choice on a
single warehouse but on the
various warehouses they operate. The organization of warehouse
management is
strongly related to the specificity of the information system: all
three dimensions
(planning extensiveness, decision rules complexity, and control
sophistication) correlate
positively with the specificity of the software system. This was
to be expected as generic
software systems do not sufficiently support complex
requirements.
In this research, we contributed to the study of warehouse
management by
developing new measures for most constructs. We provided an
extensive and detailed
operationalization of each construct and its subdimensions.
Most of these measures
were developed using objective facts about the warehouse and
the insights and
observations of expert informants, usually the senior warehouse
manager.
Future research should be conducted to further validate the
measures. Our
operationalization could be used as a starting point for
developing measures in similar
contexts such as transshipment terminals and cross-dock
operations. Further research
could also test whether the current operationalizations
(dimensions and
subdimensions) are general enough to be applied outside of the
warehouse context,
for instance, in production.
Our research focused on warehousing in The Netherlands and
Flanders. It would be
interesting to test our hypotheses in warehouses in non-Western
countries. A priori, we
do not expect significantly different results. In addition, it
might be interesting to extend
the sample with more production warehouses to more robustly
test for differences
between production warehouses and distribution centers. In our
study, we still find
IJOPM
33,9
1248
a substantial variability in responses to task complexity and
market dynamics.
In follow-up research, in-depth case studies might provide
additional insight into the
implementation of the subdimensions of warehouse
management.
Our proposed operationalization provides means to
systematically study other
aspects of warehousing. Most notably, how warehouse
management affects warehouse
performance. In particular, it would be interesting to research
whether a (mis)match
between the independent variables, task complexity and market
dynamics, and the
way warehouse management is organized impacts warehouse
performance. Such a
study would complement current studies on warehouse
performance (De Koster and
Balk, 2008; De Koster and Warffemius, 2005; Hackman et al.,
2001) that did not test
drivers. Detailed case studies could provide more insight into
the motivations and
reasons for apparent mismatches. Such reasons might be
diverse. Think of warehouses
with physical constraints (e.g. space shortage, outdated systems,
poor layout) that have
not been able to timely adapt to changes in the environment or
tasks. Furthermore, it
would be interesting to study the impact of differences in WMS
and the choice of WMS
on performance.
Finally, this study could help warehouse managers to
benchmark their
warehouse against the independent constructs developed in this
paper. Knowledge
of scores on these indicators can help managers effectively
organize warehouse
management and assist them with their choice of WMS; in
particular, whether a
standard system will do, or whether a system with specific
functionalities will be more
appropriate.
References
Ackerman, K.B. and La Londe, B.J. (1980), “Making
warehousing more efficient”, Harvard
Business Review, Vol. 58 No. 2, pp. 94-102.
Alter, S. (1999), Information Systems: A Management
Perspective, 3rd ed., Addison-Wesley,
Reading, MA.
Anthony, R.N. and Young, D.W. (1984), Management Control
in Non-profit Organizations, 3rd
ed., R.D. Irwin, Homewood, IL.
BCI (1997), Europese distributie en waardetoevoeging door
buitenlandse bedrijven (European
Distribution and Value Added Logistics by Foreign Companies),
BCI, Nijmegen, pp. 39-54,
In Dutch.
Bertrand, J.W.M., Wortmann, J.C. and Wijngaard, J. (1990),
Production Control: A Structural and
Design Oriented Approach, Elsevier, Amsterdam.
Burns, T. and Stalker, G.M. (1961), The Management of
Innovation, Tavistock, London.
Chen, C.-M., Gong, Y., De Koster, M.B.M. and Van Nunen,
J.A.E.E. (2010), “A flexible evaluative
framework for order picking systems”, Production and
Operations Management, Vol. 19
No. 1, pp. 70-82.
Churchill, G.A. (1979), “A paradigm for developing better
measures of marketing constructs”,
Journal of Marketing Research, Vol. 16 No. 1, pp. 64-73.
Davenport, T.H. (1998), “Putting the enterprise into the
enterprise system”, Harvard Business
Review, Vol. 16 No. 4, pp. 121-131.
De Koster, M.B.M. and Balk, B. (2008), “Benchmarking and
monitoring international
warehouse operations in Europe”, Production and Operations
Management, Vol. 17
No. 2, pp. 1-10.
Organizing
warehouse
management
1249
De Koster, M.B.M. and Warffemius, P.M.J. (2005), “American,
Asian and third-party international
warehouse operations in Europe: a performance comparison”,
International Journal of
Operations & Production Management, Vol. 25 No. 8, pp. 762-
780.
De Koster, M.B.M., Le-Duc, T. and Roodbergen, K.J. (2007),
“Design and control of warehouse
order picking: a literature review”, European Journal of
Operational Research, Vol. 182
No. 2, pp. 481-501.
De Toni, A. and Panizzolo, R. (1997), “Repetitive
manufacturing planning and control systems:
a framework for analysis”, Production Planning and Control,
Vol. 8 No. 5, pp. 500-508.
Diamantopoulos, A. and Winklhofer, H.M. (2001), “Index
construction with formative indicators:
an alternative to scale development”, Journalof
MarketingResearch, Vol. 38 No. 2, pp. 269-277.
Drury, J. (1988), “Towards more efficient order picking”, IMM
Monograph 1, The Institute of
Materials Management, Cranfield.
Duncan, R. (1972), “Characteristics of organizational
environments and perceived environmental
uncertainty”, Administrative Science Quarterly, Vol. 17 No. 3,
pp. 313-327.
ELA/AT Kearney (2005), Excellence in Logistics 2004:
Differentiation for Performance, ELA,
Brussels.
Espejo, R. and Watt, J. (1988), “Information management,
organization and managerial
effectiveness”, The Journal of the Operational Research
Society, Vol. 39 No. 1, pp. 7-14.
Faber, N., De Koster, M.B.M. and Van de Velde, S.L. (2002),
“Linking warehouse complexity to
warehouse planning and control structure: an exploratory study
of the use of warehouse
management information systems”, International Journal of
Physical Distribution
& Logistics Management, Vol. 32 No. 5, pp. 381-395.
Fisher, M.L. (1997), “What is the right supply chain for your
product?”, Harvard Business Review,
Vol. 75 No. 2, pp. 105-116.
Frazelle, E.H. (2002), World-Class Warehousing and Material
Handling, McGraw-Hill, New York, NY.
Gu, J., Goetschalckx, M. and McGinnis, L.F. (2007), “Research
on warehouse operation:
a comprehensive review”, European Journal of Operational
Research, Vol. 177 No. 1,
pp. 1-21.
Gu, J., Goetschalckx, M. and McGinnis, L.F. (2010), “Research
on warehouse design and
performance evaluation: a comprehensive review”, European
Journal of Operational
Research, Vol. 203 No. 3, pp. 539-549.
Hackman, S.T., Frazelle, E.H., Griffin, P.M., Griffin, S.O. and
Vlasta, D.A. (2001), “Benchmarking
warehousing and distribution operations: an input-output
approach”, Journal of
Productivity Analysis, Vol. 16 No. 1, pp. 79-100.
Harmon, R.L. (1993), Reinventing the Warehouse, Word-Class
Distribution Logistics,
The Free Press, New York, NY.
Hatch, M.J. (1997), Organization Theory: Modern Symbolic and
Postmodern Perspectives, Oxford
University Press, New York, NY.
HIDC/BCI (2001), From EDC to ELC, Holland International
Distribution Council, The Hague.
Huber, G.P. (1984), “The nature and design of post-industrial
organizations”, Management
Science, Vol. 30 No. 8, pp. 928-951.
Huber, G.P. and Power, D.J. (1985), “Retrospective reports of
strategic-level managers: guidelines
for increasing their accuracy”, Strategic Management Journal,
Vol. 6 No. 2, pp. 171-180.
Jarvis, C.B., MacKenzie, S.B. and Podsakoff, P.M. (2003), “A
critical review of construct indicators
and measurement model misspecification in marketing and
consumer research”, Journal of
Consumer Research, Vol. 30 No. 3, pp. 199-218.
IJOPM
33,9
1250
Keller, S.B., Savitskie, K., Stank, T.P., Lynch, D.F. and
Ellinger, A.E. (2002), “A summary and
analysis of multi-item scales used in logistics research”, Journal
of Business Logistics,
Vol. 23 No. 2, pp. 703-729.
Khandwalla, P.N. (1977), The Design of Organizations,
Harcourt Brace Jovanovich, New York, NY.
Kiefer, A.W. and Novack, R.A. (1999), “An empirical analysis
of warehouse measurement systems
in the context of supply chain implementation”,
TransportationJournal, Vol. 38 No. 3, pp. 18-27.
Kuipers, B. (1999), “Liège, Tongeren, Genk or the Maasvlakte:
what’s the difference? Spatial
behaviour of European Distribution Centres”, in Rodenburg,
R.H.J. and Kruse, A.L. (Eds),
Vervoerslogistieke Werkdagen 1999, Connekt, Delft, pp. 433-
445.
Lawrence, P.R. and Lorsch, J.W. (1967), Organization and
Environment, Harvard Business
Graduate School Press, Boston, MA.
LeBlanc, L.J. (2000), “The impact of information technology on
operations management”,
International Journal of Technology Management, Vol. 20 Nos
3/4, pp. 243-251.
Lee, H.L. (2002), “Aligning supply chain strategies with
product uncertainties”, California
Management Review, Vol. 44 No. 3, pp. 105-119.
Loudin, A. (1998), “Pick a winner”, Warehousing Management,
Vol. 5 No. 11, p. 34.
Lynch, R.K. (1985), “Nine pitfalls in implementing packaged
applications software”, The Journal
of Information Systems Management, Vol. 2 No. 2, pp. 88-94.
Miller, D. and Friesen, P.H. (1983), “Strategy making and
environment: the third link”, Strategic
Management Journal, Vol. 4 No. 3, pp. 221-235.
Mintzberg, H. (1983), Structure in Fives: Designing Effective
Organizations, Prentice-Hall,
Englewood Cliffs, NJ.
Muilerman, G. (2001), “Time based logistics: an analysis of the
relevance, causes and impacts”,
published PhD thesis, Delft University of Technology, Delft.
OECD (2006), OECD Estimates of Labour Productivity for
2005, September, available at:
www.oecd.org/dataoecd/30/40/29867116.xls
Perrow, C. (1967), “A framework for the comparative analysis
of organizations”, American
Sociological Review, Vol. 32 No. 2, pp. 194-208.
Peterson, R. and Silver, E.A. (1979), Decision Systems for
Inventory Management and Production
Planning, 2nd ed., Wiley, New York, NY.
Premkumar, R. and Zailani, S. (2005), “Supply chain integration
and performance: US versus
East Asian companies”, Supply Chain Management: An
International Journal, Vol. 10
No. 5, pp. 379-393.
Quak, H.J. and De Koster, M.B.M. (2007), “Exploring retailers’
sensitivity to local sustainability
policies”, Journal of Operations Management, Vol. 25 No. 6,
pp. 1103-1122.
Randall, S. (1999), “The value of WMS”, Modern Materials
Handling, Vol. 54 No. 7, pp. 50-52.
Rossiter, J.R. (2002), “The C-OAR-SE procedure for scale
development in marketing”,
International Journal of Research in Marketing, Vol. 19 No. 4,
pp. 305-335.
Rouwenhorst, B., Reuter, B., Stockrahm, V., Van Houtum, G.J.,
Mantel, R.J. and Zijm, W.H.M.
(2000), “Warehouse design and control: framework and
literature review”, European
Journal of Operations Research, Vol. 122 No. 3, pp. 515-533.
Schoenherr, T., Hilpet, D., Soni, A.K., Venkataramanan, M.A.
and Mabert, V.A. (2010), “Enterprise
systems complexity and its antecedents: a grounded-theory
approach”, International Journal
of Operations and Production Management, Vol. 30 No. 6, pp.
639-668.
Slack, N., Chambers, S. and Johnston, R. (2001), Operations
Management, 3rd ed., Prentice-Hall,
Harlow.
Organizing
warehouse
management
1251
Somers, T.M. and Nelson, K.G. (2003), “The impact of strategy
and integration mechanisms on
enterprise system value: empirical evidence from manufacturing
firms”, European Journal
of Operational Research, Vol. 146 No. 2, pp. 315-338.
Sousa, R. and Voss, C.A. (2008), “Contingency research in
operations management practices”,
Journal of Operations Management, Vol. 26 No. 2, pp. 697-713.
Ten Hompel, M. and Schmidt, T. (2006), Warehouse
Management: Automation and Organisation
of Warehouse and Order Picking Systems, Springer, Berlin.
Thompson, J.D. (1967), Organization in Action, McGraw-Hill,
New York, NY.
Tompkins, J.A., White, J.A., Bozer, Y.A. and Tanchoco, J.M.A.
(2003), Facilities Planning, Wiley,
New York, NY.
Van Assen, M.F. (2005), “Empirical studies in discrete parts
manufacturing management”,
published PhD thesis, RSM Erasmus University, Rotterdam.
Van den Berg, J.P. (1999), “A literature survey on planning and
control of warehousing systems”,
IIE Transactions, Vol. 31 No. 8, pp. 751-762.
Van den Berg, J.P. and Zijm, W.H.M. (1999), “Models for
warehouse management: classification
and examples”, International Journal of Production Economics,
Vol. 59 Nos 1/3, pp. 519-528.
Van Goor, A.R., Ploos van Amstel, M.J. and Ploos van Amstel,
W. (2003), European Distribution
and Supply Chain Logistics, Stenfert Kroese, Groningen.
Wäscher, G. (2004), “Order picking: a survey of planning
problems and methods”, in Dyckhoff, H.,
Lackes, R. and Reese, J. (Eds), Supply Chain Management and
Reverse Logistics, Springer,
Berlin, pp. 323-347.
About the authors
N. Faber is an Associate Professor of Logistics at The
Netherlands Defense Academy, and a
Doctoral Researcher at the Rotterdam School of Management,
Erasmus University. Her research
interests are warehousing, defense logistics and supply chain
management. N. Faber is the
corresponding author and can be contacted at: [email protected]
M.B.M. de Koster is Professor of Logistics and Operations
Management at the Rotterdam
School of Management, Erasmus University. His research
interests are warehousing, material
handling, retail operations, and behavioral operations. He is
(co-) author/editor of eight books and
over 130 papers in books and journals including Journal of
Operations Management,
Transportation Science, Production and Operations
Management, and International Journal of
Operations and Production Management. He is a member of the
ELA R&D committee, of the
BVL Scientific Advisory Board, Chairman of the Material
Handling Forum, and in the editorial
review boards of seven journals.
A. Smidts is Professor of Marketing Research at the Rotterdam
School of Management,
Erasmus University and Director of the Erasmus Center for
Neuroeconomics. He was Scientific
Director of the Erasmus Research Institute of Management
(ERIM) and Dean of Research of the
Rotterdam School of Management from 2004 to 2011. His
research interests include behavioral
decision making and persuasive communication. He is currently
working in the area of decision
neuroscience and neuromarketing. His research has been
published in journals such as
Management Science, Academy of Management Journal,
Marketing Science, International
Journal of Research in Marketing, Journal of Consumer
Research, Journal of Consumer
Psychology, Social Cognitive & Affective Neuroscience,
Psychological Science, Journal of
Neuroscience and Neuron.
IJOPM
33,9
1252
To purchase reprints of this article please e-mail:
[email protected]
Or visit our web site for further details:
www.emeraldinsight.com/reprints
Appendix
V
a
ri
a
b
le
D
es
cr
ip
ti
o
n
A
cc
o
m
p
a
n
y
in
g
q
u
es
ti
o
n
/
in
st
ru
ct
io
n
R
es
p
o
n
se
ca
te
g
o
ri
es
C
o
m
p
u
ta
ti
o
n
T
C
T
a
sk
co
m
p
le
x
it
y
S
u
m
(T
C
a
,
T
C
b
,
T
C
c)
a
T
C
a
L
o
g
n
u
m
b
er
o
f
S
K
U
s
W
h
a
t
is
th
e
a
v
er
a
g
e
n
u
m
b
er
o
f
S
K
U
?
(o
p
en
)
L
o
g
(n
u
m
b
er
o
f
S
K
U
s)
T
C
b
P
ro
ce
ss
d
iv
er
si
ty
S
u
m
(T
C
b
1
,T
C
b
2
)
T
C
b
1
N
u
m
b
er
o
f
sp
ec
ia
l
p
ro
ce
ss
es
C
h
ec
k
o
ff
p
ro
ce
ss
if
a
p
p
li
ca
b
le
Q
u
a
li
ty
co
n
tr
o
l
R
et
u
rn
h
a
n
d
li
n
g
C
o
u
n
t
n
u
m
b
er
o
f
p
ro
ce
ss
es
ch
ec
k
ed
o
ff
If
co
u
n
t
is
fi
v
e
o
r
le
ss
T
C
b
1
¼
1
;
if
co
u
n
t
is
m
o
re
th
a
n
fi
v
e
T
C
b
1
¼
2
R
ec
o
d
in
g
C
ro
ss
-d
o
ck
in
g
P
ro
d
u
ct
re
p
a
ck
in
g
C
y
cl
e
co
u
n
ti
n
g
In
te
rn
a
l
p
ro
d
u
ct
tr
a
n
sp
o
rt
a
ti
o
n
s
V
a
lu
e
a
d
d
ed
lo
g
is
ti
cs
O
th
er
sp
ec
ia
l
p
ro
ce
ss
es
T
C
b
2
A
v
er
a
g
e
n
u
m
b
er
o
f
m
o
d
es
W
h
a
t
is
th
e
a
v
er
a
g
e
n
u
m
b
er
o
f
m
o
d
es
in
w
h
ic
h
p
ro
ce
ss
es
ca
n
b
e
ca
rr
ie
d
o
u
t?
T
h
re
e
o
r
le
ss
M
o
re
th
a
n
3
If
a
v
er
a
g
e
n
u
m
b
er
o
f
m
o
d
es
p
er
p
ro
ce
ss
is
th
re
e
o
r
le
ss
T
C
b
2
¼
1
;
if
m
o
re
th
a
n
th
re
e
T
C
b
2
¼
2
T
C
c
L
o
g
n
u
m
b
er
o
f
o
rd
er
li
n
es
W
h
a
t
is
th
e
a
v
er
a
g
e
n
u
m
b
er
o
f
o
rd
er
li
n
es
p
er
d
a
y
?
(o
p
en
)
L
o
g
(n
u
m
b
er
o
f
o
rd
er
li
n
es
)
M
D
M
a
rk
et
d
y
n
a
m
ic
s
S
u
m
(D
U
,
A
C
)a
D
U
D
em
a
n
d
u
n
p
re
d
ic
ta
b
il
it
y
S
u
m
(D
U
1
,
D
U
2
,
D
U
3
)
D
U
1
D
U
lo
n
g
-t
er
m
H
o
w
p
re
d
ic
ta
b
le
is
th
e
to
ta
l
n
u
m
b
er
o
f
o
rd
er
li
n
es
fo
r
lo
n
g
-
te
rm
(h
a
lf
a
y
ea
r-
o
n
e
y
ea
r)
?
P
re
d
ic
ta
b
le
P
re
d
ic
ta
b
le
to
a
li
m
it
ed
ex
te
n
t
D
if
fi
cu
lt
to
p
re
d
ic
t
If
d
em
a
n
d
is
p
re
d
ic
ta
b
le
D
U
1
¼
1
;
if
p
re
d
ic
ta
b
le
to
a
li
m
it
ed
ex
te
n
t
D
U
1
¼
2
;
if
d
if
fi
cu
lt
to
p
re
d
ic
t
D
U
1
¼
3
D
U
2
D
U
sh
o
rt
-t
er
m
H
o
w
p
re
d
ic
ta
b
le
is
th
e
to
ta
l
n
u
m
b
er
p
er
p
ro
d
u
ct
/p
ro
d
u
ct
g
ro
u
p
fo
r
sh
o
rt
-t
er
m
?
P
re
d
ic
ta
b
le
P
re
d
ic
ta
b
le
to
a
li
m
it
ed
ex
te
n
t
D
if
fi
cu
lt
to
p
re
d
ic
t
If
d
em
a
n
d
is
p
re
d
ic
ta
b
le
D
U
2
¼
1
;
if
p
re
d
ic
ta
b
le
to
a
li
m
it
ed
ex
te
n
t
D
U
2
¼
2
;
if
d
if
fi
cu
lt
to
p
re
d
ic
t
D
U
2
¼
3
(c
o
n
ti
n
u
ed
)
Table AI.
Summary of measures
Organizing
warehouse
management
1253
V
a
ri
a
b
le
D
es
cr
ip
ti
o
n
A
cc
o
m
p
a
n
y
in
g
q
u
es
ti
o
n
/
in
st
ru
ct
io
n
R
es
p
o
n
se
ca
te
g
o
ri
es
C
o
m
p
u
ta
ti
o
n
D
U
3
D
U
v
er
y
sh
o
rt
-t
er
m
(o
n
e
d
a
y
)
H
o
w
p
re
d
ic
ta
b
le
is
th
e
to
ta
l
n
u
m
b
er
o
f
o
rd
er
li
n
es
p
er
d
a
y
fo
r
v
er
y
sh
o
rt
-t
er
m
(o
n
e
d
a
y
-o
n
e
w
ee
k
)?
P
re
d
ic
ta
b
le
P
re
d
ic
ta
b
le
to
a
li
m
it
ed
ex
te
n
t
D
if
fi
cu
lt
to
p
re
d
ic
t
If
d
em
a
n
d
is
p
re
d
ic
ta
b
le
D
U
3
¼
1
;
if
p
re
d
ic
ta
b
le
to
a
li
m
it
ed
ex
te
n
t
D
U
3
¼
2
;
if
d
if
fi
cu
lt
to
p
re
d
ic
t
D
U
3
¼
3
A
C
A
ss
o
rt
m
en
t
ch
a
n
g
es
Is
th
e
a
ss
o
rt
m
en
t
li
a
b
le
to
ch
a
n
g
es
?
H
a
rd
ly
T
o
a
li
m
it
ed
ex
te
n
t
T
o
a
g
re
a
t
ex
te
n
t
If
a
ss
o
rt
m
en
t
h
a
rd
ly
ch
a
n
g
es
A
C
¼
1
;i
f
A
C
to
a
li
m
it
ed
ex
te
n
t
A
C
¼
2
;
if
A
C
to
a
g
re
a
t
ex
te
n
t
A
C
¼
3
P
E
P
la
n
n
in
g
ex
te
n
si
v
en
es
s
C
h
ec
k
o
ff
p
la
n
s
S
to
ck
p
la
n
n
in
g
S
to
ra
g
e
lo
ca
ti
o
n
p
la
n
n
in
g
C
a
p
a
ci
ty
p
la
n
n
in
g
T
ra
n
sp
o
rt
p
la
n
n
in
g
C
o
u
n
t
n
u
m
b
er
o
f
p
la
n
s
ch
ec
k
ed
o
ff
D
C
D
ec
is
io
n
ru
le
s
co
m
p
le
x
it
y
S
u
m
(D
ca
,
D
C
b
)a
D
C
a
N
u
m
b
er
o
f
a
ct
iv
it
ie
s
ex
p
li
ci
tl
y
u
si
n
g
d
ec
is
io
n
ru
le
s
C
h
ec
k
o
ff
a
ct
iv
it
ie
s
u
si
n
g
d
ec
is
io
n
ru
le
s
A
ll
o
ca
te
d
o
ck
d
o
o
rs
to
in
b
o
u
n
d
tr
a
n
sp
o
rt
u
n
it
s
(e
.g
.
tr
u
ck
s)
;
C
o
u
n
t
n
u
m
b
er
o
f
a
ct
iv
it
ie
s
ch
ec
k
ed
o
ff
A
ll
o
ca
te
ca
p
a
ci
ty
(p
er
so
n
n
el
a
n
d
eq
u
ip
m
en
t)
to
in
b
o
u
n
d
tr
a
n
sp
o
rt
u
n
it
s;
A
ll
o
ca
te
in
b
o
u
n
d
p
ro
d
u
ct
s
to
st
o
ra
g
e
lo
ca
ti
o
n
s
o
r
cr
o
ss
-
d
o
ck
in
g
;
A
ll
o
ca
te
in
b
o
u
n
d
p
ro
d
u
ct
s
a
n
d
st
o
ra
g
e
lo
ca
ti
o
n
s
to
in
b
o
u
n
d
ro
u
te
s
(o
p
ti
m
a
l
ro
u
te
s)
;
A
ll
o
ca
te
in
b
o
u
n
d
ro
u
te
s
to
a
v
a
il
a
b
le
ca
p
a
ci
ti
es
;
C
lu
st
er
o
rd
er
s
to
b
e
sh
ip
p
ed
to
tr
a
n
sp
o
rt
u
n
it
s;
C
lu
st
er
cu
st
o
m
er
o
rd
er
s
to
b
a
tc
h
es
;
(c
o
n
ti
n
u
ed
)
Table AI.
IJOPM
33,9
1254
V
a
ri
a
b
le
D
es
cr
ip
ti
o
n
A
cc
o
m
p
a
n
y
in
g
q
u
es
ti
o
n
/
in
st
ru
ct
io
n
R
es
p
o
n
se
ca
te
g
o
ri
es
C
o
m
p
u
ta
ti
o
n
S
et
tl
e
th
e
ex
ec
u
ti
n
g
st
a
rt
p
o
in
t
p
er
b
a
tc
h
;
A
ll
o
ca
te
p
ic
k
o
rd
er
li
n
es
to
st
o
ra
g
e
lo
ca
ti
o
n
s;
A
ll
o
ca
te
p
ic
k
o
rd
er
li
n
es
a
n
d
st
o
ra
g
e
lo
ca
ti
o
n
s
to
p
ic
k
ro
u
te
s
(o
p
ti
m
a
l
ro
u
te
s)
;
A
ll
o
ca
te
p
ic
k
ro
u
te
s
to
a
v
a
il
a
b
le
ca
p
a
ci
ti
es
;
A
ll
o
ca
te
d
o
ck
d
o
o
rs
to
o
u
tb
o
u
n
d
tr
a
n
sp
o
rt
u
n
it
s
D
C
b
P
er
ce
iv
ed
co
m
p
le
x
it
y
o
f
d
ec
is
io
n
ru
le
s
S
u
m
(D
C
b
1
,
D
C
b
2
)
D
C
b
1
P
er
ce
iv
ed
co
m
p
le
x
it
y
o
f
in
b
o
u
n
d
d
ec
is
io
n
ru
le
s
H
o
w
co
m
p
le
x
a
re
th
e
in
b
o
u
n
d
d
ec
is
io
n
ru
le
s?
S
im
p
le
N
o
t
si
m
p
le
,
n
o
t
co
m
p
le
x
C
o
m
p
le
x
If
d
ec
is
io
n
ru
le
s
a
re
si
m
p
le
D
C
b
1
¼
1
;
if
d
ec
is
io
n
ru
le
s
a
re
n
o
t
si
m
p
le
a
n
d
n
o
t
co
m
p
le
x
D
C
b
1
¼
2
;
if
d
ec
is
io
n
ru
le
s
a
re
co
m
p
le
x
D
C
b
1
¼
3
D
C
b
2
P
er
ce
iv
ed
co
m
p
le
x
it
y
o
f
o
u
tb
o
u
n
d
d
ec
is
io
n
ru
le
s
H
o
w
co
m
p
le
x
a
re
th
e
o
u
tb
o
u
n
d
d
ec
is
io
n
ru
le
s?
S
im
p
le
N
o
t
si
m
p
le
,
n
o
t
co
m
p
le
x
C
o
m
p
le
x
If
d
ec
is
io
n
ru
le
s
a
re
si
m
p
le
D
C
b
2
¼
1
;
if
d
ec
is
io
n
ru
le
s
a
re
n
o
t
si
m
p
le
a
n
d
n
o
t
co
m
p
le
x
D
C
b
2
¼
2
;
if
d
ec
is
io
n
ru
le
s
a
re
co
m
p
le
x
D
C
b
2
¼
3
C
S
C
o
n
tr
o
l
so
p
h
is
ti
ca
ti
o
n
S
u
m
(C
S
1
,
C
S
2
,
C
S
3
,
C
S
4
,
C
S
5
)
C
S
1
O
p
er
a
ti
o
n
a
l
d
a
ta
re
g
is
tr
a
ti
o
n
Is
o
p
er
a
ti
o
n
a
l
d
a
ta
g
en
er
a
ll
y
re
g
is
te
re
d
re
a
l
ti
m
e
a
n
d
o
n
li
n
e?
N
o
Y
es
If
re
g
is
tr
a
ti
o
n
is
n
o
t
re
a
l
ti
m
e
a
n
d
o
n
li
n
e
C
S
1
¼
1
;
if
re
g
is
tr
a
ti
o
n
is
re
a
l
ti
m
e
a
n
d
o
n
li
n
e
C
S
1
¼
2
(c
o
n
ti
n
u
ed
)
Table AI.
Organizing
warehouse
management
1255
V
a
ri
a
b
le
D
es
cr
ip
ti
o
n
A
cc
o
m
p
a
n
y
in
g
q
u
es
ti
o
n
/
in
st
ru
ct
io
n
R
es
p
o
n
se
ca
te
g
o
ri
es
C
o
m
p
u
ta
ti
o
n
C
S
2
O
p
er
a
ti
o
n
a
l
in
fo
rm
a
ti
o
n
a
v
a
il
a
b
il
it
y
Is
in
fo
rm
a
ti
o
n
fo
r
o
p
er
a
ti
o
n
a
l
co
n
tr
o
l
g
en
er
a
ll
y
a
v
a
il
a
b
le
re
a
l
ti
m
e
a
n
d
o
n
li
n
e?
N
o
Y
es
If
in
fo
rm
a
ti
o
n
is
n
o
t
re
a
l
ti
m
e
a
n
d
n
o
t
a
v
a
il
a
b
le
o
n
li
n
e
C
S
2
¼
1
;
if
in
fo
rm
a
ti
o
n
is
re
a
l
ti
m
e
a
n
d
a
v
a
il
a
b
le
o
n
li
n
e
C
S
2
¼
2
C
S
3
R
ea
ct
io
n
to
u
n
fo
re
se
en
si
tu
a
ti
o
n
s
W
h
a
t
is
th
e
re
a
ct
io
n
to
u
n
fo
re
se
en
si
tu
a
ti
o
n
s?
T
a
k
es
so
m
e
ti
m
e
Im
m
ed
ia
te
If
re
a
ct
io
n
ta
k
es
so
m
e
ti
m
e
C
S
3
¼
1
;
if
re
a
ct
io
n
is
im
m
ed
ia
te
C
S
3
¼
2
C
S
4
O
p
er
a
ti
o
n
a
l
in
fo
rm
a
ti
o
n
fr
o
m
su
p
p
li
er
s
Is
o
p
er
a
ti
o
n
a
l
in
fo
rm
a
ti
o
n
fr
o
m
su
p
p
li
er
s
(e
.g
.
st
o
ck
le
v
el
s)
a
v
a
il
a
b
le
o
n
li
n
e?
N
o
Y
es
If
su
p
p
li
er
in
fo
rm
a
ti
o
n
is
n
o
t
a
v
a
il
a
b
le
o
n
li
n
e
C
S
4
¼
1
;
if
su
p
p
li
er
in
fo
rm
a
ti
o
n
is
a
v
a
il
a
b
le
o
n
li
n
e
C
S
4
¼
2
C
S
5
O
p
er
a
ti
o
n
a
l
in
fo
rm
a
ti
o
n
fr
o
m
cu
st
o
m
er
s
Is
o
p
er
a
ti
o
n
a
l
in
fo
rm
a
ti
o
n
fr
o
m
cu
st
o
m
er
s
(e
.g
.
p
o
in
t-
o
f-
sa
le
in
fo
rm
a
ti
o
n
)
re
ce
iv
ed
o
n
li
n
e?
N
o
Y
es
If
cu
st
o
m
er
in
fo
rm
a
ti
o
n
is
n
o
t
re
ce
iv
ed
o
n
li
n
e
C
S
5
¼
1
;
if
cu
st
o
m
er
in
fo
rm
a
ti
o
n
is
re
ce
iv
ed
o
n
li
n
e
C
S
5
¼
2
IS
In
fo
rm
a
ti
o
n
sy
st
em
sp
ec
ifi
ci
ty
C
h
ec
k
o
ff
in
fo
rm
a
ti
o
n
sy
st
em
ty
p
e
u
se
d
to
m
a
n
a
g
e
w
a
re
h
o
u
se
N
o
a
u
to
m
a
te
d
in
fo
rm
a
ti
o
n
sy
st
em
S
ta
n
d
a
rd
E
R
P
S
ta
n
d
a
rd
E
R
P
w
it
h
su
b
st
a
n
ti
a
l
cu
st
o
m
iz
a
ti
o
n
S
ta
n
d
a
rd
W
M
S
S
ta
n
d
a
rd
W
M
S
w
it
h
su
b
st
a
n
ti
a
l
cu
st
o
m
iz
a
ti
o
n
T
a
il
o
r-
m
a
d
e
sy
st
em
0
–
n
o
a
u
to
m
a
te
d
in
fo
rm
a
ti
o
n
sy
st
em
,
1
–
st
a
n
d
a
rd
E
R
P
,
2
–
st
a
n
d
a
rd
E
R
P
w
it
h
su
b
st
a
n
ti
a
l
cu
st
o
m
iz
a
ti
o
n
,
3
–
st
a
n
d
a
rd
W
M
S
,
4
–
st
a
n
d
a
rd
W
M
S
w
it
h
su
b
st
a
n
ti
a
l
cu
st
o
m
iz
a
ti
o
n
,
5
–
ta
il
o
r-
m
a
d
e
sy
st
em
(i
n
cr
ea
si
n
g
le
v
el
o
f
sp
ec
ifi
ci
ty
)
N
o
te
:
a
A
ll
v
a
ri
a
b
le
s
a
re
st
a
n
d
a
rd
iz
ed
b
ef
o
re
su
m
m
in
g
Table AI.
IJOPM
33,9
1256
Reproduced with permission of the copyright owner. Further
reproduction prohibited without
permission.
AN ANALYSIS AND IMPLEMENTATION OF AN
INFORMATION
MANAGEMENT SYSTEM FOR STUDENTS AND STAFFS
Department of Computer Science, Faculty of Mathematical
Sciences, University for Development Studies, Navrongo,
Ghana.
ABSTRACT
Developing software systems has become the fastest, most
perfect and affordable way of approaching problems using
information technology and deriving the best of all possible
solutions to meet customer's needs in this world of
globalization. This research is an analysis and implementation
of a computerised system that is going to be used at the
UDS in the Computer Science Department. This is to minimize
drastically the numerous challenges associated with the
manual system that is currently in use. This system is
programmed to connect to an SQL Server which holds the
database
that serves as the backend data storage for the system. This
software basically stores details of student registration and
examination result information. It as well stores information of
lecturers in the department. This system can be used to
create backup files for the database to prevent data loss when
events such as illegal alterations of data and natural
disaster occur.
Keywords: Information Technology, Management Systems,
Database, Server Backup, Registration.
SALIFU ABDUL-MUMIN
By
INTRODUCTION
Developing software systems has become the fastest,
most perfect and affordable way of approaching
problems using information technology and deriving the
best of all possible solutions to meet customer's needs in
this world of globalization.
The Systems Development Life Cycle (SDLC) is the process
of understanding how an Information System (IS) can
support business needs, designing the system, building it,
and delivering it to users. In many ways, building an
information system is similar to building a house.
First, the house (or the information system) starts with a
basic idea. Second, this idea is transformed into a simple
drawing that is shown to the customer and it's refined
(often through several drawings, each improving on the
other) until the customer agrees that the picture depicts
what he or she wants.
Third, a set of blueprints is designed that presents much
more detailed information about the house (e.g., the type
of water faucets, where the telephone jacks will be
placed). Finally, the house is built following the
blueprints—and often with some changes and decisions
made by the customer as the house is erected. The SDLC
has a similar set of four fundamental phases: planning,
RESEARCH PAPERS
9li-manager’s , Vol. No. 3 lJournal on Information Technology
3 June – August 2014
analysis, design, and implementation.
This paper follows all the four elements of the SDLC
aforementioned.
1. Problem Statement
There are a number of issues students faced both in/out of
campus. Some of such is as follows:
Students will register and sit for exams, yet results will
indicate zero (0) marks.
Students will defer courses and they will appear as
trailed on results pasted.
Students will sometimes would have completed a
course number of years ago, but upon a request of their
transcripts, they will be told that they trailed in one or more
course which has sometimes resulted into a legal issue.
All these issues will usually lead to a reference to the head
of the department for rectification. This is therefore called
for the need to have a concise and an accurate system of
keeping records.
Records of staffs in the various departments are poorly
kept as well.
1.1 Objective
To design an efficient and accurate software
management system that will handle Students and
l
l
l
l
RESEARCH PAPERS
Staff records.
2. Methodology
According to (Welman et al., 2004), research
methodology is an organised way comprising of
sequences, procedures and systems to manage and run
a research process.
A methodology is usually a guideline system for solving a
problem with specific components such as phases, tasks,
methods, techniques and tools. It can be also defined as
follows:
"The analysis of the principles of methods, rules, and
postulates employed by a discipline"
"The systematic study of methods that are, can be, or
have been applied within a discipline"
"The study or description of methods" (Wikipedia
Encyclopedia, 2010)
Research can either be quantitative or qualitative.
The quantitative research method seeks to establish
relationships and to explain causes of changes in
measured social facts (White, 2003). According to (Bless
et al., 1995), qualitative research uses qualifying words or
descriptions to record aspects of the world. (Olivier, 2004)
adds that, with qualitative research, it is the researcher
who considers data, selects what is appropriate and
processes it in some way.
In another school of thought, methodologies are the
methods or organizing principles underlying a particular
art, science, or other area of study (Microsoft Student with
Encarta Premium, 2009).
In software development, the process of solving
customers' problems by the systematic development and
evolution of large, high quality software systems within
cost, time and other constraints is called Software Life
Cycle Development Model (SLCDM). (Wikipedia
Encyclopedia, 2008). There are various models that can
be used to achieve the production of software Model – a
process which comprises identifiable stages that the
software product goes through during its life time.
Examples of SLCDM include waterfall, iterative and
prototype life cycle models among others (Stephen R,
l
l
l
2010). Different methodologies can be applied for
different projects.
This research will be based on the prototype methodology
which includes the development of prototypes; however,
throwaway prototypes may be employed at some point in
the SDLC.
The prototyping/ throwaway prototyping-based
methodologies have a relatively thorough analysis phase
that is used to gather information and to develop ideas for
the system concept. Many of the features suggested by
the users may not be well understood, however, and there
may be challenging technical issues to be solved. Each
of these issues is examined by analysing, designing, and
building a design prototype. A design prototype is not a
working system; it is a product that represents a part of the
system that needs additional improvement, and it
contains only enough detail to enable users to
understand the issues under consideration. After the
design of prototype is accepted, it is either built upon the
prototype, or thrown away for the real software to be built;
that’s the throwaway prototype.
Some tools to be employed are:
The software will be designed using Visual Basic.NET
(Microsoft Visual Studio 2010).
The database will be designed using SQL Server
2008(Enterprise Edition).
The designing of the forms begins after the
construction of the database tables.
Future upgrades will be done using the Visual
Basic.NET (Microsoft Visual Studio 2012) and SQL
server 2012 or latter.
3. Literature Review
Systems are created or made to solve problems. A system
is defined as a collection of components that work
together to realize some objectives. Basically there are
three major components in every system, namely input,
processing and output. (Goodland et al, 2004)
Some systems share common characteristics including:
Structure: Most system structures contain parts (or
components) that are directly or indirectly related to
l
l
l
l
l
10 li-manager’s , Vol. No. 3 lJournal on Information
Technology 3 June – August 2014
RESEARCH PAPERS
each other.
A system has behaviour. It contains processes that
transform inputs into outputs (material or energy data)
A system has interconnectivity: The parts and
processes are connected by structural and/or
behavioural relationships.
A system's structure and behaviour may be
decomposed via subsystems and sub – processes to
elementary part and process steps.
This term ‘system’ may also refer to a set of rules that
govern the structure and/or behavior.
(Stephen R, 2010)
4. Registration and Submission
Literally every University on the surface of the planet do
register its student and may allow submission of
registrations via an electronic system or paper based
system (manual system).
Apart from academic services, higher education
institutions (HEI) provide various other services to its
students. While education is the main goal, students also
need to be supported in other areas of their student life by
first-rate service provision. This includes the administrative
aspect, which comprises Registration, financial support,
library, information services and much more. These
administrative services go hand in hand with academic
services. Administrative services and academic services
are mutually dependent. For example, a student cannot
register, gain access to the librar y, receive any
administrative support and not attend classes, because
there will be no progress regarding his or her studies.
Similarly, a student cannot attend classes without being
registered.
Registration is the act of recording names and details on
an official list. Students' registration on the other hand is the
act of recording school students as present or absent at
the beginning of the school day, or the time or session at
which this takes place.
Submission is showing or the giving of something to
someone in authority for them to consider or approve.
(Longman Dictionary)
l
l
l
4.1 The Registration Process
Students register in order to be allowed access to the
academic and administrative sectors of an academic
institution. Registration allows them to choose the courses
and subjects they intend to be taught. Once a student
registers, he or she becomes eligible to attend classes.
The word registration means the accurate positioning of,
or the degree of accuracy in the positioning of, an entity
relative to (a) another entity, or (b) an independent frame
of reference. A process is step-by-step collection of
interdependent actions that together produce outcomes
that contribute to the success of an organization.
(Chapman et al, 1996:5)
A registration process is the process of formally assigning
and recording the enrolment of a student in a class or
classes. It is open only to those who have already been
admitted or re-admitted to the academic institution, or
who are eligible to re-register.
According to (Temple, 2006), the registration process
involves step-by-step interdependent actions that
together produce outcomes.
Registration at the University is a process that includes:
Academic advising with a faculty or staff member,
which is required for some majors, but optional for
others.
Registering for classes and confirming attendance.
In an interview with the Faculty Officer of the Faculty of
Mathematical Sciences, UDS, it was established that the
process of registration starts with a student acquiring a
form. The student fills in his or her personal information as
required and the subjects for which he or she is registering.
Personal information of returning students are already
captured on the system, which means that they only need
to fill in the subjects they wish to register for. They then
proceed to the relevant academic department to obtain
approval and signature (The head of the department
must sign the form to allow them to study a number of
courses per trimester).
Applicants for registration who do not hold the required
qualifications may, if they meet all other eligibility criteria
for registering, be granted registration subject to the
l
l
11li-manager’s , Vol. No. 3 lJournal on Information
Technology 3 June – August 2014
RESEARCH PAPERS
condition that they achieve the required qualification
within a specific period.
Registration has many benefits some of which are:
Registration is evidence that students/people who are
in an institution or workplace meet the competence,
g o o d c h a r a c t e r a n d c o n d u c t / m i n i m u m
requirements set for the registration and that they are
committed to meeting the code of practice and
learning for that institution. The qualification
requirements set for registration means that all
students or workers undertaking a particular
major/course or a particular role wherever they work
are required to demonstrate the same level of
competence and adhere to the code of conduct
Organizing warehousemanagementN. FaberNetherlands Defe.docx

More Related Content

Similar to Organizing warehousemanagementN. FaberNetherlands Defe.docx

A Study Of Evolution And Future Of Supply Chain Management
A Study Of Evolution And Future Of Supply Chain ManagementA Study Of Evolution And Future Of Supply Chain Management
A Study Of Evolution And Future Of Supply Chain ManagementSean Flores
 
A Survey Of The Literature On Order-Picking Systems By Combining Planning Pro...
A Survey Of The Literature On Order-Picking Systems By Combining Planning Pro...A Survey Of The Literature On Order-Picking Systems By Combining Planning Pro...
A Survey Of The Literature On Order-Picking Systems By Combining Planning Pro...Jose Katab
 
ARTICLE IN PRESS0925-5273$ - sedoi10.1016j.ijp.docx
ARTICLE IN PRESS0925-5273$ - sedoi10.1016j.ijp.docxARTICLE IN PRESS0925-5273$ - sedoi10.1016j.ijp.docx
ARTICLE IN PRESS0925-5273$ - sedoi10.1016j.ijp.docxdavezstarr61655
 
Critical Success Factors for Warehousing Performance Improvement in Moroccan ...
Critical Success Factors for Warehousing Performance Improvement in Moroccan ...Critical Success Factors for Warehousing Performance Improvement in Moroccan ...
Critical Success Factors for Warehousing Performance Improvement in Moroccan ...inventionjournals
 
Purchasing functions and mrp in foodservice firms
Purchasing functions and mrp in foodservice firmsPurchasing functions and mrp in foodservice firms
Purchasing functions and mrp in foodservice firmsAlexander Decker
 
Available online at [www.ijeete.com] IMPLEMENTATION OF SUPPLY CHAIN MANAGEMEN...
Available online at [www.ijeete.com] IMPLEMENTATION OF SUPPLY CHAIN MANAGEMEN...Available online at [www.ijeete.com] IMPLEMENTATION OF SUPPLY CHAIN MANAGEMEN...
Available online at [www.ijeete.com] IMPLEMENTATION OF SUPPLY CHAIN MANAGEMEN...Ankur Bindal
 
Enhancement techniques for data warehouse staging area
Enhancement techniques for data warehouse staging areaEnhancement techniques for data warehouse staging area
Enhancement techniques for data warehouse staging areaIJDKP
 
Means for transferring knowledge in the relocation of ...
Means for transferring knowledge in the relocation of ...Means for transferring knowledge in the relocation of ...
Means for transferring knowledge in the relocation of ...butest
 
Running Head BUSINESS PROCESS 1 .docx
Running Head BUSINESS PROCESS  1                               .docxRunning Head BUSINESS PROCESS  1                               .docx
Running Head BUSINESS PROCESS 1 .docxsusanschei
 
Thesis - Mechanizing optimization of warehouses by implementation of machine ...
Thesis - Mechanizing optimization of warehouses by implementation of machine ...Thesis - Mechanizing optimization of warehouses by implementation of machine ...
Thesis - Mechanizing optimization of warehouses by implementation of machine ...Shrikant Samarth
 
An integrated inventory optimisation model for facility location allocation p...
An integrated inventory optimisation model for facility location allocation p...An integrated inventory optimisation model for facility location allocation p...
An integrated inventory optimisation model for facility location allocation p...Ramkrishna Manatkar
 
Chapter 16. Facility Layout DecisionAfter selecting a facility.docx
Chapter 16. Facility Layout DecisionAfter selecting a facility.docxChapter 16. Facility Layout DecisionAfter selecting a facility.docx
Chapter 16. Facility Layout DecisionAfter selecting a facility.docxrobert345678
 
New microsoft office word document
New microsoft office word documentNew microsoft office word document
New microsoft office word documentTewodros Ayalew
 
Innovative logistics management under uncertainty using markov model
Innovative logistics management under uncertainty using markov modelInnovative logistics management under uncertainty using markov model
Innovative logistics management under uncertainty using markov modelAlexander Decker
 
Food supply chain managementsystems, implementations, and.docx
Food supply chain managementsystems, implementations, and.docxFood supply chain managementsystems, implementations, and.docx
Food supply chain managementsystems, implementations, and.docxpauline234567
 
A03620109
A03620109A03620109
A03620109theijes
 
A Framework For Teaching Supply Chain Management
A Framework For Teaching Supply Chain ManagementA Framework For Teaching Supply Chain Management
A Framework For Teaching Supply Chain ManagementCarrie Romero
 

Similar to Organizing warehousemanagementN. FaberNetherlands Defe.docx (20)

A Study Of Evolution And Future Of Supply Chain Management
A Study Of Evolution And Future Of Supply Chain ManagementA Study Of Evolution And Future Of Supply Chain Management
A Study Of Evolution And Future Of Supply Chain Management
 
A Survey Of The Literature On Order-Picking Systems By Combining Planning Pro...
A Survey Of The Literature On Order-Picking Systems By Combining Planning Pro...A Survey Of The Literature On Order-Picking Systems By Combining Planning Pro...
A Survey Of The Literature On Order-Picking Systems By Combining Planning Pro...
 
ARTICLE IN PRESS0925-5273$ - sedoi10.1016j.ijp.docx
ARTICLE IN PRESS0925-5273$ - sedoi10.1016j.ijp.docxARTICLE IN PRESS0925-5273$ - sedoi10.1016j.ijp.docx
ARTICLE IN PRESS0925-5273$ - sedoi10.1016j.ijp.docx
 
Critical Success Factors for Warehousing Performance Improvement in Moroccan ...
Critical Success Factors for Warehousing Performance Improvement in Moroccan ...Critical Success Factors for Warehousing Performance Improvement in Moroccan ...
Critical Success Factors for Warehousing Performance Improvement in Moroccan ...
 
Purchasing functions and mrp in foodservice firms
Purchasing functions and mrp in foodservice firmsPurchasing functions and mrp in foodservice firms
Purchasing functions and mrp in foodservice firms
 
Available online at [www.ijeete.com] IMPLEMENTATION OF SUPPLY CHAIN MANAGEMEN...
Available online at [www.ijeete.com] IMPLEMENTATION OF SUPPLY CHAIN MANAGEMEN...Available online at [www.ijeete.com] IMPLEMENTATION OF SUPPLY CHAIN MANAGEMEN...
Available online at [www.ijeete.com] IMPLEMENTATION OF SUPPLY CHAIN MANAGEMEN...
 
Enhancement techniques for data warehouse staging area
Enhancement techniques for data warehouse staging areaEnhancement techniques for data warehouse staging area
Enhancement techniques for data warehouse staging area
 
Means for transferring knowledge in the relocation of ...
Means for transferring knowledge in the relocation of ...Means for transferring knowledge in the relocation of ...
Means for transferring knowledge in the relocation of ...
 
Running Head BUSINESS PROCESS 1 .docx
Running Head BUSINESS PROCESS  1                               .docxRunning Head BUSINESS PROCESS  1                               .docx
Running Head BUSINESS PROCESS 1 .docx
 
Essay Warehouse
Essay WarehouseEssay Warehouse
Essay Warehouse
 
Thesis - Mechanizing optimization of warehouses by implementation of machine ...
Thesis - Mechanizing optimization of warehouses by implementation of machine ...Thesis - Mechanizing optimization of warehouses by implementation of machine ...
Thesis - Mechanizing optimization of warehouses by implementation of machine ...
 
An integrated inventory optimisation model for facility location allocation p...
An integrated inventory optimisation model for facility location allocation p...An integrated inventory optimisation model for facility location allocation p...
An integrated inventory optimisation model for facility location allocation p...
 
Chapter 16. Facility Layout DecisionAfter selecting a facility.docx
Chapter 16. Facility Layout DecisionAfter selecting a facility.docxChapter 16. Facility Layout DecisionAfter selecting a facility.docx
Chapter 16. Facility Layout DecisionAfter selecting a facility.docx
 
supply chain
supply chainsupply chain
supply chain
 
New microsoft office word document
New microsoft office word documentNew microsoft office word document
New microsoft office word document
 
Logistic Management
Logistic ManagementLogistic Management
Logistic Management
 
Innovative logistics management under uncertainty using markov model
Innovative logistics management under uncertainty using markov modelInnovative logistics management under uncertainty using markov model
Innovative logistics management under uncertainty using markov model
 
Food supply chain managementsystems, implementations, and.docx
Food supply chain managementsystems, implementations, and.docxFood supply chain managementsystems, implementations, and.docx
Food supply chain managementsystems, implementations, and.docx
 
A03620109
A03620109A03620109
A03620109
 
A Framework For Teaching Supply Chain Management
A Framework For Teaching Supply Chain ManagementA Framework For Teaching Supply Chain Management
A Framework For Teaching Supply Chain Management
 

More from gerardkortney

· Describe strategies to build rapport with inmates and offenders .docx
· Describe strategies to build rapport with inmates and offenders .docx· Describe strategies to build rapport with inmates and offenders .docx
· Describe strategies to build rapport with inmates and offenders .docxgerardkortney
 
· Debates continue regarding what constitutes an appropriate rol.docx
· Debates continue regarding what constitutes an appropriate rol.docx· Debates continue regarding what constitutes an appropriate rol.docx
· Debates continue regarding what constitutes an appropriate rol.docxgerardkortney
 
· Critical thinking paper ·  ·  · 1. A case study..docx
· Critical thinking paper ·  ·  · 1. A case study..docx· Critical thinking paper ·  ·  · 1. A case study..docx
· Critical thinking paper ·  ·  · 1. A case study..docxgerardkortney
 
· Create a Press Release for your event - refer to slide 24 in thi.docx
· Create a Press Release for your event - refer to slide 24 in thi.docx· Create a Press Release for your event - refer to slide 24 in thi.docx
· Create a Press Release for your event - refer to slide 24 in thi.docxgerardkortney
 
· Coronel & Morris Chapter 7, Problems 1, 2 and 3.docx
· Coronel & Morris Chapter 7, Problems 1, 2 and 3.docx· Coronel & Morris Chapter 7, Problems 1, 2 and 3.docx
· Coronel & Morris Chapter 7, Problems 1, 2 and 3.docxgerardkortney
 
· Complete the following problems from your textbook· Pages 378.docx
· Complete the following problems from your textbook· Pages 378.docx· Complete the following problems from your textbook· Pages 378.docx
· Complete the following problems from your textbook· Pages 378.docxgerardkortney
 
· Consider how different countries approach aging. As you consid.docx
· Consider how different countries approach aging. As you consid.docx· Consider how different countries approach aging. As you consid.docx
· Consider how different countries approach aging. As you consid.docxgerardkortney
 
· Clarifying some things on the Revolution I am going to say som.docx
· Clarifying some things on the Revolution I am going to say som.docx· Clarifying some things on the Revolution I am going to say som.docx
· Clarifying some things on the Revolution I am going to say som.docxgerardkortney
 
· Chapter 9 – Review the section on Establishing a Security Cultur.docx
· Chapter 9 – Review the section on Establishing a Security Cultur.docx· Chapter 9 – Review the section on Establishing a Security Cultur.docx
· Chapter 9 – Review the section on Establishing a Security Cultur.docxgerardkortney
 
· Chapter 10 The Early Elementary Grades 1-3The primary grades.docx
· Chapter 10 The Early Elementary Grades 1-3The primary grades.docx· Chapter 10 The Early Elementary Grades 1-3The primary grades.docx
· Chapter 10 The Early Elementary Grades 1-3The primary grades.docxgerardkortney
 
· Chapter 5, Formulating the Research Design”· Section 5.2, Ch.docx
· Chapter 5, Formulating the Research Design”· Section 5.2, Ch.docx· Chapter 5, Formulating the Research Design”· Section 5.2, Ch.docx
· Chapter 5, Formulating the Research Design”· Section 5.2, Ch.docxgerardkortney
 
· Chap 2 and 3· what barriers are there in terms of the inter.docx
· Chap 2 and  3· what barriers are there in terms of the inter.docx· Chap 2 and  3· what barriers are there in terms of the inter.docx
· Chap 2 and 3· what barriers are there in terms of the inter.docxgerardkortney
 
· Case Study 2 Improving E-Mail Marketing ResponseDue Week 8 an.docx
· Case Study 2 Improving E-Mail Marketing ResponseDue Week 8 an.docx· Case Study 2 Improving E-Mail Marketing ResponseDue Week 8 an.docx
· Case Study 2 Improving E-Mail Marketing ResponseDue Week 8 an.docxgerardkortney
 
· Briefly describe the technologies that are leading businesses in.docx
· Briefly describe the technologies that are leading businesses in.docx· Briefly describe the technologies that are leading businesses in.docx
· Briefly describe the technologies that are leading businesses in.docxgerardkortney
 
· Assignment List· My Personality Theory Paper (Week Four)My.docx
· Assignment List· My Personality Theory Paper (Week Four)My.docx· Assignment List· My Personality Theory Paper (Week Four)My.docx
· Assignment List· My Personality Theory Paper (Week Four)My.docxgerardkortney
 
· Assignment List· Week 7 - Philosophical EssayWeek 7 - Philos.docx
· Assignment List· Week 7 - Philosophical EssayWeek 7 - Philos.docx· Assignment List· Week 7 - Philosophical EssayWeek 7 - Philos.docx
· Assignment List· Week 7 - Philosophical EssayWeek 7 - Philos.docxgerardkortney
 
· Assignment 3 Creating a Compelling VisionLeaders today must be .docx
· Assignment 3 Creating a Compelling VisionLeaders today must be .docx· Assignment 3 Creating a Compelling VisionLeaders today must be .docx
· Assignment 3 Creating a Compelling VisionLeaders today must be .docxgerardkortney
 
· Assignment 4· Week 4 – Assignment Explain Theoretical Perspec.docx
· Assignment 4· Week 4 – Assignment Explain Theoretical Perspec.docx· Assignment 4· Week 4 – Assignment Explain Theoretical Perspec.docx
· Assignment 4· Week 4 – Assignment Explain Theoretical Perspec.docxgerardkortney
 
· Assignment 2 Leader ProfileMany argue that the single largest v.docx
· Assignment 2 Leader ProfileMany argue that the single largest v.docx· Assignment 2 Leader ProfileMany argue that the single largest v.docx
· Assignment 2 Leader ProfileMany argue that the single largest v.docxgerardkortney
 
· Assignment 1 Diversity Issues in Treating AddictionThe comple.docx
· Assignment 1 Diversity Issues in Treating AddictionThe comple.docx· Assignment 1 Diversity Issues in Treating AddictionThe comple.docx
· Assignment 1 Diversity Issues in Treating AddictionThe comple.docxgerardkortney
 

More from gerardkortney (20)

· Describe strategies to build rapport with inmates and offenders .docx
· Describe strategies to build rapport with inmates and offenders .docx· Describe strategies to build rapport with inmates and offenders .docx
· Describe strategies to build rapport with inmates and offenders .docx
 
· Debates continue regarding what constitutes an appropriate rol.docx
· Debates continue regarding what constitutes an appropriate rol.docx· Debates continue regarding what constitutes an appropriate rol.docx
· Debates continue regarding what constitutes an appropriate rol.docx
 
· Critical thinking paper ·  ·  · 1. A case study..docx
· Critical thinking paper ·  ·  · 1. A case study..docx· Critical thinking paper ·  ·  · 1. A case study..docx
· Critical thinking paper ·  ·  · 1. A case study..docx
 
· Create a Press Release for your event - refer to slide 24 in thi.docx
· Create a Press Release for your event - refer to slide 24 in thi.docx· Create a Press Release for your event - refer to slide 24 in thi.docx
· Create a Press Release for your event - refer to slide 24 in thi.docx
 
· Coronel & Morris Chapter 7, Problems 1, 2 and 3.docx
· Coronel & Morris Chapter 7, Problems 1, 2 and 3.docx· Coronel & Morris Chapter 7, Problems 1, 2 and 3.docx
· Coronel & Morris Chapter 7, Problems 1, 2 and 3.docx
 
· Complete the following problems from your textbook· Pages 378.docx
· Complete the following problems from your textbook· Pages 378.docx· Complete the following problems from your textbook· Pages 378.docx
· Complete the following problems from your textbook· Pages 378.docx
 
· Consider how different countries approach aging. As you consid.docx
· Consider how different countries approach aging. As you consid.docx· Consider how different countries approach aging. As you consid.docx
· Consider how different countries approach aging. As you consid.docx
 
· Clarifying some things on the Revolution I am going to say som.docx
· Clarifying some things on the Revolution I am going to say som.docx· Clarifying some things on the Revolution I am going to say som.docx
· Clarifying some things on the Revolution I am going to say som.docx
 
· Chapter 9 – Review the section on Establishing a Security Cultur.docx
· Chapter 9 – Review the section on Establishing a Security Cultur.docx· Chapter 9 – Review the section on Establishing a Security Cultur.docx
· Chapter 9 – Review the section on Establishing a Security Cultur.docx
 
· Chapter 10 The Early Elementary Grades 1-3The primary grades.docx
· Chapter 10 The Early Elementary Grades 1-3The primary grades.docx· Chapter 10 The Early Elementary Grades 1-3The primary grades.docx
· Chapter 10 The Early Elementary Grades 1-3The primary grades.docx
 
· Chapter 5, Formulating the Research Design”· Section 5.2, Ch.docx
· Chapter 5, Formulating the Research Design”· Section 5.2, Ch.docx· Chapter 5, Formulating the Research Design”· Section 5.2, Ch.docx
· Chapter 5, Formulating the Research Design”· Section 5.2, Ch.docx
 
· Chap 2 and 3· what barriers are there in terms of the inter.docx
· Chap 2 and  3· what barriers are there in terms of the inter.docx· Chap 2 and  3· what barriers are there in terms of the inter.docx
· Chap 2 and 3· what barriers are there in terms of the inter.docx
 
· Case Study 2 Improving E-Mail Marketing ResponseDue Week 8 an.docx
· Case Study 2 Improving E-Mail Marketing ResponseDue Week 8 an.docx· Case Study 2 Improving E-Mail Marketing ResponseDue Week 8 an.docx
· Case Study 2 Improving E-Mail Marketing ResponseDue Week 8 an.docx
 
· Briefly describe the technologies that are leading businesses in.docx
· Briefly describe the technologies that are leading businesses in.docx· Briefly describe the technologies that are leading businesses in.docx
· Briefly describe the technologies that are leading businesses in.docx
 
· Assignment List· My Personality Theory Paper (Week Four)My.docx
· Assignment List· My Personality Theory Paper (Week Four)My.docx· Assignment List· My Personality Theory Paper (Week Four)My.docx
· Assignment List· My Personality Theory Paper (Week Four)My.docx
 
· Assignment List· Week 7 - Philosophical EssayWeek 7 - Philos.docx
· Assignment List· Week 7 - Philosophical EssayWeek 7 - Philos.docx· Assignment List· Week 7 - Philosophical EssayWeek 7 - Philos.docx
· Assignment List· Week 7 - Philosophical EssayWeek 7 - Philos.docx
 
· Assignment 3 Creating a Compelling VisionLeaders today must be .docx
· Assignment 3 Creating a Compelling VisionLeaders today must be .docx· Assignment 3 Creating a Compelling VisionLeaders today must be .docx
· Assignment 3 Creating a Compelling VisionLeaders today must be .docx
 
· Assignment 4· Week 4 – Assignment Explain Theoretical Perspec.docx
· Assignment 4· Week 4 – Assignment Explain Theoretical Perspec.docx· Assignment 4· Week 4 – Assignment Explain Theoretical Perspec.docx
· Assignment 4· Week 4 – Assignment Explain Theoretical Perspec.docx
 
· Assignment 2 Leader ProfileMany argue that the single largest v.docx
· Assignment 2 Leader ProfileMany argue that the single largest v.docx· Assignment 2 Leader ProfileMany argue that the single largest v.docx
· Assignment 2 Leader ProfileMany argue that the single largest v.docx
 
· Assignment 1 Diversity Issues in Treating AddictionThe comple.docx
· Assignment 1 Diversity Issues in Treating AddictionThe comple.docx· Assignment 1 Diversity Issues in Treating AddictionThe comple.docx
· Assignment 1 Diversity Issues in Treating AddictionThe comple.docx
 

Recently uploaded

Holdier Curriculum Vitae (April 2024).pdf
Holdier Curriculum Vitae (April 2024).pdfHoldier Curriculum Vitae (April 2024).pdf
Holdier Curriculum Vitae (April 2024).pdfagholdier
 
Unit-IV- Pharma. Marketing Channels.pptx
Unit-IV- Pharma. Marketing Channels.pptxUnit-IV- Pharma. Marketing Channels.pptx
Unit-IV- Pharma. Marketing Channels.pptxVishalSingh1417
 
Role Of Transgenic Animal In Target Validation-1.pptx
Role Of Transgenic Animal In Target Validation-1.pptxRole Of Transgenic Animal In Target Validation-1.pptx
Role Of Transgenic Animal In Target Validation-1.pptxNikitaBankoti2
 
ICT role in 21st century education and it's challenges.
ICT role in 21st century education and it's challenges.ICT role in 21st century education and it's challenges.
ICT role in 21st century education and it's challenges.MaryamAhmad92
 
The basics of sentences session 3pptx.pptx
The basics of sentences session 3pptx.pptxThe basics of sentences session 3pptx.pptx
The basics of sentences session 3pptx.pptxheathfieldcps1
 
1029-Danh muc Sach Giao Khoa khoi 6.pdf
1029-Danh muc Sach Giao Khoa khoi  6.pdf1029-Danh muc Sach Giao Khoa khoi  6.pdf
1029-Danh muc Sach Giao Khoa khoi 6.pdfQucHHunhnh
 
Advanced Views - Calendar View in Odoo 17
Advanced Views - Calendar View in Odoo 17Advanced Views - Calendar View in Odoo 17
Advanced Views - Calendar View in Odoo 17Celine George
 
Introduction to Nonprofit Accounting: The Basics
Introduction to Nonprofit Accounting: The BasicsIntroduction to Nonprofit Accounting: The Basics
Introduction to Nonprofit Accounting: The BasicsTechSoup
 
PROCESS RECORDING FORMAT.docx
PROCESS      RECORDING        FORMAT.docxPROCESS      RECORDING        FORMAT.docx
PROCESS RECORDING FORMAT.docxPoojaSen20
 
TỔNG ÔN TẬP THI VÀO LỚP 10 MÔN TIẾNG ANH NĂM HỌC 2023 - 2024 CÓ ĐÁP ÁN (NGỮ Â...
TỔNG ÔN TẬP THI VÀO LỚP 10 MÔN TIẾNG ANH NĂM HỌC 2023 - 2024 CÓ ĐÁP ÁN (NGỮ Â...TỔNG ÔN TẬP THI VÀO LỚP 10 MÔN TIẾNG ANH NĂM HỌC 2023 - 2024 CÓ ĐÁP ÁN (NGỮ Â...
TỔNG ÔN TẬP THI VÀO LỚP 10 MÔN TIẾNG ANH NĂM HỌC 2023 - 2024 CÓ ĐÁP ÁN (NGỮ Â...Nguyen Thanh Tu Collection
 
This PowerPoint helps students to consider the concept of infinity.
This PowerPoint helps students to consider the concept of infinity.This PowerPoint helps students to consider the concept of infinity.
This PowerPoint helps students to consider the concept of infinity.christianmathematics
 
Energy Resources. ( B. Pharmacy, 1st Year, Sem-II) Natural Resources
Energy Resources. ( B. Pharmacy, 1st Year, Sem-II) Natural ResourcesEnergy Resources. ( B. Pharmacy, 1st Year, Sem-II) Natural Resources
Energy Resources. ( B. Pharmacy, 1st Year, Sem-II) Natural ResourcesShubhangi Sonawane
 
Presentation by Andreas Schleicher Tackling the School Absenteeism Crisis 30 ...
Presentation by Andreas Schleicher Tackling the School Absenteeism Crisis 30 ...Presentation by Andreas Schleicher Tackling the School Absenteeism Crisis 30 ...
Presentation by Andreas Schleicher Tackling the School Absenteeism Crisis 30 ...EduSkills OECD
 
microwave assisted reaction. General introduction
microwave assisted reaction. General introductionmicrowave assisted reaction. General introduction
microwave assisted reaction. General introductionMaksud Ahmed
 
Ecological Succession. ( ECOSYSTEM, B. Pharmacy, 1st Year, Sem-II, Environmen...
Ecological Succession. ( ECOSYSTEM, B. Pharmacy, 1st Year, Sem-II, Environmen...Ecological Succession. ( ECOSYSTEM, B. Pharmacy, 1st Year, Sem-II, Environmen...
Ecological Succession. ( ECOSYSTEM, B. Pharmacy, 1st Year, Sem-II, Environmen...Shubhangi Sonawane
 
Basic Civil Engineering first year Notes- Chapter 4 Building.pptx
Basic Civil Engineering first year Notes- Chapter 4 Building.pptxBasic Civil Engineering first year Notes- Chapter 4 Building.pptx
Basic Civil Engineering first year Notes- Chapter 4 Building.pptxDenish Jangid
 
Python Notes for mca i year students osmania university.docx
Python Notes for mca i year students osmania university.docxPython Notes for mca i year students osmania university.docx
Python Notes for mca i year students osmania university.docxRamakrishna Reddy Bijjam
 
psychiatric nursing HISTORY COLLECTION .docx
psychiatric  nursing HISTORY  COLLECTION  .docxpsychiatric  nursing HISTORY  COLLECTION  .docx
psychiatric nursing HISTORY COLLECTION .docxPoojaSen20
 

Recently uploaded (20)

Holdier Curriculum Vitae (April 2024).pdf
Holdier Curriculum Vitae (April 2024).pdfHoldier Curriculum Vitae (April 2024).pdf
Holdier Curriculum Vitae (April 2024).pdf
 
Unit-IV- Pharma. Marketing Channels.pptx
Unit-IV- Pharma. Marketing Channels.pptxUnit-IV- Pharma. Marketing Channels.pptx
Unit-IV- Pharma. Marketing Channels.pptx
 
Role Of Transgenic Animal In Target Validation-1.pptx
Role Of Transgenic Animal In Target Validation-1.pptxRole Of Transgenic Animal In Target Validation-1.pptx
Role Of Transgenic Animal In Target Validation-1.pptx
 
ICT role in 21st century education and it's challenges.
ICT role in 21st century education and it's challenges.ICT role in 21st century education and it's challenges.
ICT role in 21st century education and it's challenges.
 
The basics of sentences session 3pptx.pptx
The basics of sentences session 3pptx.pptxThe basics of sentences session 3pptx.pptx
The basics of sentences session 3pptx.pptx
 
1029-Danh muc Sach Giao Khoa khoi 6.pdf
1029-Danh muc Sach Giao Khoa khoi  6.pdf1029-Danh muc Sach Giao Khoa khoi  6.pdf
1029-Danh muc Sach Giao Khoa khoi 6.pdf
 
Advanced Views - Calendar View in Odoo 17
Advanced Views - Calendar View in Odoo 17Advanced Views - Calendar View in Odoo 17
Advanced Views - Calendar View in Odoo 17
 
Introduction to Nonprofit Accounting: The Basics
Introduction to Nonprofit Accounting: The BasicsIntroduction to Nonprofit Accounting: The Basics
Introduction to Nonprofit Accounting: The Basics
 
INDIA QUIZ 2024 RLAC DELHI UNIVERSITY.pptx
INDIA QUIZ 2024 RLAC DELHI UNIVERSITY.pptxINDIA QUIZ 2024 RLAC DELHI UNIVERSITY.pptx
INDIA QUIZ 2024 RLAC DELHI UNIVERSITY.pptx
 
PROCESS RECORDING FORMAT.docx
PROCESS      RECORDING        FORMAT.docxPROCESS      RECORDING        FORMAT.docx
PROCESS RECORDING FORMAT.docx
 
TỔNG ÔN TẬP THI VÀO LỚP 10 MÔN TIẾNG ANH NĂM HỌC 2023 - 2024 CÓ ĐÁP ÁN (NGỮ Â...
TỔNG ÔN TẬP THI VÀO LỚP 10 MÔN TIẾNG ANH NĂM HỌC 2023 - 2024 CÓ ĐÁP ÁN (NGỮ Â...TỔNG ÔN TẬP THI VÀO LỚP 10 MÔN TIẾNG ANH NĂM HỌC 2023 - 2024 CÓ ĐÁP ÁN (NGỮ Â...
TỔNG ÔN TẬP THI VÀO LỚP 10 MÔN TIẾNG ANH NĂM HỌC 2023 - 2024 CÓ ĐÁP ÁN (NGỮ Â...
 
This PowerPoint helps students to consider the concept of infinity.
This PowerPoint helps students to consider the concept of infinity.This PowerPoint helps students to consider the concept of infinity.
This PowerPoint helps students to consider the concept of infinity.
 
Energy Resources. ( B. Pharmacy, 1st Year, Sem-II) Natural Resources
Energy Resources. ( B. Pharmacy, 1st Year, Sem-II) Natural ResourcesEnergy Resources. ( B. Pharmacy, 1st Year, Sem-II) Natural Resources
Energy Resources. ( B. Pharmacy, 1st Year, Sem-II) Natural Resources
 
Presentation by Andreas Schleicher Tackling the School Absenteeism Crisis 30 ...
Presentation by Andreas Schleicher Tackling the School Absenteeism Crisis 30 ...Presentation by Andreas Schleicher Tackling the School Absenteeism Crisis 30 ...
Presentation by Andreas Schleicher Tackling the School Absenteeism Crisis 30 ...
 
microwave assisted reaction. General introduction
microwave assisted reaction. General introductionmicrowave assisted reaction. General introduction
microwave assisted reaction. General introduction
 
Ecological Succession. ( ECOSYSTEM, B. Pharmacy, 1st Year, Sem-II, Environmen...
Ecological Succession. ( ECOSYSTEM, B. Pharmacy, 1st Year, Sem-II, Environmen...Ecological Succession. ( ECOSYSTEM, B. Pharmacy, 1st Year, Sem-II, Environmen...
Ecological Succession. ( ECOSYSTEM, B. Pharmacy, 1st Year, Sem-II, Environmen...
 
Asian American Pacific Islander Month DDSD 2024.pptx
Asian American Pacific Islander Month DDSD 2024.pptxAsian American Pacific Islander Month DDSD 2024.pptx
Asian American Pacific Islander Month DDSD 2024.pptx
 
Basic Civil Engineering first year Notes- Chapter 4 Building.pptx
Basic Civil Engineering first year Notes- Chapter 4 Building.pptxBasic Civil Engineering first year Notes- Chapter 4 Building.pptx
Basic Civil Engineering first year Notes- Chapter 4 Building.pptx
 
Python Notes for mca i year students osmania university.docx
Python Notes for mca i year students osmania university.docxPython Notes for mca i year students osmania university.docx
Python Notes for mca i year students osmania university.docx
 
psychiatric nursing HISTORY COLLECTION .docx
psychiatric  nursing HISTORY  COLLECTION  .docxpsychiatric  nursing HISTORY  COLLECTION  .docx
psychiatric nursing HISTORY COLLECTION .docx
 

Organizing warehousemanagementN. FaberNetherlands Defe.docx

  • 1. Organizing warehouse management N. Faber Netherlands Defence Academy, Breda, The Netherlands, and M.B.M. de Koster and A. Smidts Rotterdam School of Management, Erasmus University, Rotterdam, The Netherlands Abstract Purpose – The purpose of this paper is to investigate how warehouse management, understood as a cluster of planning and control decisions and procedures, is organized and driven by task complexity (TC) and market dynamics (MD). Design/methodology/approach – A multi-variable conceptual model is developed based on the literature and tested among 215 warehouses using a survey. Findings – The results suggest that TC and MD are the main drivers of warehouse management, measured by planning extensiveness (PE), decision rules complexity, and control sophistication. Differences between production and distribution warehouses are found with respect to the relationship between assortment changes and PE. Furthermore, TC appears to be a main driver of the specificity of the warehouse management (information) system (WMS).
  • 2. Research limitations/implications – This paper is based on 215 warehouses in The Netherlands and Flanders (Belgium); future research may test the model on a different sample. More research should be conducted to further validate the measures of the core dimensions of warehouse management. Practical implications – Different levels of TC and MD characterize warehouses. Such a characterization is a first step in determining generic warehouse functionalities and helping managers to decide on the best software for their warehouse operations. Originality/value – The paper defines the core dimensions of warehouse management, makes them measurable, tests them and assesses how these drivers impact specificity of WMS. The paper shows that PE in production warehouses is driven by different variables than in distribution centers. Keywords Logistics, Survey, Conceptual framework, Empirical, Information management, Operations planning Paper type Research paper 1. Introduction The warehouse is today playing a more vital role than it ever has in the success (or failure) of businesses (Frazelle, 2002). Warehouses play a critical intermediate role between supply chain members, affecting both supply chain costs and service (Kiefer and Novack, 1999). In an attempt to rationalize supply chain
  • 3. processes and to manage them more efficiently, many companies have set up centralized production and warehouse facilities over the last decades (HIDC/BCI, 2001). This has resulted in larger warehouses responsible for the distribution to a greater diversity of more demanding The current issue and full text archive of this journal is available at www.emeraldinsight.com/0144-3577.htm The authors gratefully acknowledge Michael Murtin, Emile Bouwman, Sanne van Rhenen, Wessel Koning and Sebatiaan Ruys for their hard work in collecting data (via the telephone) for this study. Received 14 December 2011 Revised 30 March 2012 14 June 2012 Accepted 17 September 2012 International Journal of Operations & Production Management Vol. 33 No. 9, 2013 pp. 1230-1256 q Emerald Group Publishing Limited 0144-3577 DOI 10.1108/IJOPM-12-2011-0471 IJOPM 33,9 1230
  • 4. customers in a vaster region and, consequently, with more complex internal logistic processes (see the survey of ELA/AT Kearney, 2005). As a consequence, managing complex warehouses effectively and efficiently has become a challenging task. An important question therefore is how warehouse management, as a cluster of planning and control decisions and procedures, is organized in order to meet today’s challenges. Warehouse management encompasses the control and optimization of complex warehouse and distribution processes (Ten Hompel and Schmidt, 2006), and it depends on the tasks to be performed and on the market the warehouse operates in. In the area of production management, it is commonly accepted that the produced volume and product variety (i.e. task complexity) and the rate of change of the external environment (i.e. market dynamics) are the main drivers of the planning and control structure (Bertrand et al., 1990; De Toni and Panizzolo, 1997; Hatch, 1997; Peterson and Silver, 1979; Van Assen, 2005). However, systematic research into the drivers of the warehouse planning and control structure seems to be lacking. Rouwenhorst et al. (2000) and Gu et al. (2007, 2010) conclude in their reviews of warehouse management literature that analysis-oriented research on isolated subproblems is dominant in the current warehouse management
  • 5. literature. This study takes the first step in exploring the drivers of warehouse management. Warehouse processes that need to be planned and controlled include: inbound flow handling, product-to-location assignment, product storage, order-to-stock location allocation, order batching and release, order picking, packing, value-added logistics activities, and shipment (Ackerman and La Londe, 1980; Frazelle, 2002). Particularly storage and order picking are complex, often labor-intensive processes that determine warehouse performance to a large part. Our first contribution is to define and make measurable the core characteristics of warehouse management. To the best of our knowledge, there is currently hardly any literature that clearly captures warehouse management as a coherent whole. Because this study is just a first step in exploring the dimensions of warehouse management, we consider warehouse management at a high level of aggregation. We propose and define the constructs necessary to do this, focusing on both planning and control activities within the warehouse and on the decision rules used to schedule and optimize the inbound, storage, and retrieval processes in the warehouse. Second, we establish and test the drivers of warehouse management. Following the literature on production systems (Van Assen, 2005), we
  • 6. distinguish task complexity and market dynamics as the main drivers of the warehouse planning and control activities and of the decision rules used. Task complexity measures the depth and breadth of the tasks a warehouse has to perform and is internally oriented. Market dynamics measures the rate of change of the external environment in which a warehouse operates. In general, we expect that a more complex warehouse task results in more complex decision rules for scheduling and optimizing inbound, storage, and outbound activities. Warehouse planning and control depends both on the complexity of the warehouse task and on the dynamics of the market. We test these propositions in our study. Our third contribution relates to a specific aspect of warehouse management: the warehouse management (information) system (WMS). Information systems play a significant role in managing complex processes (LeBlanc, 2000). We assess the degree to which the drivers of warehouse management impact the specificity of the information system. Establishing the dependency of the WMS’s specificity on these Organizing warehouse management 1231
  • 7. drivers may help managers to decide on the most effective information system to suit the warehouse management’s needs. Since many standard warehouse management software systems are available on the market (Loudin, 1998; Randal, 1999), selecting one can be a difficult task. We carried out a survey to test our theory and collected data on 215 warehouses and distribution centers in The Netherlands and Flanders (Belgium). Warehousing is of particular importance to The Netherlands and Flanders due to their geographical location with deep-sea ports (Rotterdam and Antwerp), major European air-cargo hubs (Schiphol and Zaventem), and direct connections via water (barge and short-sea), road, and rail to a large part of industrial Europe. More than half of all European Distribution Centers (EDCs) are located in this region (BCI, 1997; HIDC/BCI, 2001; Kuipers, 1999). The level of performance of warehousing operations in the region is generally high, represented in high labor productivity and low error rates (OECD, 2006). High costs of land and labor, and increasing labor shortages are forcing companies to invest in people and automation systems with a relatively long-term investment horizon. The organization of this paper is as follows. In Sections 2 and 3, we develop our constructs and formulate our hypotheses. In Section 4, we
  • 8. describe our research methodology, including the sample selection and data collection approaches and the measures of the constructs. Section 5 describes the results of the data analysis and hypotheses testing. Section 6 concludes the paper. 2. General framework for warehouse management 2.1 Warehouse management Analogous to production management (Bertrand et al., 1990), the objective of warehouse management is to efficiently and effectively coordinate all warehouse processes and activities (Harmon, 1993; Tompkins et al., 2003). Warehouse management includes all planning and control procedures to operate the warehouse. Planning and control is concerned with managing the ongoing activities of the operations so as to satisfy customer demand (Slack et al., 2001). The main purpose of planning and control is to ensure that operations run effectively and produce products and services as they should (Slack et al., 2001). Whereas planning involves deciding what should be done and how, control is the process of ensuring that the desired output (plan) is obtained (Anthony and Young, 1984; Van Goor et al., 2003). Planning is therefore proactive and control is reactive. Together, plans and controls regulate outputs. Within planning, we distinguish a tactical and an operational level. At the tactical decision level, warehouses draw up plans to make efficient use of resources and to fulfill market demand. However, due to the highly dynamic environment, for many warehouses
  • 9. the tactical planning horizon is only days or weeks rather than months. At the operational level, decision rules are used to sequence, schedule, and optimize planned activities (Slack et al., 2001). In the literature, the dimensions of warehouse management have not yet been explored. Based on the above literature and interviews with experts, we propose to broadly define warehouse management as a combination of the planning and control systems and the decision rules used for inbound, storage, and outbound flows. We now consider each aspect in more detail. Tactical planning system. A plan is a formalization of what is intended to happen at some time in the future (Slack et al., 2001). Plans or norms specify a desired output (expressed in quantity, quality, cost, timing, etc.) at some future time. The most IJOPM 33,9 1232 important tactical issues in warehouses include: stock planning, storage-location assignment planning, transport planning, and capacity (personnel and equipment) planning. For a comprehensive overview of these and other planning processes, see
  • 10. Van den Berg (1999) and Van den Berg and Zijm (1999). Stock planning decides which products are kept in storage in what quantities, and determines when shipments arrive. Intelligent stock planning may reduce warehousing costs. Storage location planning decides the location types (for example, shelf, pallet, high-bay or block-stack) and the zones within these storage areas where the products will be stored. An effective storage-location assignment plan may reduce the need for space and the mean travel time for storage/retrieval and order picking. Capacity planning and transport planning determine the required personnel, equipment, and transport capacities. Making such tactical plans is time consuming and should only be done if they lead to performance improvements. Therefore, the number of tactical plans may vary per warehouse. We define the construct planning extensiveness by the number of tactical plans a warehouse explicitly draws up. Inbound, storage and outbound decision rules. Tactical plans determine which products arrive in what quantities, where these should be stored and how much personnel, equipment, and transport is needed to process the products and orders. Tactical plans define a framework for the operational planning level (Van den Berg, 1999). Operational decisions typically deal with the sequencing, scheduling, and
  • 11. routing of order picking and storage/retrieval operations. There are many different rules that can help operations make these decisions and improve performance (Chen et al., 2010; Rouwenhorst et al., 2000). For an overview of decision rules focusing on storage and order picking, see De Koster et al. (2007) or Wäscher (2004). The complexity of the decision rules implemented in a warehouse differs per warehouse. Complexity is a well-defined construct in management literature (Alter, 1999; Hatch, 1997; Huber, 1984). The complexity of a system depends on the number of differentiated components of the system, the number of interacting components, and the nature of the interaction between components (Alter, 1999). We therefore define the construct decision rules complexity as the number of different types of decision rules used for inbound, storage, and outbound activities and the perceived complexity of these rules. Control system. When plans are implemented, things do not always happen as expected (Slack et al., 2001). For example, customers may change their minds about what they want and when they want it, suppliers may not deliver on time, machines may fail, inventory records may be inaccurate, and staff may be absent due to sickness. Control is the process of coping with these changes (Slack et al., 2001). It relates to the feedback and corrective action function of the management
  • 12. system. By monitoring what actually happens and making the necessary changes, control makes the adjustments which allow operations to achieve the objectives that were laid down in the plan (Slack et al., 2001). Thus, monitoring, analyzing, reporting and intervening are core functions of the control system. For this purpose, information about the progress and realization of the plans is essential (Anthony and Young, 1984). The time to respond to deviations and changes is limited. Therefore, in this study, we consider the speed at which data is transformed into information by the control system as the most important Organizing warehouse management 1233 dimension of control. Accurate and timely information on the shop floor is essential to control operations. Information can be recorded and presented on paper, online, or in real-time if radio-frequency technology is used with mobile terminals and scanners, or with voice response. As the speed of the transformation of data into
  • 13. information increases, the control system becomes more sophisticated. However, the degree of sophistication of the control system must be justified economically, i.e. the higher accuracy and the lower stock-outs must outweigh the extra costs of the control system. As a consequence, the sophistication of the control system differs per warehouse. We define the construct control sophistication as the speed of transforming data into information used by warehouse employees to decide and act upon. Based on the above-mentioned dimensions of warehouse management, we define warehouse management as a combination of planning extensiveness, decision rules complexity, and control sophistication. 2.2 Warehouse management (information) system In most warehouses, information systems support warehouse management. Such information systems can be either built specifically for a warehouse (tailor-made) or bought off-the-shelf (standard software package). Software is primarily focused on broad or specific functionality (Lynch, 1985). A software product with broad functionality supports a large number of different processes in an organization (e.g. an ERP system). Although ERP systems can be configured to the customer’s processes, the fine-tuning is complex (Somers and Nelson, 2003) and configuring the system involves making compromises and has its limits (Davenport, 1998). Software products with
  • 14. specific functionality support a smaller number of processes in an organization but with more intensity (e.g. WMS). The specificity of the information system will differ per warehouse. We define the construct information system specificity by distinguishing six different types of information systems with an ascending degree of specificity. 2.3 Drivers of warehouse management The basic premise of our study is that the best approach to warehouse management depends on the specific characteristics of the warehouse. Traditional contingency theorists such as Burns and Stalker (1961) and Lawrence and Lorsch (1967) suggest that effectiveness derives from structuring an administrative arrangement appropriate to the nature of an organization’s environment. In the operations management literature, it is also a generally accepted assumption that the environmental context influences the appropriateness of the organization of the planning and control system (Sousa and Voss, 2008). Van Goor et al. (2003) state that the characteristics of the market, the products, and the processes determine the way supply chains are managed; and according to Fisher (1997) and Lee (2002), the choice of a supply chain control depends on the product type and the predictability of the market. The need to consider the environmental context is obvious and widely accepted in literature. With regard to warehouse management, the environment refers to the
  • 15. immediate operating environment that is beyond the control of management in the short run. Therefore, we decided to concentrate on narrowly defined parts of the environment rather than overall industry parameters. Analogous to Van Assen (2005), in this study, IJOPM 33,9 1234 the warehouse operations environment consists of the external warehouse environment (i.e. the market) and the internal warehouse system. The core concept that captures the effects of the organization’s environment on its performance is uncertainty (Thompson, 1967). Researchers in organizational theory identify two major dimensions of uncertainty: complexity and dynamism (Duncan, 1972; Hatch, 1997; Miller and Friesen, 1983; Premkumar and Zailani, 2005). Complexity refers to the number and diversity of the elements in an environment (Hatch, 1997). The warehouse system can be characterized by the products (SKUs) that have to be stored and picked, the processes to store and pick these products, and the orders that request the delivery of these products. Complexity increases as the number and diversity of SKUs, order lines, and processes increase. In general, if the number of SKUs increases,
  • 16. more storage space (often different type and control logic) will be needed and more products have to be registered and managed in the warehouse information system. Some warehouses have a greater number and/or variety of processes and some of these activities are labor intensive and have substantial impact on order throughput time. The number of order lines is a good indicator for the total amount of work in order picking and thereby for the total amount of work to be done in the warehouse. In general, the majority of warehouse work is in order picking (Drury, 1988). We conceptualize environmental complexity with regard to warehouse management as the complexity of the task a warehouse has to perform. Thus, we define the construct task complexity by: . the number of different products (SKUs) handled in the warehouse; . the number and variety of the processes carried out by the warehouse; and . the number of order lines processed by the warehouse per day. Task complexity affects warehouse management through the comprehensibility of the work to be done. Environmental dynamism is characterized by the rate of change and technology innovation in the industry as well as the uncertainty or unpredictability of the actions of competitors and customers (Burns and Stalker, 1961; Lawrence
  • 17. and Lorsch, 1967; Thompson, 1967). At the level of the immediate operating environment, warehouse management interacts directly with customers. Other factors relevant to the warehouse’s goal setting, such as competitors, suppliers, government, technology, economy, and labor have a less direct influence on warehouse management and, for this reason, are not considered in this study. We conceptualize environmental dynamism with regard to warehouse management as the dynamism in the customer market. We define the construct market dynamics by: . the unpredictability of market demand; and . the rate of change in the taste and preference among customers. Unpredictability of market demand refers to the difficulty of forecasting customer behavior (Khandwalla, 1977). It is difficult to know just how customers will react to very new products and services, and to anticipate the various problems that might occur. The rate of change in customers’ preferences refers to the turbulence of the market. Warehouses that operate in more turbulent markets are likely to have to continually modify their products and services in order to satisfy customers’ changing preferences. A dynamic market also manifests itself in frequent assortment changes. Organizing
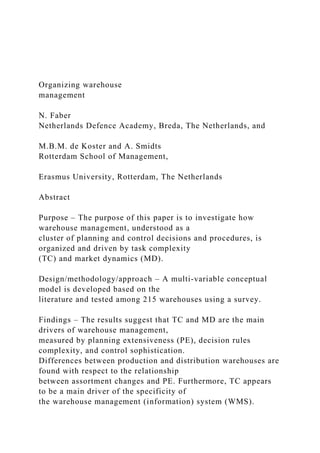
  • 18. warehouse management 1235 Market dynamics affects warehouse management through the predictability of the work to be done. The consideration of task complexity and market dynamics provides a sound starting point to study the drivers of warehouse management. Our full research model is shown in Figure 1. Task complexity and market dynamics are expected to strongly affect how warehouse management is organized. The organization of warehouse management takes shape in three dimensions (planning extensiveness, decision rules complexity, control sophistication), and is reflected in warehouse management’s information system specificity. It should be noted that warehouse management is not solely determined by these two main drivers. In reality, many other elements must be in place for warehouse management to be successful. These include an educated and well-trained workforce, appropriate alliances with customers and suppliers, well- designed strategic planning processes, well-designed lay-out and systems, well-designed work processes, etc. Task
  • 19. complexity and market dynamics were selected for this study because they play a key role in designing and managing warehouse systems. To our knowledge, the relationship between the dependent constructs planning extensiveness, decision rules complexity, control sophistication, and information system specificity and the independent constructs task complexity and market dynamics has not been addressed in the literature. 3. Hypotheses The task a warehouse has to perform is complex if the number of SKUs, process diversity, and number of daily order lines are high. As the complexity of a system Figure 1. Research model Warehouse Management Structure Task Complexity Number of SKUs Planning Extensiveness Number of plans Decision Rules Complexity Market Dynamics Process Diversity
  • 20. Number of order lines Control Sophistication Speed of transformation of information Number of different types of decision rules Nature of decision rules • Demand Unpredictability • • • • Assortment Changes Warehouse Management (Information) System Information System Specificity • • • • IJOPM 33,9
  • 21. 1236 increases, managing the system becomes harder (Van Assen, 2005). Each resource has to be aligned to perform the warehousing activities. This can be done efficiently only if the resources and the relationships between these resources are coordinated in a timely, complete, and reliable fashion (Van Assen, 2005). This means that tactical and operational planning is necessary. The first hypothesis of our study is: H1. The more complex the warehouse task, the more extensive the planning. It can be expected that the decision rules (i.e. operational plans) used to schedule and optimize activities in the warehouse will be complex when the task is complex. For example, a large number of SKUs generally implies that many of them will need different storage and order picking logic and conditions (think of size, weight, physical condition, packaging, and product carriers like totes or pallets), all laid down in decision rules. If the number of SKUs, process diversity, and number of order lines is small, we expect the decision rules to be simple. The second hypothesis of our study is: H2. The more complex the warehouse task, the more complex the decision rules.
  • 22. If the warehouse task is complex, the organizational structure can be adapted to deal with this (Espejo and Watt, 1988), and management may delegate responsibilities downward in the organization to reduce complexity (Mintzberg, 1983). However, the lower levels of the organization have to justify their decisions by regularly reporting progress and results to management. We therefore expect a more complex warehouse task to require more comprehensive and thus, more sophisticated instruments to control the task. The third hypothesis of our study is: H3. The more complex the warehouse task, the more sophisticated the control system. Based on a sample of 20 production and distribution warehouses, Faber et al. (2002) found that complex warehouses (measured by the number of order lines processed per day and the number of active SKUs), use tailor-made software solutions whereas simple warehouses use standard software solutions to support warehouse management. Hence we expect that if the warehouse task is complex, a standard software solution will be difficult to find because the situation is too specific. In such situations, only a tailor-made, specific solution or a standard, specific software package with substantial customization will be effective. A simple warehouse task can be supported by standard, broad solutions or even by no automated information system. The fourth hypothesis of our study is:
  • 23. H4. The more complex the warehouse task, the more specific the functionality of the information system. Major characteristics of a dynamic market are demand unpredictability (DU) and frequent assortment changes. Extensive tactical planning is not effective in a highly dynamic environment because plans have to change constantly. Short-term planning or coordination by feedback (Perrow, 1967), i.e. negotiated alterations in the nature or sequence of tasks, would be more effective in this situation. In contrast, if the market is stable, extensive planning is advisable in order to make efficient use of warehouse resources (personnel, machines, transport, and stock locations) and to minimize stock. These arguments lead to the fifth hypothesis of this study: H5. The more dynamic the market of a warehouse, the less extensive the planning. Organizing warehouse management 1237 As decision rules are internally oriented, externally driven unpredictability of demand and assortment changes will have much less influence on the
  • 24. complexity of decision rules. Thus, we do not propose an influence of market dynamics on decision rules complexity. Some operations are reasonably predictable and usually run according to plan. In these situations, the need for control is minimal (Slack et al., 2001). Dynamism affects the reliability of the information and the assumptions that are used in planning. The higher the rate of change, the more momentarily available information is (Van Assen, 2005). The internal reporting system has to process and deliver information rapidly to keep up with changes. Also, in a dynamic market, online information exchange with partners (suppliers and/or customers) in the supply and demand chain is needed to respond to market changes. The sixth hypothesis of our study is, therefore: H6. The more dynamic the market of a warehouse, the more sophisticated the control system. The H6 of this study are shown in Figure 2. All hypotheses are directional, which means the relationships are positive or negative. We carried out a survey to test our hypotheses. 4. Method 4.1 Data collection and sample Data were collected by means of a survey among warehouse managers. The final
  • 25. questionnaire consisted of 55 questions divided into ten sections (general data, warehouse type, assortment, order lines, processes, market situation, planning, decision rules, control, and information systems). The questionnaire was extensively pre-tested for clarity and for assessing the length of the interview. A face- to-face pretest with two warehouse managers of different warehouses indicated that we had to improve the wording of a number of questions and response categories. Later on, we tested the Figure 2. Hypotheses Warehouse Management StructureH5 Task Complexity Planning Extensiveness Decision Rules Complexity – +H1 H2 + Control Sophistication Warehouse Management (Information) System
  • 26. H3 H6 + + Market Dynamics Information System Specificity H4 + IJOPM 33,9 1238 improved questionnaire by telephone on two other warehouse managers representing two more warehouses. This led to some minor changes in the questionnaire. A single database on warehouses in The Netherlands does not exist. We aimed at a complete representation of medium and large warehouses. We constructed a database by cooperating with HIDC, the Holland International Distribution Council, who owns a database of all multinational warehouse operations in The Netherlands (HIDC/BCI, 2001). We extended the database with the membership lists of well-known logistics
  • 27. associations in The Netherlands (www.NDL.nl, www.FENEX.nl, IMCC and VLM) and Flanders (Belgium) (www.VIL.be, www.warehouseandlogisitcs.com and www.bruca rgo.be). All, except two of these lists, were available on the internet. The remaining two were disclosed at our request. The database was further completed with recent lists of attendees of workshops and conferences on warehouse management. We targeted warehouses representing various industry sectors, with different positions in the supply chain (varying from production-related warehouses, i.e. storing not only finished products but also raw materials and components – to wholesale and retail warehouses), and different outsourcing relations. After eliminating duplicate listings and incomplete addresses, our sample population consisted of 765 warehouses, which provides good coverage of the medium and larger warehouses in The Netherlands and Flanders. These warehouses were approached in two waves. The first wave of 250 warehouses gathered from the HIDC database and lists of attendees of workshops and conferences was contacted by telephone and asked to collaborate. Obtaining answers to the questions was an elaborate job. For one thing, the targeted managers were very busy, and a single contact sometimes required about three to four calls to complete the questionnaire (several calls were required to ensure that the managers had prepared the questionnaire which contained many questions on factual
  • 28. data). 101 warehouses were willing to participate. The most often-heard argument for non-response was that the questionnaire was too time consuming. Due to the rather small absolute sample size of the first wave, in the second wave, we approached 515 warehouses, based on the membership lists of logistics associations in The Netherlands and Flanders, by sending a cover letter and the questionnaire by e-mail. Two steps were taken to increase response. First, the survey instrument and process were made as user friendly as possible by using various media, i.e. a web-based questionnaire on the internet, an electronic questionnaire, and a hardcopy. Second, we approached all non-responding addressees a second time by e- mail. The most often-heard argument for non-response was lack of time. In the second wave, 114 warehouses filled in the questionnaire. If deemed necessary, follow-up calls were made to verify responses, solve ambiguities, or to ask the respondent to check objective data. After carefully checking the responses of both waves for completeness and eligibility, 215 completed questionnaires could be used for this study, representing a response rate of 28 percent. Given the low response rates for surveys in the logistics industry in general (Muilerman, 2001), this response rate is good. Because the respondents represent an organization, they must be knowledgeable about
  • 29. the main constructs (Huber and Power, 1985). We requested a logistics or warehousing executive, preferably the warehouse manager, to complete the questionnaire. The warehouse manager is probably one of the few people with sufficient knowledge about the data in our questionnaire. For this reason, we had to use a single respondent. Table I shows that we were quite successful in contacting the preferred informant: 85 percent of the Organizing warehouse management 1239 respondents are senior warehouse managers and 15 percent are logistics staff members. Table I also shows other demographic data such as warehouse types, general industry classification, and number of warehouse employees. Table I shows that our sample covers a wide variety of industries, from automotive to retail, and it represents all types of warehouses. The average number of full-time direct employees is 78, the average number of stored SKUs per warehouse in our sample is 14,000, and the average number of shipped order lines is over 10,000 per day. Although our research is limited to The Netherlands and Flanders, warehousing
  • 30. practices in these regions are not different from elsewhere in Western Europe. In fact, many companies run multiple similar facilities elsewhere in Western Europe (Quak and De Koster, 2007). Overall, we conclude that the response is large enough and sufficiently diverse to draw meaningful conclusions for medium and large warehouses. 4.2 Measures Keller et al. (2002) provide a directory of all multi-item scales published in leading logistics journals from 1961 to 2000. Most scales for the constructs included in this study were not available in the literature. Hence, we developed our own measures for these constructs. An important issue in this regard is whether constructs are considered reflective or formative (Diamantopoulos and Winklhofer, 2001). The choice of Respondent’s position % Type of warehouse % Sector % Number of warehouse employees % Senior manager 85.1 Production
  • 31. warehouse 10.2 Automotive 5.6 , 10 14.0 Logistics staff 14.9 Distribution center insourced 58.1 Healthcare 3.3 11-20 15.8 Distribution center outsourced 31.7 Pharmaceutical 3.3 21-30 13.0 Defence/police 4.2 31-50 13.5 Foodretail 5.1 51-70 10.7 Agricultural products/ food products 7.4 71-100 10.2 Information and communication technology 11.2 101-160 11.2 Industrial products 18.1 161-250 6.0 Other products (mainly consumer products)
  • 32. 28.4 251-370 1.9 Public warehouses 13.5 371-520 2.3 520-700 1.4 Total 100 Total 100.0 Total 100.0 Total 100.0 Mean 78 SD 106 Note: n ¼ 215 Table I. Sample description IJOPM 33,9 1240 a formative versus a reflective specification depends on the causal priority between the measurable items and the latent variable ( Jarvis et al., 2003). In operationalizing the constructs of our study, we closely followed the recommendations of Churchill (1979) and particularly Rossiter (2002), who updates and elaborates the Churchill paradigm of scale development. Each construct was defined and four experts in the domain of warehouse management (two academics and two warehouse managers) provided specific items to measure these constructs. After several
  • 33. discussion rounds, our experts concluded that all constructs in our study are formative. Fundamental to formative constructs is that all items of the construct contribute to the construct; omitting an item is omitting a part of the construct. Therefore, we kept items in our construct even if they did not correlate strongly with other items in that particular construct. The resulting indicators per construct are presented and discussed below. A compilation of the constructs and their measures is summarized in Appendix. Task complexity is measured by summing up the standardized scores of: . Number of SKUs (TCa). This variable is measured as the log of the number of SKUs since the effect of the number of SKUs on task complexity is expected to be skewed (Faber et al., 2002; De Koster and Balk, 2008). . Process diversity (TCb). Following Faber et al. (2002) and Schoenherr et al. (2010), this variable is measured by both the number of special processes and the number of modes in which processes can be carried out in the warehouse. Instead of measuring the number of all the different processes, we only measure the number of special processes. Nearly all warehouses perform processes such as receiving, storage, internal replenishment from bulk to pick areas, order picking, and shipping, but some warehouses also perform special processes. Examples include product
  • 34. repacking, return handling, customs clearance, cycle counting for stock integrity, cross-docking, and value adding activities. We measure the number of special processes on a binary scale with five special processes as a split value; five is a fairly large value since most warehouses have at least some special processes. Warehouse processes can be carried out in different modes. For example, storing products in a shelf area differs substantially from storing products in a pallet area with regard to procedures, product carriers, and material-handling equipment used. The same is true for order picking in such areas. Complexity is driven by the average number of modes in which processes are carried out. We measure this average number of modes on a binary scale with three as a split value; three is a relatively small value, justified by a low average number of modes per process in most warehouses. . Number of order lines (TCc). This variable is measured as the log of the number of order lines since the effect of the number of order lines on task complexity is expected to be skewed (Faber et al., 2002). To measure market dynamics (MD), we used Miller and Friesen’s (1983) perceptual measures for dynamism. Here, market dynamics is measured as the sum of the standardized scores of: . Demand unpredictability (DU). This variable is measured as
  • 35. the sum score of three questions asking for perceived demand predictability in the very short, in the short, and in the long-run, each measured on a three-point scale (predictable, limited predictability, and difficult to predict). Organizing warehouse management 1241 . Assortment changes (AC). The frequency and amount of assortment change is measured on a three-point scale (hardly, to a limited extent, and to a great extent). Warehouse management structure is measured by three constructs: (1) Planning extensiveness (PE). We measure this construct by the number of tactical plans that are explicitly drawn up in the warehouse (ranging from 0 to a maximum of four plans). (2) Decision rules complexity (DC). We measure the number of different types of decision rules (DCa) by counting activities that are systematically executed using decision rules. We distinguished 12 activities (see Appendix for the full
  • 36. list). We measure the nature of the decision rules (DCb) by asking the respondent’s opinion on the perceived complexity of both inbound and outbound rules, each measured on a three-point scale (ranging from simple to complex). The score for decision rules complexity is obtained by summing the standardized scores of both parts (DCa, DCb). (3) Control sophistication (CS). This construct is measured by two indicators: the sophistication of the internal reporting system and the online information exchange with partners (using, e.g. EDI). The sophistication of the reporting system is the degree to which data in a warehouse are recorded and monitored online (CS1, CS2), and the reaction time to unforeseen situations (CS3). The aspects are all measured on a binary scale. Online information exchange (scheduling information, plans, orders, etc.) with business partners is the degree of online information sharing with suppliers and customers, respectively, on a yes/no scale (CS4, CS5). The total score is the sum of all aspects of the reporting system and online information exchange with partners. Information system specificity (IS). This is measured by distinguishing six different types of information systems with an ascending degree of specificity, ranging from no automated system to a tailor-made system (see Appendix for precise levels).
  • 37. At the construct level, we assume all subdimensions to contribute equally to a construct. 5. Results To assess the relationship between warehouse characteristics and warehouse management, we performed a series of regression analyses. The correlations between the variables specified in Table II are the input for the regressions. The results are shown in Table III. The regressions were conducted both at the construct level (see results on upper part of Table III) and at the subdimension level (results on lower part of Table III). At the subdimension level, we conducted stepwise regression among the five independent variables and we present results only for variables for which p , 0.10 (two-tailed). We chose a higher p-value because of the exploratory character of this study. We also tested for interaction effects between the main constructs. These turned out to be not significant for any of the dimensions of warehouse management. H1 predicted a positive relationship between task complexity and planning extensiveness, whereas H5 predicted a negative relationship between market dynamics and planning extensiveness. The results in Table III confirm a significant and positive effect of task complexity (standardized regression coefficient beta ¼ 0.29, p , 0.001)
  • 64. 0 .0 5 Table II. Correlations Organizing warehouse management 1243 and a negative effect of market dynamics (b ¼ 20.14, p , 0.038). Table III shows that task complexity and market dynamics explain approximately 10 percent of the variance in planning extensiveness. However, the regression analysis in the lower part of Table III shows that 21 percent of the variance in planning extensiveness is explained by the subdimensions. Especially “number of order lines” has a strong positive effect on planning extensiveness. A detailed examination of the relationship between market dynamics and planning extensiveness indicates that the two subdimensions of market dynamics appear to work in opposite directions. As expected, the subdimension “demand unpredictability” has a
  • 65. significant negative effect on planning extensiveness (correlation ¼ 20.27, p , 0.001, Table II), which means that if demand is more difficult to predict, planning will be less extensive. Contrary to our expectation, the subdimension “assortment changes” appears to affect planning extensiveness marginally positively (correlation ¼ 0.12, p , 0.074, Table II). This means that if the assortment of the warehouse changes often, tactical planning will be more extensive. This result seems to suggest that changes in the assortment of a warehouse are predictable. Our initial expectation was based on theories that mainly focus on production situations in which changes in the assortment are considered unpredictable thus increasing uncertainty (Fisher, 1997). Indeed, frequent product changes may be rather unpredictable in a production environment. Planning extensiveness (PE) Decision rules complexity (DC) Control sophistication (CS) Information system specificity (IS)
  • 66. b t p B t p b t p b t p Construct level analysis Task complexity (TC) 0.29 4.41 0.000 0.44 7.00 0.000 0.20 2.96 0.003 0.33 5.00 0.000 Market dynamics (MD) 20.14 22.08 0.038 20.05 20.71 0.477 0.04 0.54 0.587 0.04 0.60 0.553 R 2 0.10 0.19 0.04 0.11 n 210 210 207 208 Subdimension analysis Task complexity (TC) Log no. of SKUs (TCa) 20.17 22.29 0.023 0.19 2.75 0.007 Process diversity (TCb) 0.18 2.70 0.007 0.23 3.69 0.000 0.17 2.55 0.011 Log no. of order lines (TCc) 0.38 5.13 0.000 0.37 5.91 0.000 0.33 5.10 0.000 Market dynamics (MD) Demand unpredictability (DU) 20.16 22.37 0.019 Assortment changes (AC) R 2 0.21 0.21 0.04 0.15
  • 67. n 210 210 207 208 Table III. Regressions IJOPM 33,9 1244 However, when information about product changes and new products is exchanged between production and distribution, a distribution center should be able to predict the changes in the assortment. This even encourages distribution centers to put more effort into planning to cope with these changes. Support for this interpretation can be found when comparing the production warehouses and the distribution centers in our sample with respect to the effect of the subdimension “assortment changes” on planning extensiveness. Production warehouses store and distribute raw materials, semi-finished and finished products in a production environment. Distribution centers store products between point- of-production and point-of-consumption and are located close to the products’ markets. In other words, production warehouses are located upstream, whereas distribution centers are located downstream in the supply-and-demand chain. We therefore expect a negative effect of
  • 68. negative effect of assortment changes in production warehouses. Although we have to be cautious since the number of production warehouses is relatively small in our sample (n ¼ 22), the results of a separate regression (Table IV) for production warehouses show a significant negative effect (b ¼ 20.45, p , 0.027). This means that the more the assortment changes, the less extensive is the planning. Changes in the assortment are difficult to predict and therefore difficult to plan for in production warehouses. In distribution centers (n ¼ 193), no significant effect of assortment changes on planning extensiveness shows up in Table IV because the effects of the other variables, especially “number of order lines” are more dominant. The results of correlation analyses (Table V) Production warehouses Distribution centers Planning extensiveness (PE) Planning extensiveness (PE) b t p b t p Construct level analysis Task complexity (TC) 20.12 20.64 0.530 0.32 4.65 0.000 Market dynamics (MD) 20.60 23.20 0.005 20.10 21.40 0.162 R 2 0.39 0.11 n 21 189 Subdimension analysis Task complexity (TC) No. of SKUs (TCa) 20.14 21.85 0.066
  • 69. Process diversity (TCb) 0.18 2.60 0.010 No. of order lines (TCc) 0.40 5.07 0.000 Market dynamics (MD) Demand unpredictability (DU) 20.46 22.48 0.023 20.15 22.08 0.039 Assortment changes (AC) 20.45 22.42 0.027 R 2 0.38 0.22 n 21 189 Table IV. Regression production warehouses vs distribution centers Production warehouses Distribution centers Planning extensiveness (PE) Planning extensiveness (PE) R p n r p n Assortment changes (AC) 20.38 0.083 22 0.18 0.015 192 Table V. Correlation “assortment changes” and planning extensiveness Organizing warehouse management
  • 70. 1245 show a significant positive correlation (correlation ¼ 0.18, p , 0.015)) between “assortment changes” and planning extensiveness for distribution centers, and a negative correlation (correlation ¼ 20.38, p , 0.083) for production warehouses. Our results indicate that because distribution centers are located downstream in the supply chain, assortment changes can be predicted and planned. Table IV shows, in addition, that market dynamics drives planning extensiveness (b ¼ 20.60, p , 0.005) in production warehouses, and that task complexity drives planning extensiveness (b ¼ 0.32, p , 0.001) in distribution centers. Distribution centers appear to process significantly more order lines (mean ¼ 11,715, SD ¼ 27,585) than production warehouses (mean ¼ 881, SD ¼ 766) (t ¼ 3.47, p , 0.001), which explains the stronger effect of task complexity on planning extensiveness in distribution warehouses. H2 predicted a positive relationship between task complexity and decision rules complexity. Table III shows that 19 percent of the variance in decision rules complexity is explained by task complexity. The results in Table III confirm a significant and positive effect of task complexity (b ¼ 0.44, p , 0.001): the more complex the warehouse task, the more complex are the decision rules. As
  • 71. expected, market dynamics has no significant effect on decision rules complexity ( p , 0.477). H3 and H6 predicted an effect of both task complexity and market dynamics on control sophistication. The results in Table III confirm H3 (b ¼ 0.20, p , 0.003) and rejects H6 (b ¼ 0.04, p , 0.587). A more complex warehouse task requires more sophisticated control, while a more dynamic market does not affect control. Only 4 percent of the variance in control sophistication can be explained by task complexity. We conclude that task complexity and market dynamics do not explain the variances in control sophistication; other factors may play a role, and further research is needed here. H4 predicted that warehouses with a complex task need a more customized and tailor-made information system. Table III shows that the information system specificity is indeed significantly and positively affected by task complexity (b ¼ 0.33, p , 0.001). 11 percent of the variance in information system specificity is explained by task complexity. We conclude that a more specific and customized information system is required once a warehouse task becomes more complex. As expected, market dynamics has no effect on information system specifictiy. We tested for several control variables, such as industry sector and respondent’s position, by adding variables to the subdimension regression of
  • 72. Table III, applying a Chow (F-change) test for increase in explained variance. We only found significant effects of industry sector for three warehousing dimensions, i.e. decision rules complexity (F-change ¼ 2.72, p , 0.007), control sophistication (F-change ¼ 2.11, p , 0.036), and information system specificity (F-change ¼ 3.11, p , 0.002). No effect of industry sector was found for planning extensiveness ( p . 0.24). A more detailed analysis reveals that information system specificity is significantly higher than average for the sector public warehouses ( p , 0.001). A possible explanation for why public warehouses use significantly more specific information systems (72 percent have implemented a WMS) could be that logistic-service providers serve multiple clients in such warehouses (on average 4.4 within a single facility. De Koster and Warffemius (2005) which all require specific processes. Such a diversity of processes is, in general, not sufficiently supported by generic warehouse management systems. This could also explain the significantly higher-than- average decision rules complexity in public warehouses ( p , 0.013). In addition, decision rules complexity IJOPM 33,9 1246
  • 73. is significantly lower ( p , 0.018) than average for the healthcare/pharmaceutical sector. This might be due to a smaller-than-average diversity in outbound processes. In this sector, all shipments are in small quantities, picked from storage systems, fit for piece picking. A greater diversity can be often observed in the dedicated systems in other industry sectors, since next to piece picking, box and pallet picking also takes place. Finally, control sophistication is significantly lower for defence/police warehouses ( p , 0.002) and for industrial products warehouses ( p , 0.038). For defence/police warehouses, especially online information exchange with business partners is particularly low. This could be explained by the important role of security and data protection in such warehouses. Warehouses with industrial products are located upstream in the supply chain. As lead times generally increase upstream in supply chains, this implies that such warehouses have a longer planning horizon and do not have to respond in real-time to changes and unforeseen situations. To summarize, we find clear support for H1, H2, H4, and H5, but weak support for H3, and no support for H6 (Figure 3). For H1 and H5, we found different effects for production warehouses and distribution centers. H1 is supported by distribution centers, but not by production warehouses; and H5 is supported
  • 74. by production warehouses, but not by distribution centers. With regard to market dynamics, the subdimension “demand unpredictability” behaves as expected, but the effect of the subdimension “assortment changes” seems to be different in distribution centers than in production warehouses. The variable “assortment changes” does not seem to be a characteristic of a dynamic market in distribution centers. Importantly, most subdimensions of the independent constructs have significant effects and differ in size. This indicates the importance of measuring the constructs in a detailed manner and analyzing the subdimensions separately. 6. Conclusions and future research In this paper, we proposed and defined warehouse management by three constructs: planning extensiveness, decision rules complexity, and control sophistication. Figure 3. Results Warehouse Management StructureH5 Task Complexity Planning Extensiveness (in distribution centers) Decision Rules Complexity
  • 75. – +H1 H2 + Planning Extensiveness (in production warehouses) Control Sophistication Warehouse Management H3 + Market Dynamics (Information) System Information System Specificity H4 + Organizing warehouse management 1247 We developed a model linking the two main drivers of warehouse management, task complexity and market dynamics, and tested this model in a large sample of warehouses. In the process, we developed new measures for most constructs.
  • 76. We empirically find that warehouse management is largely driven by task complexity and to a much lesser extent by market dynamics. Our results show that the more complex the warehouse task is, the more extensive is the planning and the more complex are the decision rules. Furthermore, a complex warehouse task leads to a more sophisticated control system. Our H5 is weakly supported by the data. This is mainly due to the role of the subdimension “assortment changes” in the market dynamics construct. Assortment changes appear to have a different effect in distribution centers than in production warehouses. Whereas the subdimension “demand unpredictability” indeed leads to less extensive planning, frequent assortment changes lead to more extensive planning in distribution centers. In hindsight, this makes sense as changing assortments is regular business (think of regular promotions, seasonal products) in many distribution centers, and stock and location plans have to anticipate this. Furthermore, we find that distribution centers process significantly more order lines per day than production warehouses. This phenomenon, together with the opposite effect of “assortment changes”, explains why planning extensiveness is driven by market dynamics in production warehouses and by task complexity in distribution centers. Our H6 is not supported by the data. Apparently, only task complexity plays a dominant role.
  • 77. We expected to find the choice of the WMS (measured by information system specificity) to be driven by task complexity. Indeed, the data confirm our H4 that the more complex the warehouse task is, the more specific is the functionality of the information system. Other factors than TC obviously play a role in the WMS choice. For example, logistics service providers do not base their WMS choice on a single warehouse but on the various warehouses they operate. The organization of warehouse management is strongly related to the specificity of the information system: all three dimensions (planning extensiveness, decision rules complexity, and control sophistication) correlate positively with the specificity of the software system. This was to be expected as generic software systems do not sufficiently support complex requirements. In this research, we contributed to the study of warehouse management by developing new measures for most constructs. We provided an extensive and detailed operationalization of each construct and its subdimensions. Most of these measures were developed using objective facts about the warehouse and the insights and observations of expert informants, usually the senior warehouse manager. Future research should be conducted to further validate the measures. Our operationalization could be used as a starting point for developing measures in similar
  • 78. contexts such as transshipment terminals and cross-dock operations. Further research could also test whether the current operationalizations (dimensions and subdimensions) are general enough to be applied outside of the warehouse context, for instance, in production. Our research focused on warehousing in The Netherlands and Flanders. It would be interesting to test our hypotheses in warehouses in non-Western countries. A priori, we do not expect significantly different results. In addition, it might be interesting to extend the sample with more production warehouses to more robustly test for differences between production warehouses and distribution centers. In our study, we still find IJOPM 33,9 1248 a substantial variability in responses to task complexity and market dynamics. In follow-up research, in-depth case studies might provide additional insight into the implementation of the subdimensions of warehouse management. Our proposed operationalization provides means to systematically study other aspects of warehousing. Most notably, how warehouse
  • 79. management affects warehouse performance. In particular, it would be interesting to research whether a (mis)match between the independent variables, task complexity and market dynamics, and the way warehouse management is organized impacts warehouse performance. Such a study would complement current studies on warehouse performance (De Koster and Balk, 2008; De Koster and Warffemius, 2005; Hackman et al., 2001) that did not test drivers. Detailed case studies could provide more insight into the motivations and reasons for apparent mismatches. Such reasons might be diverse. Think of warehouses with physical constraints (e.g. space shortage, outdated systems, poor layout) that have not been able to timely adapt to changes in the environment or tasks. Furthermore, it would be interesting to study the impact of differences in WMS and the choice of WMS on performance. Finally, this study could help warehouse managers to benchmark their warehouse against the independent constructs developed in this paper. Knowledge of scores on these indicators can help managers effectively organize warehouse management and assist them with their choice of WMS; in particular, whether a standard system will do, or whether a system with specific functionalities will be more appropriate. References
  • 80. Ackerman, K.B. and La Londe, B.J. (1980), “Making warehousing more efficient”, Harvard Business Review, Vol. 58 No. 2, pp. 94-102. Alter, S. (1999), Information Systems: A Management Perspective, 3rd ed., Addison-Wesley, Reading, MA. Anthony, R.N. and Young, D.W. (1984), Management Control in Non-profit Organizations, 3rd ed., R.D. Irwin, Homewood, IL. BCI (1997), Europese distributie en waardetoevoeging door buitenlandse bedrijven (European Distribution and Value Added Logistics by Foreign Companies), BCI, Nijmegen, pp. 39-54, In Dutch. Bertrand, J.W.M., Wortmann, J.C. and Wijngaard, J. (1990), Production Control: A Structural and Design Oriented Approach, Elsevier, Amsterdam. Burns, T. and Stalker, G.M. (1961), The Management of Innovation, Tavistock, London. Chen, C.-M., Gong, Y., De Koster, M.B.M. and Van Nunen, J.A.E.E. (2010), “A flexible evaluative framework for order picking systems”, Production and Operations Management, Vol. 19 No. 1, pp. 70-82. Churchill, G.A. (1979), “A paradigm for developing better measures of marketing constructs”, Journal of Marketing Research, Vol. 16 No. 1, pp. 64-73.
  • 81. Davenport, T.H. (1998), “Putting the enterprise into the enterprise system”, Harvard Business Review, Vol. 16 No. 4, pp. 121-131. De Koster, M.B.M. and Balk, B. (2008), “Benchmarking and monitoring international warehouse operations in Europe”, Production and Operations Management, Vol. 17 No. 2, pp. 1-10. Organizing warehouse management 1249 De Koster, M.B.M. and Warffemius, P.M.J. (2005), “American, Asian and third-party international warehouse operations in Europe: a performance comparison”, International Journal of Operations & Production Management, Vol. 25 No. 8, pp. 762- 780. De Koster, M.B.M., Le-Duc, T. and Roodbergen, K.J. (2007), “Design and control of warehouse order picking: a literature review”, European Journal of Operational Research, Vol. 182 No. 2, pp. 481-501. De Toni, A. and Panizzolo, R. (1997), “Repetitive manufacturing planning and control systems: a framework for analysis”, Production Planning and Control, Vol. 8 No. 5, pp. 500-508.
  • 82. Diamantopoulos, A. and Winklhofer, H.M. (2001), “Index construction with formative indicators: an alternative to scale development”, Journalof MarketingResearch, Vol. 38 No. 2, pp. 269-277. Drury, J. (1988), “Towards more efficient order picking”, IMM Monograph 1, The Institute of Materials Management, Cranfield. Duncan, R. (1972), “Characteristics of organizational environments and perceived environmental uncertainty”, Administrative Science Quarterly, Vol. 17 No. 3, pp. 313-327. ELA/AT Kearney (2005), Excellence in Logistics 2004: Differentiation for Performance, ELA, Brussels. Espejo, R. and Watt, J. (1988), “Information management, organization and managerial effectiveness”, The Journal of the Operational Research Society, Vol. 39 No. 1, pp. 7-14. Faber, N., De Koster, M.B.M. and Van de Velde, S.L. (2002), “Linking warehouse complexity to warehouse planning and control structure: an exploratory study of the use of warehouse management information systems”, International Journal of Physical Distribution & Logistics Management, Vol. 32 No. 5, pp. 381-395. Fisher, M.L. (1997), “What is the right supply chain for your product?”, Harvard Business Review, Vol. 75 No. 2, pp. 105-116.
  • 83. Frazelle, E.H. (2002), World-Class Warehousing and Material Handling, McGraw-Hill, New York, NY. Gu, J., Goetschalckx, M. and McGinnis, L.F. (2007), “Research on warehouse operation: a comprehensive review”, European Journal of Operational Research, Vol. 177 No. 1, pp. 1-21. Gu, J., Goetschalckx, M. and McGinnis, L.F. (2010), “Research on warehouse design and performance evaluation: a comprehensive review”, European Journal of Operational Research, Vol. 203 No. 3, pp. 539-549. Hackman, S.T., Frazelle, E.H., Griffin, P.M., Griffin, S.O. and Vlasta, D.A. (2001), “Benchmarking warehousing and distribution operations: an input-output approach”, Journal of Productivity Analysis, Vol. 16 No. 1, pp. 79-100. Harmon, R.L. (1993), Reinventing the Warehouse, Word-Class Distribution Logistics, The Free Press, New York, NY. Hatch, M.J. (1997), Organization Theory: Modern Symbolic and Postmodern Perspectives, Oxford University Press, New York, NY. HIDC/BCI (2001), From EDC to ELC, Holland International Distribution Council, The Hague. Huber, G.P. (1984), “The nature and design of post-industrial organizations”, Management Science, Vol. 30 No. 8, pp. 928-951.
  • 84. Huber, G.P. and Power, D.J. (1985), “Retrospective reports of strategic-level managers: guidelines for increasing their accuracy”, Strategic Management Journal, Vol. 6 No. 2, pp. 171-180. Jarvis, C.B., MacKenzie, S.B. and Podsakoff, P.M. (2003), “A critical review of construct indicators and measurement model misspecification in marketing and consumer research”, Journal of Consumer Research, Vol. 30 No. 3, pp. 199-218. IJOPM 33,9 1250 Keller, S.B., Savitskie, K., Stank, T.P., Lynch, D.F. and Ellinger, A.E. (2002), “A summary and analysis of multi-item scales used in logistics research”, Journal of Business Logistics, Vol. 23 No. 2, pp. 703-729. Khandwalla, P.N. (1977), The Design of Organizations, Harcourt Brace Jovanovich, New York, NY. Kiefer, A.W. and Novack, R.A. (1999), “An empirical analysis of warehouse measurement systems in the context of supply chain implementation”, TransportationJournal, Vol. 38 No. 3, pp. 18-27. Kuipers, B. (1999), “Liège, Tongeren, Genk or the Maasvlakte: what’s the difference? Spatial behaviour of European Distribution Centres”, in Rodenburg, R.H.J. and Kruse, A.L. (Eds),
  • 85. Vervoerslogistieke Werkdagen 1999, Connekt, Delft, pp. 433- 445. Lawrence, P.R. and Lorsch, J.W. (1967), Organization and Environment, Harvard Business Graduate School Press, Boston, MA. LeBlanc, L.J. (2000), “The impact of information technology on operations management”, International Journal of Technology Management, Vol. 20 Nos 3/4, pp. 243-251. Lee, H.L. (2002), “Aligning supply chain strategies with product uncertainties”, California Management Review, Vol. 44 No. 3, pp. 105-119. Loudin, A. (1998), “Pick a winner”, Warehousing Management, Vol. 5 No. 11, p. 34. Lynch, R.K. (1985), “Nine pitfalls in implementing packaged applications software”, The Journal of Information Systems Management, Vol. 2 No. 2, pp. 88-94. Miller, D. and Friesen, P.H. (1983), “Strategy making and environment: the third link”, Strategic Management Journal, Vol. 4 No. 3, pp. 221-235. Mintzberg, H. (1983), Structure in Fives: Designing Effective Organizations, Prentice-Hall, Englewood Cliffs, NJ. Muilerman, G. (2001), “Time based logistics: an analysis of the relevance, causes and impacts”, published PhD thesis, Delft University of Technology, Delft. OECD (2006), OECD Estimates of Labour Productivity for
  • 86. 2005, September, available at: www.oecd.org/dataoecd/30/40/29867116.xls Perrow, C. (1967), “A framework for the comparative analysis of organizations”, American Sociological Review, Vol. 32 No. 2, pp. 194-208. Peterson, R. and Silver, E.A. (1979), Decision Systems for Inventory Management and Production Planning, 2nd ed., Wiley, New York, NY. Premkumar, R. and Zailani, S. (2005), “Supply chain integration and performance: US versus East Asian companies”, Supply Chain Management: An International Journal, Vol. 10 No. 5, pp. 379-393. Quak, H.J. and De Koster, M.B.M. (2007), “Exploring retailers’ sensitivity to local sustainability policies”, Journal of Operations Management, Vol. 25 No. 6, pp. 1103-1122. Randall, S. (1999), “The value of WMS”, Modern Materials Handling, Vol. 54 No. 7, pp. 50-52. Rossiter, J.R. (2002), “The C-OAR-SE procedure for scale development in marketing”, International Journal of Research in Marketing, Vol. 19 No. 4, pp. 305-335. Rouwenhorst, B., Reuter, B., Stockrahm, V., Van Houtum, G.J., Mantel, R.J. and Zijm, W.H.M. (2000), “Warehouse design and control: framework and literature review”, European Journal of Operations Research, Vol. 122 No. 3, pp. 515-533.
  • 87. Schoenherr, T., Hilpet, D., Soni, A.K., Venkataramanan, M.A. and Mabert, V.A. (2010), “Enterprise systems complexity and its antecedents: a grounded-theory approach”, International Journal of Operations and Production Management, Vol. 30 No. 6, pp. 639-668. Slack, N., Chambers, S. and Johnston, R. (2001), Operations Management, 3rd ed., Prentice-Hall, Harlow. Organizing warehouse management 1251 Somers, T.M. and Nelson, K.G. (2003), “The impact of strategy and integration mechanisms on enterprise system value: empirical evidence from manufacturing firms”, European Journal of Operational Research, Vol. 146 No. 2, pp. 315-338. Sousa, R. and Voss, C.A. (2008), “Contingency research in operations management practices”, Journal of Operations Management, Vol. 26 No. 2, pp. 697-713. Ten Hompel, M. and Schmidt, T. (2006), Warehouse Management: Automation and Organisation of Warehouse and Order Picking Systems, Springer, Berlin. Thompson, J.D. (1967), Organization in Action, McGraw-Hill, New York, NY.
  • 88. Tompkins, J.A., White, J.A., Bozer, Y.A. and Tanchoco, J.M.A. (2003), Facilities Planning, Wiley, New York, NY. Van Assen, M.F. (2005), “Empirical studies in discrete parts manufacturing management”, published PhD thesis, RSM Erasmus University, Rotterdam. Van den Berg, J.P. (1999), “A literature survey on planning and control of warehousing systems”, IIE Transactions, Vol. 31 No. 8, pp. 751-762. Van den Berg, J.P. and Zijm, W.H.M. (1999), “Models for warehouse management: classification and examples”, International Journal of Production Economics, Vol. 59 Nos 1/3, pp. 519-528. Van Goor, A.R., Ploos van Amstel, M.J. and Ploos van Amstel, W. (2003), European Distribution and Supply Chain Logistics, Stenfert Kroese, Groningen. Wäscher, G. (2004), “Order picking: a survey of planning problems and methods”, in Dyckhoff, H., Lackes, R. and Reese, J. (Eds), Supply Chain Management and Reverse Logistics, Springer, Berlin, pp. 323-347. About the authors N. Faber is an Associate Professor of Logistics at The Netherlands Defense Academy, and a Doctoral Researcher at the Rotterdam School of Management, Erasmus University. Her research interests are warehousing, defense logistics and supply chain management. N. Faber is the corresponding author and can be contacted at: [email protected]
  • 89. M.B.M. de Koster is Professor of Logistics and Operations Management at the Rotterdam School of Management, Erasmus University. His research interests are warehousing, material handling, retail operations, and behavioral operations. He is (co-) author/editor of eight books and over 130 papers in books and journals including Journal of Operations Management, Transportation Science, Production and Operations Management, and International Journal of Operations and Production Management. He is a member of the ELA R&D committee, of the BVL Scientific Advisory Board, Chairman of the Material Handling Forum, and in the editorial review boards of seven journals. A. Smidts is Professor of Marketing Research at the Rotterdam School of Management, Erasmus University and Director of the Erasmus Center for Neuroeconomics. He was Scientific Director of the Erasmus Research Institute of Management (ERIM) and Dean of Research of the Rotterdam School of Management from 2004 to 2011. His research interests include behavioral decision making and persuasive communication. He is currently working in the area of decision neuroscience and neuromarketing. His research has been published in journals such as Management Science, Academy of Management Journal, Marketing Science, International Journal of Research in Marketing, Journal of Consumer Research, Journal of Consumer Psychology, Social Cognitive & Affective Neuroscience, Psychological Science, Journal of Neuroscience and Neuron.
  • 90. IJOPM 33,9 1252 To purchase reprints of this article please e-mail: [email protected] Or visit our web site for further details: www.emeraldinsight.com/reprints Appendix V a ri a b le D es cr ip ti o n A cc
  • 129. 2 ¼ 3 (c o n ti n u ed ) Table AI. Summary of measures Organizing warehouse management 1253 V a ri a b le D
  • 232. b ef o re su m m in g Table AI. IJOPM 33,9 1256 Reproduced with permission of the copyright owner. Further reproduction prohibited without permission. AN ANALYSIS AND IMPLEMENTATION OF AN INFORMATION MANAGEMENT SYSTEM FOR STUDENTS AND STAFFS Department of Computer Science, Faculty of Mathematical
  • 233. Sciences, University for Development Studies, Navrongo, Ghana. ABSTRACT Developing software systems has become the fastest, most perfect and affordable way of approaching problems using information technology and deriving the best of all possible solutions to meet customer's needs in this world of globalization. This research is an analysis and implementation of a computerised system that is going to be used at the UDS in the Computer Science Department. This is to minimize drastically the numerous challenges associated with the manual system that is currently in use. This system is programmed to connect to an SQL Server which holds the database that serves as the backend data storage for the system. This software basically stores details of student registration and examination result information. It as well stores information of lecturers in the department. This system can be used to create backup files for the database to prevent data loss when events such as illegal alterations of data and natural disaster occur. Keywords: Information Technology, Management Systems, Database, Server Backup, Registration. SALIFU ABDUL-MUMIN
  • 234. By INTRODUCTION Developing software systems has become the fastest, most perfect and affordable way of approaching problems using information technology and deriving the best of all possible solutions to meet customer's needs in this world of globalization. The Systems Development Life Cycle (SDLC) is the process of understanding how an Information System (IS) can support business needs, designing the system, building it, and delivering it to users. In many ways, building an information system is similar to building a house. First, the house (or the information system) starts with a basic idea. Second, this idea is transformed into a simple drawing that is shown to the customer and it's refined (often through several drawings, each improving on the other) until the customer agrees that the picture depicts what he or she wants.
  • 235. Third, a set of blueprints is designed that presents much more detailed information about the house (e.g., the type of water faucets, where the telephone jacks will be placed). Finally, the house is built following the blueprints—and often with some changes and decisions made by the customer as the house is erected. The SDLC has a similar set of four fundamental phases: planning, RESEARCH PAPERS 9li-manager’s , Vol. No. 3 lJournal on Information Technology 3 June – August 2014 analysis, design, and implementation. This paper follows all the four elements of the SDLC aforementioned. 1. Problem Statement There are a number of issues students faced both in/out of campus. Some of such is as follows: Students will register and sit for exams, yet results will indicate zero (0) marks.
  • 236. Students will defer courses and they will appear as trailed on results pasted. Students will sometimes would have completed a course number of years ago, but upon a request of their transcripts, they will be told that they trailed in one or more course which has sometimes resulted into a legal issue. All these issues will usually lead to a reference to the head of the department for rectification. This is therefore called for the need to have a concise and an accurate system of keeping records. Records of staffs in the various departments are poorly kept as well. 1.1 Objective To design an efficient and accurate software management system that will handle Students and l l l
  • 237. l RESEARCH PAPERS Staff records. 2. Methodology According to (Welman et al., 2004), research methodology is an organised way comprising of sequences, procedures and systems to manage and run a research process. A methodology is usually a guideline system for solving a problem with specific components such as phases, tasks, methods, techniques and tools. It can be also defined as follows: "The analysis of the principles of methods, rules, and postulates employed by a discipline" "The systematic study of methods that are, can be, or have been applied within a discipline" "The study or description of methods" (Wikipedia
  • 238. Encyclopedia, 2010) Research can either be quantitative or qualitative. The quantitative research method seeks to establish relationships and to explain causes of changes in measured social facts (White, 2003). According to (Bless et al., 1995), qualitative research uses qualifying words or descriptions to record aspects of the world. (Olivier, 2004) adds that, with qualitative research, it is the researcher who considers data, selects what is appropriate and processes it in some way. In another school of thought, methodologies are the methods or organizing principles underlying a particular art, science, or other area of study (Microsoft Student with Encarta Premium, 2009). In software development, the process of solving customers' problems by the systematic development and evolution of large, high quality software systems within cost, time and other constraints is called Software Life
  • 239. Cycle Development Model (SLCDM). (Wikipedia Encyclopedia, 2008). There are various models that can be used to achieve the production of software Model – a process which comprises identifiable stages that the software product goes through during its life time. Examples of SLCDM include waterfall, iterative and prototype life cycle models among others (Stephen R, l l l 2010). Different methodologies can be applied for different projects. This research will be based on the prototype methodology which includes the development of prototypes; however, throwaway prototypes may be employed at some point in the SDLC. The prototyping/ throwaway prototyping-based methodologies have a relatively thorough analysis phase
  • 240. that is used to gather information and to develop ideas for the system concept. Many of the features suggested by the users may not be well understood, however, and there may be challenging technical issues to be solved. Each of these issues is examined by analysing, designing, and building a design prototype. A design prototype is not a working system; it is a product that represents a part of the system that needs additional improvement, and it contains only enough detail to enable users to understand the issues under consideration. After the design of prototype is accepted, it is either built upon the prototype, or thrown away for the real software to be built; that’s the throwaway prototype. Some tools to be employed are: The software will be designed using Visual Basic.NET (Microsoft Visual Studio 2010). The database will be designed using SQL Server 2008(Enterprise Edition).
  • 241. The designing of the forms begins after the construction of the database tables. Future upgrades will be done using the Visual Basic.NET (Microsoft Visual Studio 2012) and SQL server 2012 or latter. 3. Literature Review Systems are created or made to solve problems. A system is defined as a collection of components that work together to realize some objectives. Basically there are three major components in every system, namely input, processing and output. (Goodland et al, 2004) Some systems share common characteristics including: Structure: Most system structures contain parts (or components) that are directly or indirectly related to l l l l
  • 242. l 10 li-manager’s , Vol. No. 3 lJournal on Information Technology 3 June – August 2014 RESEARCH PAPERS each other. A system has behaviour. It contains processes that transform inputs into outputs (material or energy data) A system has interconnectivity: The parts and processes are connected by structural and/or behavioural relationships. A system's structure and behaviour may be decomposed via subsystems and sub – processes to elementary part and process steps. This term ‘system’ may also refer to a set of rules that govern the structure and/or behavior. (Stephen R, 2010) 4. Registration and Submission Literally every University on the surface of the planet do
  • 243. register its student and may allow submission of registrations via an electronic system or paper based system (manual system). Apart from academic services, higher education institutions (HEI) provide various other services to its students. While education is the main goal, students also need to be supported in other areas of their student life by first-rate service provision. This includes the administrative aspect, which comprises Registration, financial support, library, information services and much more. These administrative services go hand in hand with academic services. Administrative services and academic services are mutually dependent. For example, a student cannot register, gain access to the librar y, receive any administrative support and not attend classes, because there will be no progress regarding his or her studies. Similarly, a student cannot attend classes without being registered.
  • 244. Registration is the act of recording names and details on an official list. Students' registration on the other hand is the act of recording school students as present or absent at the beginning of the school day, or the time or session at which this takes place. Submission is showing or the giving of something to someone in authority for them to consider or approve. (Longman Dictionary) l l l 4.1 The Registration Process Students register in order to be allowed access to the academic and administrative sectors of an academic institution. Registration allows them to choose the courses and subjects they intend to be taught. Once a student registers, he or she becomes eligible to attend classes. The word registration means the accurate positioning of,
  • 245. or the degree of accuracy in the positioning of, an entity relative to (a) another entity, or (b) an independent frame of reference. A process is step-by-step collection of interdependent actions that together produce outcomes that contribute to the success of an organization. (Chapman et al, 1996:5) A registration process is the process of formally assigning and recording the enrolment of a student in a class or classes. It is open only to those who have already been admitted or re-admitted to the academic institution, or who are eligible to re-register. According to (Temple, 2006), the registration process involves step-by-step interdependent actions that together produce outcomes. Registration at the University is a process that includes: Academic advising with a faculty or staff member, which is required for some majors, but optional for others.
  • 246. Registering for classes and confirming attendance. In an interview with the Faculty Officer of the Faculty of Mathematical Sciences, UDS, it was established that the process of registration starts with a student acquiring a form. The student fills in his or her personal information as required and the subjects for which he or she is registering. Personal information of returning students are already captured on the system, which means that they only need to fill in the subjects they wish to register for. They then proceed to the relevant academic department to obtain approval and signature (The head of the department must sign the form to allow them to study a number of courses per trimester). Applicants for registration who do not hold the required qualifications may, if they meet all other eligibility criteria for registering, be granted registration subject to the l l
  • 247. 11li-manager’s , Vol. No. 3 lJournal on Information Technology 3 June – August 2014 RESEARCH PAPERS condition that they achieve the required qualification within a specific period. Registration has many benefits some of which are: Registration is evidence that students/people who are in an institution or workplace meet the competence, g o o d c h a r a c t e r a n d c o n d u c t / m i n i m u m requirements set for the registration and that they are committed to meeting the code of practice and learning for that institution. The qualification requirements set for registration means that all students or workers undertaking a particular major/course or a particular role wherever they work are required to demonstrate the same level of competence and adhere to the code of conduct