SlideShare a Scribd company logo
1 of 166
ARTICLE IN PRESS
0925-5273/$ - se
doi:10.1016/j.ijp
�
Correspondi
E-mail addre
(K. van Donsel
Int. J. Production Economics 121 (2009) 620–632
www.elsevier.com/locate/ijpe
Logistics drivers for shelf stacking in grocery retail stores:
Potential for efficiency improvement
Susan van Zelst, Karel van Donselaar
�
, Tom van Woensel,
Rob Broekmeulen, Jan Fransoo
Department of Technology Management, Technische
Universiteit Eindhoven, P.O. Box 513, 5600 MB Eindhoven,
The Netherlands
Received 17 March 2006; accepted 28 June 2006
Available online 30 August 2006
Abstract
In retail stores, handling of products typically forms the largest
share of the operational costs. The handling activities are
mainly driven by the shelf stacking process. While the impact of
the handling costs on the profitability of a store is
substantial, there are no models available of the different
drivers influencing store handling. In this paper, a study of the
shelf stacking process is presented. First, a conceptual model
based on warehouse operations is derived. It is shown that
stacking costs are non-linear with the number of consumer units
stacked. Secondly, by means of a motion and time study,
data has been collected for dry groceries in four stores of two
different European retail companies. Using regression, the
developed model clearly demonstrates the impact of the most
important drivers for stacking efficiency: case pack (CP) size,
number of CPs stacked simultaneously, the filling regime and
the working place of the employees. Efficiency gains of
8–49% by changing the driver parameter value are identified.
Based on the presented insights both retail companies have
already decided to structurally change their current operations.
r 2006 Elsevier B.V. All rights reserved.
Keywords: Retail operations; Handling; Store; Shelf stacking;
Motion and time study; Model
1. Introduction
In times of severe competition, many retailers
recognize the importance of controlling costs. With
known supply chain costs, the information needed
to most effectively structure the supply chain can be
provided. Moreover, different opportunities needed
to simultaneously reduce costs and increase perfor-
mance can be identified. In Fig. 1 (see Broekmeulen
e front matter r 2006 Elsevier B.V. All rights reserved
e.2006.06.010
ng author.
ss: [email protected]
aar).
et al., 2006) the operational logistical costs made in
the part of the supply chain that includes the
retailer’s warehouse and the store are presented.
Since we focus on operational costs, total shelf
space and the assortment are assumed to be known.
Furthermore, since this cost analysis is based on
non-perishables (dry groceries), obsolescence costs
are negligible. As a result, the inventory costs in the
cost pie in Fig. 1 only consist of the inventory
holding costs. It can be seen that the majority of the
operational costs are handling costs. In another
empirical study by Saghir and Jönson (2001) the
same trend was observed: they found that 75% of
.
www.elsevier.com/locate/ijpe
dx.doi.org/10.1016/j.ijpe.2006.06.010
mailto:[email protected]
ARTICLE IN PRESS
Transportation 22%
Handling in
warehouse 28%
Inventory in store 7%
Inventory in
warehouse 5%
Handling in store 38%
Fig. 1. Operational logistical costs in the retail supply chain for
non-perishables.
S. van Zelst et al. / Int. J. Production Economics 121 (2009)
620–632 621
the handling time in the retail chain occur in the
store.
1
In their paper efficiency improvements
through the integration and development of new
packaging systems are described. In this article,
the potential to improve store-handling efficiency
is discussed by identifying the drivers for shelf
stacking (i.e. given the packages and the inventory
replenishment rules). Handling costs in the stores in
the two retail chains investigated in this paper are
equal to around 50 million euro (or 60 million
dollar) per year, indicating that efficiency gains can
lead to substantial cost savings as well.
Since handling costs are significantly higher than
the inventory costs, it is worthwhile to assess the
drivers of the handling costs. This shows the need
for a model which adequately describes the handling
process and its related costs in the store. Today, no
complete models are available to estimate handling
costs. Consequently, no realistic estimation can be
made about the effect of potential improvements in
order to reduce handling time and the related costs.
Assortment planning and shelf space allocation are
important issues in retail, which we would expect
to be based on a trade-off between shelf space,
inventory costs and handling costs. Yet, even recent
studies in this area either ignore the handling costs
or simply model them as a linear function of the
number of consumer units (CUs) sold (i.e. without
intercept). Almost all recent contributions in the
literature on retail operations are mainly focussed
on the inventory aspect (see e.g. Shah and
Avittathur, 2006; Van Donselaar et al., 2006a, b;
Hwang et al., 2005; Fleisch and Tellkamp, 2005;
1
The fact that the ratio ‘handling costs in the store vs. handling
costs in the warehouse’ presented in Fig. 1 is below the ratio
75:25
is due to the large difference in salaries: in stores,
replenishment is
often done by (young) part-timers.
Ketzenberg et al., 2002; Wee and Dada, 2005; Gaur
et al., 2005). So, although it is a major part of the
profit equation, little literature is available on
handling costs in retail stores. The scarce literature
which is available, originates from the 1960s.
Moreover, only a few papers focused on minimizing
operating costs and reducing both inventories and
handling costs (see Chain Store Age, 1963, 1965).
SLIM (Store Labor and Inventory Management)
was the most widely promoted system in the mid-
1960s for minimizing store handling expense by
reducing backroom inventories and the double
handling of goods (Chain Store Age, 1965). Today,
no models for handling activities in retail stores are
available which are tested on empirical data and
research in the area is lacking as well.
The main contributions of this paper are twofold.
First, while the body of literature that studies the
efficiency of handling in warehouse operations is
substantial, the literature on handling related to
store operations is scarce. Most of the literature
on retail stores focuses primarily on the demand
side, and less on the cost side. When there is a focus
on cost, most attention is devoted to inventory
holding costs. Little research is available on the
assessment of handling costs in retail stores. This
paper is a new entry into this almost unexplored
domain. Starting from handling models used
in warehousing literature, a conceptual model
for shelf stacking activities in the retail store is
derived.
Secondly, the conceptual model is validated using
data collected at two retail companies in the grocery
sector. Evaluating the conceptual model using
regression analysis on the empirical data not only
shows there is a relationship between the stacking
time and its drivers, but also quantifies the effect of
the different important drivers for shelf stacking
time in the stores: (1) the number of case packs
(CPs) per order line; (2) the CP size (3) the way the
shelves are stacked (i.e. filling regime); (4) the
worker doing the actual stacking. Using these
empirical results, the efficiency gains are quantified.
Moreover, based on the obtained results and
insights both retail companies have decided to
adjust their current operational processes.
The organization of the paper closely follows the
methodology presented by Mitroff et al. (1974).
First the problem is conceptualized and the main
variables to be studied are identified. Then the
model is built and analysis is conducted based on
the model. The model is then validated using the
ARTICLE IN PRESS
2
Note that the design of a order pick lane in a warehouse is
quite different from an aisle in a store (Broekmeulen, 1998),
since
the locations and the storage space allocations of the SKUs
(slots) in an warehouse are optimized for the handling
activities,
while the slot allocations in a planogram try to optimize the
sales
(Corstjens and Doyle, 1981; Urban, 1998).
S. van Zelst et al. / Int. J. Production Economics 121 (2009)
620–632622
real life data that were collected in the stores on the
actual shelf stacking process. As such this approach
fits the concept of model-based empirical research
where empirical data are analyzed based on
quantitative models, and results can thus be
interpreted within a validated modeling context
(Bertrand and Fransoo, 2001) In Section 2, the
conceptual model for the shelf stacking activities in
the store is derived from the warehouse handling
models. In Section 3, the research methodology
is described in detail. In Section 4, the analysis and
the results of the model are discussed using the
data collected at two retailers; Section 5 explains
the implications for efficiency improvement in the
stacking process of a store. Finally, Section 6
concludes and further research options are de-
scribed.
2. Conceptual model
The following replenishment process is observed
for the items on the shelves in the different stores:
after unloading the truck, the store clerks move the
deliveries to the shelves, unpack the CPs and put the
CUs on the shelves. To promote First In First Out
retrieval from the shelves by customers and to
improve the display, the CUs on the shelves are
sometimes rearranged, putting the oldest inventory
in front (depending upon the specific product
category). Although this shelf stacking process in
the store is similar to the order picking process at a
warehouse, literature on store handling operations
is very scarce, while literature on handling in
warehouses is abundant. To derive a conceptual
model for shelf stacking in the stores, we first
describe the handling activities in warehouses
(Section 2.1), then the stacking activities in stores
(Section 2.2) and finally, the derivation of a formula
for the stacking time.
2.1. Handling activities in warehouses
Handling activities are explicitly modeled in
warehouse models (Rouwenhorst et al., 2000).
These models are very useful as they consider
each article or stock-keeping unit (SKU) separately
and they include handling costs explicitly as part
of the objective function. Moreover, different
decisions (e.g. routing policies, picking, etc.) and
parameters (e.g. productivity of the workers) can be
modeled explicitly in these warehouse models.
Therefore, the activities needed for stacking SKUs
into the shelves of a grocery store are compared
with order picking in a warehouse. As such, shelf
stacking is seen as the reverse of order picking,
i.e., instead of unloading a container with dif-
ferent SKUs in the store, an order picker in the
warehouse loads different SKUs in a container for
shipment.
2
In this paper, a shipment to be stacked in the
store is considered as the equivalent of a customer
order which has to be picked in the warehouse. In
this analogy, shelf stacking at a store, where the
relatively large shipments are divided over several
store clerks and these store clerks move the goods to
the storage locations on the shelves, resembles zone
picking in a warehouse. Zone picking is defined by
Frazelle and Apple (1994) as an order picking
method where a warehouse is divided into several
pick zones, order pickers are assigned to a specific
zone and only pick the items in that zone, orders are
moved from one zone to the next (usually on
conveyor systems) as they are picked (also known
as ‘‘pick-and-pass’’). To reflect this resemblance,
shelf stacking at the store is referred to as zone
stacking in this paper. Zone stacking assumes that
the incoming goods are already sorted at the
supplier according to the different aisles of the
stores. This separation along product characteristics
is called family grouping.
An order pick cycle in zone picking is the process
of loading a container that is part of a shipment to a
customer. According to Tompkins et al. (2003),
an order pick cycle consists of the fixed setup
activities that are related to the start and end
of the cycle, such as getting the instructions and
transferring the loaded container to the dock
boards, and variable activities related to the number
of order lines. An order line is defined as an
instruction to pick a requested number of units from
a specific SKU in the zone. The following activities
depend on the number of order lines: traveling
(to, from, and between the storage locations),
searching for the location, and reaching and
bending to access the location (included in activity
‘‘Other’’ in Fig. 2). The actual pick activities such
as extracting items from the location and packing
the items for shipment depend on the number of
ARTICLE IN PRESS
50%
20%
15%
10%
5%
0% 20% 40% 60%
Travel
Search
Pick
Setup
Other
A
c
ti
v
it
y
% of order picker's time
Fig. 2. Typical distribution of an order picker’s time.
S. van Zelst et al. / Int. J. Production Economics 121 (2009)
620–632 623
requested units. Fig. 2, based on Tompkins et al.
(2003), shows a typical distribution of an order
picker’s time based on a single order picking
strategy, where each order picker completes one
order at a time.
Note that in zone picking, traveling and searching
within a zone are less important than in single order
picking, since a zone is relatively compact and the
order picker is familiar with the locations in the
zone. As a result, traveling and searching in zone
stacking in a store may also be less dominant than
suggested by Fig. 2.
The time required for accessing the location can
still be relevant in a warehouse. However, in a store
accessing the location is an important activity,
because it includes maintenance of the location
such as preparing the shelves and removing old
inventory. If one wants to promote First In First
Out (FIFO) retrieval by the customers of the store,
the items have to be shifted or removed before
one can stack the new items behind them. In a
warehouse, (gravity) flow racks, which are replen-
ished from the back, can easily maintain FIFO
retrieval. Normally, a store has no space for these
kinds of racks or not all types of products are suited
for these racks. A more costly solution is assigning
more slots to a SKU, such that one slot is the active
picking location and the other slot holds the backup
inventory.
2.2. Stacking activities in stores
As mentioned before, (shelf) stacking in the
store is considered as the mirror activity of picking
in the warehouse. The process of stacking defined
in this paper starts with grabbing a full casepack
from a rolling container within the store and
ends with the disposal of the waste of the empty
casepack.
There are three different ways a shelf can be filled
with items in the store. The basic filling regime Unit
is putting the individual CUs on the shelf. The filling
regime is referred to as Tray if the complete CP can
be put directly on the shelf. In the filling regime
Loose, the items can be dumped on the shelf without
rearranging. This requires normally the availability
of a type of crate on the shelf. While the picking
time in a warehouse is related to the number of
requested units, the filling time in the store is
expected to be dependent on the number of CUs
(if filling regime is Unit) or the number of CPs (if
filling regime is Tray or Loose).
Another important activity in zone stacking is
grabbing and unpacking the items. Unpacking is
necessary when the store wants to present the
individual items or when the CP does not have the
same physical dimensions as the storage location.
This activity resembles the replenishment operation
in a warehouse. During replenishment in a ware-
house, the same type of problems are encountered
when one wants to put a full pallet in a slot that is
less than a pallet or that has still items at the
location.
The review by Rouwenhorst et al. (2000) indicates
that most of the research in warehousing is related
to automated storage systems (AS/RS systems) and
little research has been done discussing conventional
warehouses (e.g. with manual picking). Since stack-
ing in the store is done by store clerks, one needs to
take into account their work pace in the model too.
Only few researchers have reported on the differ-
ence in work pace in a warehouse environment
(see e.g., Bartholdi and Eisenstein, 1996; Bartholdi
et al., 2001).
2.3. The derivation of a formula for the shelf stacking
time in stores
Most SKUs follow the filling regime Unit, so it is
expected that the time needed for filling depends on
the number of CUs. Other activities like grab
and unpack a CP or travel to and from the shelf
location, depend on the number of CPs filled.
Finally, preparing the shelves and searching are
done only once for each SKU, independent of the
number of CPs or CUs.
The insights of the stacking process indicate that
the number of CU and the number of CP are
expected to have an influence on the total stacking
ARTICLE IN PRESS
S. van Zelst et al. / Int. J. Production Economics 121 (2009)
620–632624
time (TST). The dependent variable is the TST
expressed in seconds. The explanatory variables
are hypothesized to have the following influence on
the TST:
1.
The higher the number of CUs to be filled (CU),
the higher the TST will be. An increase in the
number of CU stacked increases the time needed
to put the individual CUs on the shelf, resulting
in a higher TST.
2.
The higher the number of CPs, the higher the
TST will be. More CPs imply more time needed
for activities like grab and unpack a case pack or
travel to and from the shelf location, thus leading
to higher TST.
The basic starting equation is then as follows:
TST ¼ aþbCUþwCP:
Rewriting this specification by dividing the TST by
the number of CUs filled (CU) and making use of the
fact that CU ¼ CP Q, where Q stands for the case
pack size, results in the following revised model:
TST
CU
¼
a
CU
þbþw
CP
CU
)
TST
CU
¼ bþa
1
CP Q
þw
1
Q
.
It is important to be aware of differences in
working pace of store clerks when interpreting the
data, i.e. not every employee works equally fast.
Consequently, n�1 dummies for store clerks are
added, denoted as DWi, (i ¼ 1, y, n�1, with n the
number of store clerks considered) and DWi ¼ 1 if
store clerk i is selected and zero otherwise. It is
expected that the stacking regimes Tray and Loose
will have a different effect than the filling regime
Unit. Consequently, two extra dummies are added
for the filling regime Tray (DT) and the filling regime
Loose (DL) which leads to the following general
model (with e the error term):
TST
CU
¼ bþa
1
CP Q
þw
1
Q
þdDT þ gDL
þ
Xn
i¼1
Zi DWi þ �.
Do note that the resulting model for the TST
per CU is non-linear in the number of CUs and in
the case pack size. This is in contrast to most
literature where it is assumed that handling activi-
ties are a constant and linear rate in the number of
CUs. Ketzenberg et al. (2000) and Cachon (2001)
describe models to optimize the replenishment
decisions in the absence of a backroom and
assuming handling costs that are linear with the
number of CUs. This may be explained by the type
of store they are considering. In general three basic
store types can be distinguished: stores which
receive crates composed of multiple SKUs, where
each SKU is less than a case pack size (like dense
retail outlets); stores which receive CPs and stack
CUs; and stores which receive and stack CPs (like
discounters). This research is based on the second
type of stores, resulting in nonlinear shelf stacking
cost, effectively focusing on a different type of store
than those studied by Ketzenberg et al. (2000) and
Cachon (2001).
3. Research methodology
3.1. Experimental design
The research in this paper focuses on the stacking
process for which data is collected. The data is
collected by means of a motion and time study,
which is defined by Barnes (1968) as: ‘‘the systema-
tic study of work systems with the purposes of (1)
developing the preferred system and method—
usually the one with the lowest cost; (2) standardiz-
ing this system and method; (3) determining the
time required by a qualified and properly trained
person working at a normal pace to do a specific
task or operation; and (4) assisting in training the
worker in the preferred method’’. The two main
parts in this definition are motion study (or methods
design) and time study (or work measurement). The
first part is for finding the preferred method of
doing work, that is, the ideal method or the one
nearest to it. The second part is for determining the
standard time to perform a specific task. Besides
determining a certain normal time required for a
task, time studies are done to detect work method
improvements. In such a way, one can analyze a
given process to eliminate or reduce ineffective
movements, and facilitate and speed up effective
movements. Through a motion study, the work is
performed more easily and the rate of output is
increased.
In the experiment, for each SKU the time needed
by a store clerk for stacking the items on the shelf is
measured for a delivery (i.e. an order line in
the store). In the zone stacking process, each order
line consists of taking a case pack from a container,
ARTICLE IN PRESS
S. van Zelst et al. / Int. J. Production Economics 121 (2009)
620–632 625
unpacking the case pack and putting the CUs on
the shelf at the assigned location. As timing an
entire operation as one element is seldom satis-
factory, the TST for an order line has been
separated into different sub-activities. The division
should be such that the elements are as short as can
be accurately timed and that constant elements can
be separated from the variable elements (Barnes,
1968). The TST is divided into the following sub-
activities:
�
grab and unpack the case pack;
�
search for the assigned location on the shelf;
�
travel to the shelf;
�
check the shelf life of the inventory on the shelf;
�
prepare the location on shelf for stacking;
�
put the new inventory on the shelf;
�
put the old inventory back on the shelf; and
�
44%
21%
11%
10%
8%
3%
2%
Stack new inventory
Grab and unpack case
pack
Dispose waste
Travel
Prepare the shelf
Search
Stack old inventory
A
c
ti
v
it
y
dispose the waste.
One more sub-activity has been distinguished,
which is not part of TST, called ‘other activities’ to
which all time was registered spent by the store
clerks for activities which were not directly related
to a specific order-line (like helping a customer).
Since Saghir and Jönson (2001) mention the lack
of standards and definitions on the handling
(sub-)activities in a store, Appendix A contains the
definitions which have been used in this research
project.
3.2. Data collection
Empirical data on the stacking process in two
grocery retail companies is collected. In four stores
(two of each retail company) employees were
followed while stacking the shelves. During the
data collection period, the stores were not allowed
to change their current operations and were asked
to let the most qualified and properly trained
qualified personnel do the shelf stacking. Moreover,
the days were carefully selected such that the period
of measurement did not include any periods of
expected demand peaks/drops (e.g., no holidays).
The data were gathered for product groups, which
meet the following criteria (criteria 1–4 are chosen
to enable the investigation of the potential impact of
the drivers which are included in the TST-equation
in Section 2.3):
0% 20% 40% 60%
% of stacking process' time
1.
Fig. 3. Distribution of the time of the stacking process.
The product groups should contain both fast-
and slow movers;
2.
The product groups preferably should contain
SKUs from all three filling regimes (Tray, Loose,
and Unit);
3.
The product groups should contain different case
pack sizes;
4.
The product groups should contain SKUs for
which sufficient shelf space is available to
accommodate more than one case pack in a
delivery (see also Broekmeulen et al., 2006).
5.
All selected product groups should contain
items that are comparable in terms of the
shelf stacking process and productivity. For
this reason, we did not consider product groups
such as soft drinks, beers as well as dairy
products.
The store clerks are followed during the shelf
stacking with a camcorder. Advantages of using a
camcorder are that any short cyclical activities can
be measured, the stacking process can easily be
reviewed and different aggregation levels can be
looked at. After the recording process, the TST
per order line was registered using a computerized
time registration tool, resulting in an extensive
database.
4. Analysis and results
Fig. 3 shows the empirical distribution of the TST
in the stores. In the zone stacking process at
the stores, putting the items on the shelves (‘Stack
new inventory’) is the most important activity
(for descriptive statistics on the different variables,
refer to Appendix B).
When comparing Figs. 2 and 3, a difference
between the travel time for order picking in a
warehouse and the travel time for zone stacking in a
store is observed. The first reason is that the typical
ARTICLE IN PRESS
S. van Zelst et al. / Int. J. Production Economics 121 (2009)
620–632626
distribution of an order picker’s time as given in
Fig. 2 is not based on the zone picking strategy but
on the single order picking strategy in a warehouse.
In the zone picking strategy, travel time is reduced
at the expense of increased sorting, which is not
included in Fig. 2. The second reason is that the
data collection was restricted to the movements
within the aisle, which can directly be attributed to
the stacking process of an order line. The time
needed to bring the container to the right aisle is not
part of the travel time in our TST model and has
therefore not been measured, i.e., only the time
needed for traveling between the container and the
shelf is registered.
The general model is analyzed using regression
analysis. The effect of the work pace of a store clerk
is compared with the median store clerk in the data
set, which was store clerk 8. Consequently, 8
dummies DWi for the remaining store clerks are
added. The results of the Ordinary Least Squares
estimation are shown in Table 1. All relevant
collinearity tests (e.g. correlation coefficients, var-
iance inflation factors) performed indicated no
problems with regards to multicollinearity for the
estimated model. The F-statistic indicates that the
model is valid.
Almost 40% of the TST per CU for each order
line is explained with this model. Table 1 confirms
the a priori expectations: the signs of all coefficients
are as expected. Looking at the standardized
Table 1
Estimation results TST/CU model
Explanatory
variable
Coefficient t-statistic Standardized
coefficient
Constant 1.758 15.613**
1/(CP Q) 11.126 8.724** .275
1/Q 10.464 8.767** .273
DT �0.454 �4.074** �.080
DL �1.805 �5.262** �.097
DW1 �.562 �4.372** �.094
DW2 �.292 �0.996 �.018
DW3 2.800 11.145** .211
DW4 �.321 �2.129* �.046
DW5 .143 .971 .020
DW6 .328 3.199** .077
DW7 1.252 7.803** .160
DW9 �.091 �.308 �.006
R2a .379
N 1922
*Significant at 5% and; **significant at 1%.
coefficients one can see that most of the explanatory
power comes from the variables 1/(CP Q) and 1/Q.
The filling regimes Tray and Loose are faster than
the filling regime Unit. The filling regime Tray
reduces the TST per CU with 0.454 s per CU
(1.805 s per CU for the filling regime Loose). The
TST per CU is equal to 1.758 s per CU (see constant
term in the table). Looking at the different store
clerks, Store clerk 1 appears to be the fastest as he
stacks on average 0.562 s faster per CU. Although
some store clerk dummies are not significant the
group of the dummies related to the store clerks is
significant as a whole (as confirmed by an F-test; see
Gujarati, 1995).
An alternative model specification where product
specific characteristics were included to test the
effect of product heterogeneity on the TST per CU
did not improve the specification. Product hetero-
geneity was tested by adding physical volume of an
SKU (and its interactions with the other variables).
Estimation results indicated that physical volume
and the interaction variables were highly insignif-
icant indicating that product heterogeneity did not
have a proven influence based on this data set.
Moreover, alternative specifications (e.g. multipli-
cative models and logarithmic functions of the
variables) have been tested extensively, but they did
not improve the results. Analysis of the other
activity revealed that worker 3 was significantly
more disturbed by customers than the other
workers explaining part of the reduced efficiency
of worker 3 (i.e. due to the startup effect after an
interruption).
The specification is used to quantify the effect
of (1) increasing the case pack size; (2) increasing the
number of case packs ordered; (3) changing the
filling regime. For example, focusing on the median
store clerk 8 (i.e. all dummy variables for the store
clerks are thus zero) and looking only at the filling
0
5
10
15
20
25
0 2 4 6 8 10 12 14 16 18 20 22 24
Q
T
S
T
/C
U
. Unit CP=1
Unit CP=2
Fig. 4. Influence of case pack size and number of case packs on
total stacking time per CU [s/CU].
ARTICLE IN PRESS
S. van Zelst et al. / Int. J. Production Economics 121 (2009)
620–632 627
regime Unit (i.e. DT ¼ 0 and DL ¼ 0), the effect of
an increase in the number of CPs ordered and the
CP size can be evaluated (Fig. 4). It can be seen that
the TST in seconds per CU decreases if the CP size
increases. CP sizes typically occur around the
following three values: 6, 12, and 24 CUs. This
analysis advocates using the largest possible CP size
for a SKU if sufficient shelf space is available.
Alternatively, it helps to recognize the impact on
handling efficiency if for any other reason (e.g.
reduced risk of obsolescence or perishability), it is
decided to decrease the CP size.
Table 2 shows the effect of increasing the CP size
from 6CU to 12CU and from 12CU to 24CU for the
three different filling regimes and for each of the
store clerks (Wi denotes DWi ¼ 1 for store clerk i
and DWi ¼ 0 for all others). On average, when
stacking in units the time gain is 28%, stacking in
trays results in an efficiency gain of 31% and
Table 2
Potential gains on total stacking time per CU [s/CU] when
increasing the case pack size
Unit (%) Tray (%) Loose (%)
6–12CU 12–24CU 6–12CU 12–24CU 6–12CU 12–24CU
W1 37.53 30.03 41.45 35.40 60.19 75.58
W2 35.53 27.55 39.02 32.00 55.20 61.61
W3 22.06 14.15 23.36 15.24 28.33 19.76
W4 35.73 27.80 39.27 32.33 55.70 62.86
W5 32.72 24.31 35.66 27.71 48.70 47.47
W6 31.65 23.15 34.40 26.22 46.38 43.25
W7 27.23 18.71 29.23 20.66 37.46 29.94
W8 33.59 25.29 36.70 28.99 50.66 51.34
W9 34.17 25.95 37.39 29.86 51.99 54.15
Average 32.24 24.11 35.17 27.60 48.29 49.55
Table 3
Potential gains on total stacking time per CU [s/CU] when
stacking tw
Unit (%) Tray (%)
Q ¼ 6 Q ¼ 12 Q ¼ 24 Q ¼ 6
W1 19.34 15.48 11.06 21.36
W2 18.31 14.20 9.80 20.11
W3 11.37 7.29 4.25 12.04
W4 18.41 14.33 9.92 20.24
W5 16.86 12.53 8.28 18.38
W6 16.31 11.93 7.76 17.73
W7 14.03 9.64 5.93 15.07
W8 17.31 13.03 8.72 18.91
W9 17.61 13.37 9.03 19.27
Average 16.62 12.42 8.31 18.12
stacking in Loose gives a 49% time reduction when
the CP size is increased.
A second observation involves the number of CPs
ordered: the more CPs per order line, the higher the
time gains, suggesting that more CPs per order line
is more efficient. Note that increased casepack sizes
or higher number of casepacks per orderline will
result in higher inventories resulting in a need
for sufficient shelf space. Therefore a trade-off has
to be made between the shelf stacking costs and
inventory holding costs. In Broekmeulen et al.
(2006) it is shown that for a large part of the
assortment excess shelf space is available to enable
higher inventories in the store without the need to
allocate more facings to the items. Moreover, Fig. 1
showed that inventory holding costs are small
compared to handling costs for non-perishables in
retail stores.
Table 3 shows for each worker the gains that can
be achieved when stacking two CPs rather than one
CP for the same SKU. As can be seen from the
table, significant gains can be realized when
products are not ordered with only one CP at the
time, but with 2 CPs per order line. Depending upon
the fill regime the average gains are 12% (Unit),
14% (Tray) and 26% (Loose). The reason these
gains are smaller than the gains from increased
casepack sizes is visible in the equation for the total
stacking time per CU at the end of paragraph 2: the
casepack size Q influences two terms of this
equation and CP only influences one of these terms.
In other words: if the casepack size Q is changed,
not only the number of orderlines change, but also
the number of casepacks per year.
The last observation made is that the filling
regime has a clear influence on the gains that can be
o case packs instead of one case pack
Loose (%)
Q ¼ 12 Q ¼ 24 Q ¼ 6 Q ¼ 12 Q ¼ 24
18.24 14.12 31.02 38.95 79.77
16.49 12.13 28.45 31.75 41.35
7.85 4.63 14.60 10.18 6.35
16.66 12.31 28.70 32.39 43.60
14.28 9.88 25.10 24.46 23.28
13.51 9.16 23.90 22.29 19.63
10.64 6.71 19.30 15.43 11.01
14.94 10.52 26.11 26.46 27.19
15.39 10.97 26.79 27.91 30.44
14.22 10.05 24.88 25.54 31.40
ARTICLE IN PRESS
Table 4
Potential gains on total stacking time per CU [s/CU] when
changing the filling regime from units to tray and tray to loose
U-T (%) T-L (%)
Q ¼ 6 Q ¼ 12 Q ¼ 24 Q ¼ 6 Q ¼ 12 Q ¼ 24
W1 9.47 15.16 21.66 31.13 53.16 82.30
W2 8.96 13.90 19.19 29.30 48.06 70.67
W3 5.57 7.14 8.32 17.54 22.89 27.00
W4 9.02 14.03 19.43 29.49 48.56 71.76
W5 8.26 12.27 16.21 26.78 41.62 57.57
W6 7.99 11.69 15.21 25.83 39.37 53.37
W7 6.87 9.44 11.61 21.95 31.02 39.10
W8 8.48 12.76 17.08 27.56 43.54 61.31
W9 8.62 13.10 17.69 28.08 44.85 63.95
Average 8.14 12.17 16.27 26.41 41.45 58.56
Table 5
Overview of the efficiency gains achieved
Increase case
pack size
(%)
Increase
number of
case packs
(%)
Filling
regime
Unit 28 12
Tray 31 14 12% (U-T)
Loose 49 26 42% (T-L)
S. van Zelst et al. / Int. J. Production Economics 121 (2009)
620–632628
achieved: The filling regimes Tray and Loose are
more favorable. Moreover, store clerks that are
faster than the median worker have larger gains
when using the filling regime Loose. These results
can partially be derived from the above tables; next
to this, Table 4 shows the efficiency gains for
different CP sizes if the filling regime changes
from Unit to Tray (U-T) and from Tray to Loose
(T-L). On average, the filling regime Tray is 12%
faster than Unit and the filling regime Loose is on
average 42% faster.
5. Discussion and managerial implications
Using the specification and the results for the
empirical data obtained, important managerial in-
sights can be obtained with regards to the effect of
(1) increasing the CP size; (2) increasing the number
of CPs per order line; (3) changing the filling regime.
Table 5 summarizes the main findings from the
previous section.
Based on this table, the first step, which
contributes the most to an efficiency gain, is to set
the filling regime to Tray or Loose for as many
SKUs as possible. This strategy needs an additional
amount of shelf space needed compared to Unit or
Tray which might not be available in stores where
usually shelf space in the breadth is scarce and
expensive. Next to this logistical constraint, the
marketing department might perceive the filling
regimes Tray and/or Loose not suitable for the store
format. Tang et al. (2001) analyze the different price
formats a retail chain can follow: they consider the
whole continuum from Every Day Low Price
(discount stores, e.g. Wal-Mart) to HI-LO or
Promotional Pricing (e.g. Ahold formats such as
Giant). Changing the filling regime to Tray or Loose
might imply that the customers perceive the retail
format as a discount store rather than a high-end
service oriented store. As such, marketing consid-
erations need to be taken into account too when the
presentation of the assortment in the store is
changed (Campo et al., 2000).
A second way of gaining efficiency in shelf
stacking, is to increase all CP sizes to the largest
possible size (e.g. from 6 CUs to 12 CUs or from 12
CUs to 24 CUs). In practice, some retailers have
already recognized the possible gains especially with
regards to their private label products. However, for
the branded products the manufacturer decides
upon the CP size. Studies show that also brand
manufacturers (e.g. Procter and Gamble, Nestlé,
etc.) are investigating the consequences of different
CP sizes and different packages in the retail supply
chain (Saghir and Jönson, 2001). Note that there is
a trend observed to reduce the CP sizes (see e.g.
Ketzenberg et al., 2000). The above results still
apply and then can be used to see how much shelf
stacking efficiency is lost in the store due to the
reduced CP size.
The third and last option involves the store
ordering policy: increase the number of CPs per
order line as much as possible. Van Donselaar
(1990) and Whybark and Yang (1996) showed that
in a 2-echelon distribution system locating most of
the inventory close to the customer is the best choice
for companies that must fill customer demand from
inventory. Putting more inventory on the shelves
however implies that there should be enough space
to accommodate for this extra inventory. However,
shelf space is limited in the breadth, but Broekmeu-
len et al. (2006) showed that there is a significant
amount of unused space available in the back of the
shelf (behind the products), which is called Excess
ARTICLE IN PRESS
S. van Zelst et al. / Int. J. Production Economics 121 (2009)
620–632 629
Shelf Space. Excess Shelf Space is defined as the
retail space that is not required to carry out the
current operations with respect to customer service
and costs. The available space on the shelf is shown
to be strongly influenced by the physical dimensions
of the product, the CP size, and the shelf dimen-
sions. This observation advocates stacking multiple
CPs of one product at the same time instead of
stacking one CP at multiple times for these products
where enough Excess Shelf Space is available. This
can be achieved by consolidating replenishment
orders (see Van Donselaar et al., 2006a, b).
Finally, it has to be noted that the effect of the
worker should not be neglected: fillers who work
faster have higher efficiency gains than slower
workers. For example, focus on the slowest worker
(number 3), he is on average already 2.8 s per CU
slower than the median worker who typically spends
only 3–5 s on shelf stacking per CU. This result
suggests that worker training is an important aspect
in order to get the full benefit from the different
actions that can be taken. Next to this, it was also
observed that due to interruptions of customers in
the store, the worker can also slow down in his
stacking time. It might thus be worthwhile to
evaluate whether it is worthwhile stacking after
opening hours.
According to Saghir and Jönson (2001), every
second reduction in the total handling time would
represent a reduction of five million euro (or 6
million dollar) in the Swedish grocery industry.
Since handling costs in the 2 retail chains studied in
this paper are around 50 million euro (or 60 million
dollar) per year, every reduction in handling time
would lead to a substantial increase in yearly profits
for these two companies. This indicates that a lot of
costs can be reduced by following the above
recommendations with regards to the efficiency in
handling.
6. Conclusions
It is argued that when store-handling costs have
an important share of the retail supply chain
operations costs, it is important to know the cost
drivers. A conceptual model for shelf stacking in
stores was derived using the analogy based on order
picking models for warehouses. It was shown that
the presented model for the stacking time was,
unlike reported in the literature so far, non-linear in
CUs. By means of a motion and time study, data
was collected in four grocery stores from two
different retail companies. Regression models re-
vealed the impact of the most important drivers for
shelf stacking efficiency, measured by the TST per
CU. The main results of the model are: (1)
increasing the CP size results in an average
efficiency gain of 24–49%; (2) stacking multiple
CPs of one product at the same time instead of
stacking one CP at multiple times, results in an
average gain between 8% and 31% in TST per CU;
(3) the filling regime has a significant effect on the
stacking time (12–42%); (4) Increased training,
experience and/or motivation may help to improve
the working pace of the employees. Based on the
presented results both retail chains have decided to
structurally change their current operations.
Future research involves extending the currently
used reorder policies in the retail companies to
take into account the handling efficiency with the
replenishment. Usually, the underlying logic is
based on a (R, s, nQ)-reorder policy with a dynamic
reorder level s. The reorder level s is based on a
demand forecast for the coming L+R days (L+R
being the sum of the lead time and the review
period). The above analysis shows the need for an
adapted inventory replenishment rule taking into
account the handling aspects. This implies that for
the majority of the items the new replenishment
logic should be: whenever a replenishment can no
longer be postponed, order as many CPs as can be
added to the existing inventory on the shelves.
Future research is also needed to analyze the impact
on handling of different types of packaging materi-
al, different shelf maintenance strategies (such as
‘mirroring’) as well as different levels of inventory
just before stacking the shelves. Moreover, it is
expected that larger CPs also reduce the cost of
packaging material and the costs of waste. Increased
number of CPs per order line reduces the ordering
and delivery frequency of a product, which also may
lead to lower ordering costs in the store and to
lower picking costs in the retailers’ warehouse.
Appendix A
The definitions which have been used in this
research project are given in Table A1.
Appendix B
For descriptive statistics on the different variables
see Table B1.
ARTICLE IN PRESS
Table A1
Sub-activity Starting/ending point of sub-activity
Grab/open case pack (G) Start The filler stands in front of the
rolling container and reaches for a case pack
End The filler prepares to walk away from the rolling container
(case pack is or is not
opened)
or Start The filler has arrived at the shelf location and starts
opening the case pack
End The filler is ready with opening the case pack and an other
sub-activity starts
Search (S) Start The filler starts with checking the product and
he/she lookes for the right shelf location
End The filler sees the right shelf location and prepares to
approach it (walk)
Walk (W) Start The filler prepares to walk away from the
rolling container or walks after searching the
right shelf location
End The filler stands still in front of the shelves
and Start The filler prepares to walk away from the shelf
location or waste disposal place, to the
rolling container
End The filler stands in front of the rolling container and
reaches for a case pack
Prepare the shelves/check
‘best before’ date (P)
Start The filler reaches for the old inventory on the shelves and
start to check the ‘best before’
date (if needed)
End The filler is ready with preparing the shelves. This means
that old inventory is
straightened or is removed from the shelves
Fill new inventory (Fn) Start The filler reaches for the new
inventory in the case pack
End The filler reaches for the old inventory or grabs the empty
box or plastic
Fill old inventory (Fo) Start In case old inventory was removed
from the shelves, the filler starts with putting old
inventory back on the shelves
End The filler is ready with putting old inventory back on the
shelves en grabs the empty
box or plastic
Waste disposal (D) Start The filler holds an empty box (or
plastic) and starts to flatten it (sometimes the box is
preserved for customers)
End The moment the filler prepares to leave the waste disposal
place (a trolley or a place
near the rolling container)
Extra (E) Any activity not part of the first sub -activities, e.g.
help a customer, customer is in the way, get or put
away crate, process inventory remainder, organize labels,
general cleaning, discuss with a colleague, take
away waste, bring empty boxes for customers to check out area,
get a new rolling container, take away
misplaced products, repair a broken product, remove cord from
rolling container, take a product to the
kiosk, straighten separation plate
Nota bene: *Grabbing and opening the case pack are taken
together, because the individual activities were difficult to
separate; **Walking
does not include walking with the rolling container from the
storage area to the right aisle or walking with the rolling
container between
the aisles. But it does include (in exceptional cases) walking
with the rolling container when the rolling container is moved
to bring certain
case packs to the right shelf location (e.g. heavy products);
***It is possible that a filler performs multiple sub-activities at
once, e.g.
walking while opening the case pack, searching or disposing
waste. When this took place, the following reasoning was used:
if the walking
time was significantly influenced by the attention focused on
opening the case pack (or searching or waste disposal), the time
for e.g.
opening the case pack was measured as sub-activity ‘‘G’’, and
the remaining time as sub-activity ‘‘W’’. If the walking time
was not
significantly influenced by one of these sub-activities, then the
total time was measured as walking time (W).
S. van Zelst et al. / Int. J. Production Economics 121 (2009)
620–632630
ARTICLE IN PRESS
T
a
b
le
B
1
C
a
te
g
o
ry
N
u
m
b
er
o
f
S
K
U
s
N
u
m
b
e
r
o
f
o
rd
e
r
li
n
es
C
a
se
p
a
c
k
si
z
e
(C
U
)
]
C
a
se
p
a
ck
s
p
er
o
rd
e
r
li
n
e
F
il
li
n
g
re
g
im
e
(]
S
K
U
)
T
S
T
(s
/C
U
)
A
v
g
.
M
in
M
a
x
A
v
g
.
M
in
M
a
x
U
T
L
A
v
g
.
M
in
M
a
x
C
o
ff
e
e
1
1
8
2
1
0
1
2
.3
1
1
3
0
1
.5
3
1
9
9
1
2
1
6
4
.6
1
0
.2
5
2
5
.1
7
C
h
o
c
o
la
te
1
3
7
2
3
5
1
6
.8
9
6
3
3
1
.3
8
1
8
1
1
8
1
9
0
3
.0
4
0
.6
2
1
5
.4
2
C
a
n
d
y
2
2
6
3
6
7
1
5
.8
6
6
3
6
1
.1
6
1
3
2
1
9
7
0
3
.0
6
0
.6
5
9
.8
7
B
a
b
y
fo
o
d
8
3
1
0
5
1
0
.6
9
3
1
6
1
.2
0
1
5
2
6
5
7
0
4
.9
4
1
.2
0
1
6
.2
5
C
a
n
n
e
d
m
e
a
t
4
0
4
7
1
2
.9
7
6
2
4
1
.7
7
1
5
4
0
0
0
3
.6
8
0
.6
0
7
.3
3
C
a
n
n
e
d
v
e
g
e
ta
b
le
s
8
9
1
2
2
1
1
.8
6
8
2
4
1
.8
0
1
6
4
6
4
3
0
3
.0
9
1
.1
7
7
.9
2
W
in
e
9
3
1
4
0
6
.8
4
6
1
5
1
.2
9
1
5
8
4
9
0
4
.7
7
1
.0
0
1
5
.6
7
C
o
ff
e
e
m
il
k
3
8
6
3
1
6
.7
3
6
3
0
1
.5
4
1
5
3
1
7
0
3
.6
4
1
.4
3
7
.0
0
S
u
g
a
r
1
5
2
3
1
0
.1
7
5
2
0
1
.8
3
1
4
1
1
4
0
1
.5
0
2
.1
0
8
.1
0
C
o
o
k
ie
s
1
3
0
1
8
5
1
5
.4
6
8
3
6
1
.2
6
1
8
1
2
5
2
3
3
.5
7
0
.6
9
9
.1
7
P
e
rs
o
n
a
l
c
a
re
2
1
4
3
1
2
7
.6
9
3
2
4
1
.1
5
1
3
1
9
3
1
6
5
4
.6
4
0
.8
3
1
1
.5
0
C
a
n
n
e
d
fr
u
it
2
0
3
2
1
2
.3
7
6
2
4
1
.7
1
1
4
2
0
0
0
3
.5
1
1
.8
3
8
.5
0
S
a
n
d
w
ic
h
sp
re
a
d
6
2
8
1
1
2
.6
0
6
3
0
1
.6
4
1
6
3
9
2
3
0
3
.2
4
0
.7
2
9
.8
3
T
o
ta
l:
1
2
6
5
1
9
2
2
1
0
4
3
2
0
8
1
4
S. van Zelst et al. / Int. J. Production Economics 121 (2009)
620–632 631
References
Barnes, R.M., 1968. Motion and Time Study Design and
Measurement of Work. Wiley, New York.
Bartholdi, J., Eisenstein, D., 1996. Bucket brigades: A self-
organizing order-picking system for a warehouse, working
paper.
Bartholdi, J., Eisenstein, D., Foley, R., 2001. Performance of
bucket brigades when work is stochastic. Operations
Research 49, 710–719.
Bertrand, J.W.M., Fransoo, J.C., 2001. Operations management
research methodologies using quantitative modeling. Inter-
national Journal of Operations and Production Manage-
ment 22, 241–264.
Broekmeulen, R.A.C.M., 1998. Layout and operations manage-
ment of distribution centers for perishables, Ph.D. Thesis,
Eindhoven University of Technology.
Broekmeulen, R., van Donselaar, K., Fransoo, J., van Woensel,
T., 2006. The opportunity of excess shelf space in grocery
retail store, under review.
Cachon, G., 2001. Managing a retailer’s shelf space, inventory,
and transportation. Manufacturing & Service Operations
Management 3, 211–229.
Campo, K., Gijsbrechts, E., Goossens, T., Verhetsel, A., 2000.
The impact of location factors on the attractiveness and
optimal space shares of product categories. International
Journal of Research in Marketing 17, 255–279.
Chain Store Age, 1963. Cifrino’s Space Yield Formula:
A Breakthrough for Measuring Product Profit 39.
Chain Store Age, 1965. Shelf allocation breakthrough 41, 77–
88.
Corstjens, M., Doyle, P., 1981. A model for optimizing
retail space allocations. Management Science 27 (7),
822–833.
van Donselaar, K., 1990. Integral stock norms in divergent
systems with lot-sizes. European Journal of Operational
Research 45 (1), 70–85.
van Donselaar, K., van Woensel, T., Broekmeulen, R., Fransoo,
J., 2006a. Inventory control of perishables in supermarkets.
International Journal of Production Economics, in press.
van Donselaar, K., Gaur, V., van Woensel, T., Broekmeulen,
R., Fransoo, J., 2006b. An empirical study of ordering
behavior of retail stores, under review.
Fleisch, E., Tellkamp, C., 2005. Inventory inaccuracy and
supply chain performance: a simulation study of a retail
supply chain. International Journal of Production Econom-
ics 95 (3), 373–385.
Frazelle, E.H., Apple Jr., J.M., 1994. Warehouse Operations.
The Distribution Management Handbook, McGraw-Hill
Inc., New York.
Gaur, V., Fisher, M.L., Raman, A., 2005. An econometric
analysis of inventory turnover performance in retail services.
Management Science 51 (2), 181–194.
Gujarati, D., 1995. Basic Econometrics. McGraw-Hill Health
Professions Division, 849pp.
Hwang, H., Choi, B., Lee, M., 2005. A model for shelf space
allocation and inventory control considering location and
inventory level effects on demand. International Journal of
Production Economics 97 (2), 185–195.
Ketzenberg, M., Metters, R., Vargas, V., 2000. Inventory policy
for dense retail outlets. Journal of Operations Management
18, 303–316.
ARTICLE IN PRESS
S. van Zelst et al. / Int. J. Production Economics 121 (2009)
620–632632
Ketzenberg, M., Metters, R., Vargas, V., 2002. Quantifying
the benefits of breaking bulk in retail operations.
International Journal of Production Economics 80 (3),
249–263.
Mitroff, I.I., Betz, F., Pondy, L.R., Sagasti, F., 1974. On
managing science in the systems age: two schemas for the
study of science as a whole systems phenomenon. Interfaces 4
(3), 46–58.
Rouwenhorst, B., Reuter, B., Stockrahm, V., van Houtum, G.J.,
Mantel, R.J., Zijm, W.H.M., 2000. Warehouse design and
control: framework and literature review. European Journal
of Operational Research 122, 515–533.
Saghir, M., Jönson, G., 2001. Packaging handling evaluation
methods in the grocery retail industry. Packaging Technology
and Science 14 (1), 21–29.
Shah, J., Avittathur, B., 2006. The retailer multi-item in
ventory problem with demand cannibalization and sub-
stitution. International Journal of Production Economics, in
press.
Tang, C.S., Bell, D.R., Ho, T.-H., 2001. Store choice and
shopping behavior, how price format works. California
Management Review 43 (2), 56–74.
Tompkins, J.A., White, J.A., Bozer, Y.A., Frazelle, E.H.,
Tanchoco, J.M.A., Trevino, J., 2003. Facilities Planning,
second ed. Wiley, New York.
Urban, T.L., 1998. An inventory-theoretic approach to product
assortment and shelf-space allocation. Journal of Retailing
74, 15–35.
Wee, K.E., Dada, M., 2005. Optimal policies for transshipping
inventory in a retail network. Management Science 51 (10),
1519–1533.
Whybark, D.C., Yang, S., 1996. Positioning inventory in
distribution systems. International Journal of Production
Economics 45, 271–278.
Logistics drivers for shelf stacking in grocery retail stores:
Potential for efficiency improvementIntroductionConceptual
modelHandling activities in warehousesStacking activities in
storesThe derivation of a formula for the shelf stacking time in
storesResearch methodologyExperimental designData
collectionAnalysis and resultsDiscussion and managerial
implicationsConclusionsReferences
International Journal of Physical Distribution & Logistics
Management
Logistics Performance: Definition and Measurement
Garland Chow Trevor D. Heaver Lennart E. Henriksson
Article information:
To cite this document:
Garland Chow Trevor D. Heaver Lennart E. Henriksson,
(1994),"Logistics Performance", International Journal of
Physical
Distribution & Logistics Management, Vol. 24 Iss 1 pp. 17 - 28
Permanent link to this document:
http://dx.doi.org/10.1108/09600039410055981
Downloaded on: 23 November 2016, At: 21:42 (PT)
References: this document contains references to 50 other
documents.
To copy this document: [email protected]
The fulltext of this document has been downloaded 13871 times
since 2006*
Users who downloaded this article also downloaded:
(2009),"Logistics performance measurement in the supply
chain: a benchmark", Benchmarking: An International Journal,
Vol. 16 Iss 6 pp. 785-798
http://dx.doi.org/10.1108/14635770911000114
(2001),"The relationship of logistics to supply chain
management: developing a common industry definition",
Industrial
Management & Data Systems, Vol. 101 Iss 8 pp. 426-432
http://dx.doi.org/10.1108/02635570110406730
Access to this document was granted through an Emerald
subscription provided by emerald-srm:585788 []
For Authors
If you would like to write for this, or any other Emerald
publication, then please use our Emerald for Authors service
information about how to choose which publication to write for
and submission guidelines are available for all. Please
visit www.emeraldinsight.com/authors for more information.
About Emerald www.emeraldinsight.com
Emerald is a global publisher linking research and practice to
the benefit of society. The company manages a portfolio of
more than 290 journals and over 2,350 books and book series
volumes, as well as providing an extensive range of online
products and additional customer resources and services.
Emerald is both COUNTER 4 and TRANSFER compliant. The
organization is a partner of the Committee on Publication
Ethics (COPE) and also works with Portico and the LOCKSS
initiative for digital archive preservation.
*Related content and download information correct at time of
download.D
ow
nl
oa
de
d
by
E
ff
at
U
ni
ve
rs
ity
A
t 2
1:
42
2
3
N
ov
em
be
r
20
16
(
PT
)
http://dx.doi.org/10.1108/09600039410055981
Introduction
Logistics research may be defined as the systematic and
objective search for, and analysis of, information relevant
to the identification and solution of any problem in the
field of logistics[1]. A great deal of logistics research is
conducted around the premiss that a relationship exists
between a particular course of action and logistics
performance (or effectiveness). Unfortunately, drawing
broad inferences from the work that has been done is
frustrating because of the great variety of ways in which
performance has been defined in the literature. The
definition of performance is a challenge for researchers in
any field of management because organizations have
multiple and frequently conflicting goals[2]. Some define
goals in terms of profits. Others may choose goals such as
customer service or sales maximization. Also difficult are
the tasks of selecting and developing adequate measures
for the chosen definition. “Hard” measures (such as net
income or accounting figures) and “soft” measures (such
as customer satisfaction ratings) each have strengths and
weaknesses associated with them.
The purpose of this article is to examine the definition
and measurement of performance in logistics research.
We begin with a literature review which includes an
examination of the various ways in which “performance”
has been defined. Data collection methods, sources, and
the measures that have been used are also identified.
Next, potential sources of performance data are identified
and discussed. Recommendations arising from the review
complete the article.
Literature Review
The contents of five leading logistics journals between
1982 and 1992 (International Journal of Logistics
Management, International Journal of Physical
Distribution & Logistics Management and its
predecessors, Journal of Business Logistics, Logistics and
Transportation Review and Transportation Journal) were
reviewed for studies addressing performance. A number
of studies from other sources were selected for
examination on an ad hoc basis.
Summary of the Literature
The literature may be divided into six categories. They
are:
(1) Conceptual works;
(2) Performance definition;
(3) Performance measurement;
(4) “Leading edge” literature;
(5) Performance as an outcome variable;
(6) Mathematical/economic analyses.
The first category is composed of three articles and three
volumes. These conceptual works are listed and
summarized briefly in Table I. Armitage studied how
management accounting techniques could be used to
improve productivity analysis in distribution
operations[3], while Mentzer and Konrad reviewed
performance measurement practices from an efficiency
and effectiveness perspective[4]. Rhea and Shrock
presented a framework for the development of measures
of the effectiveness of distribution customer service
programmes[5].
While some empirical work is reported in Byrne and
Markham’s volume, a key contribution lies in its
conceptual treatment of measurement issues, particularly
performance indicators[6]. The volume by La Londe et al.
focuses on customer service[7]. This excellent work
includes an ambitious survey of shippers, carriers and
warehouse executives, and provides several ideas
relevant to measuring customer service performance. A
17LOGISTICS PERFORMANCE: DEFINITION AND
MEASUREMENT
Data collection methods, sources and the
measures used are identified.
Logistics
Performance:
Definition and
Measurement
International Journal of Physical Distribution & Logistics
Management,
Vol. 24 No. 1, 1994, pp. 17-28 © MCB University Press, 0960-
0035
Garland Chow, Trevor D. Heaver and
Lennart E. Henriksson
The authors gratefully acknowledge the financial support
provided by the Social Sciences and Humanities Research
Council of Canada (SSHRC). An earlier version of this article
was presented at the 1993 International Logistics Congress in
Toronto, Canada.
D
ow
nl
oa
de
d
by
E
ff
at
U
ni
ve
rs
ity
A
t 2
1:
42
2
3
N
ov
em
be
r
20
16
(
PT
)
particular contribution of the book lies in its emphasis
upon the inter-temporal and multi-dimensional nature of
customer service. The volume by the Nevem Working
Group is a comprehensive description and application of
“hard” performance indicators in the logistics setting[8].
A variety of empirical studies comprise the remaining
categories. Tables II – VI list the studies by category, and
identify the data source and collection method used, how
performance is defined, and whether the measures used
for performance are soft or hard.
18 IJPD & LM 24,1
Article/book Summary
Armitage[3] Focuses on the use of management accounting
techniques to measure (and
improve) efficiency and effectiveness in distribution operations
Mentzer and Konrad[4] Reviews measurement practices and
suggests methods for improvement
Rhea and Shrock[5] Defines “physical distribution
effectiveness” and discusses some implications for
measurement
Byrne and Markham[6] Focus is on quality; a key value of this
book lies in its treatment of performance
indicators for various dimensions of logistics
La Londe, Cooper and Noordewier[7] Focus on customer service
and how it may be measured
Nevem Working Group[8] Comprehensive review of
performance indicators in logistics
Table I. Conceptual Articles
Data collection
Article/book method Data source Measures Definition of
performance/remarks
Read and Miller[9] Mail survey Managers Soft Quality: (total
customer satisfaction, on-time
delivery, zero defects, employee awareness of
quality importance, reduction of the cost of
quality, best-in-class practices, human resource
excellence, satisfaction of industry regulations,
employee education, other)
Harrington, Lambert Archival Firm Hard Vendor performance
(criteria developed using
and Christopher[10] brainstorming method): promised lead-
time, lead-
time variability, fill rate, discrepancies, total
purchases
Gassenheimer, Mail survey Executives Soft Logistical
performance: length of promised order
Sterling and cycle times for base-line/in-stock products,
Robicheaux[11] manufacturer’s performance in meeting
promised delivery dates, fill rate on
base-line/in-stock items, advance notice on
shipping delays, accuracy of manufacturer in
forecasting and committing to estimated shipping
dates on contract/project orders, manufacturer's
adherence to special shipping instructions,
accuracy in filling orders
Cooper, Browne Personal European-based Soft Study focused
upon performance indicators and
and Peters[12] interviews companies found significant variation
in logistics efficiency
depending upon which performance indicators
were used
Table II. Empirical Studies: How Performance May Be
Measured
D
ow
nl
oa
de
d
by
E
ff
at
U
ni
ve
rs
ity
A
t 2
1:
42
2
3
N
ov
em
be
r
20
16
(
PT
)
Four empirical studies focus primarily upon how
performance could be measured: their content is
summarized in Table II. Read and Miller conducted an
exploratory study of quality in logistics, using a sample
of firms on a consultant’s mailing list[9]. One of the most
important findings of their study is “a clear gap between
the importance given to the components of logistics
quality, and the measures being used” (p. 36). Harrington
et al. developed an interesting model for vendor
performance evaluation in a logistics context[10]. A
brainstorming method was used to identify the various
dimensions of vendor performance, and to evaluate the
priority that each deserved. The model was subsequently
tested in a health-care setting. Gassenheimer et al. on the
other hand, employed factor analysis to identify the
dimensions of “performance”[11]. Their analysis revealed
five key dimensions: “logistical”, “boundary personnel”,
“product/product support” [sic], “flexibility and
innovative” [sic] and “inventory assistance” (p. 20). A
principal contribution of the paper by Cooper et al. lies in
19LOGISTICS PERFORMANCE: DEFINITION AND
MEASUREMENT
Data collection
Article/book method Data source Measures Definition of
performance/remarks
Bowersox, Daugherty, Mail survey Firm Soft Common
attributes index (performance
Dröge, Rogers and and interview antecedents). Appendices
include attempts to
Wardlow[15] associate firm CAI measures with performance;
results revealed few associations that were
statistically significant
Daugherty, Stank and Mail survey Firm Soft Service
capabilities of firm (various logistics and
Rogers[17] support services)
Daugherty, Sabath and Mail survey Firm Soft Firm’s ability to
accommodate special requests:
Rogers[19] special service requests, programme support,
customized service, modification while in logistics
system
Dröge and Mail survey Firm Soft Firm’s ability to accommodate
product
Germain[20] introduction, product phaseout, product recall and
customization of service levels to specific markets
or customers
Germain[21] Mail survey Firm Soft Ability of firm’s logistics
system to accommodate:
supply disruption, production schedule changes,
in-stream product modification, services level
customization, incentive programmes, special
customer requests, product introduction, product
phase-out, product recall and computer
breakdown
Table IV. Empirical Performance Studies: “Leading-edge”
Literature
Data collection
Article/book method Data source Measures Definition of
performance/remarks
Clarke[13] Mail survey Executives Soft Productivity (study
sought to determine which
measures used)
Yavas, Luqmani Mail survey Managers Soft Efficiency (study
provides data on efficiency
and Quraeshi[14] measure usage, and attempts to correlate this
with a measure of purchasing sophistication
developed by the authors)
Table III. Empirical Studies :Which Performance Measures Are
Used
D
ow
nl
oa
de
d
by
E
ff
at
U
ni
ve
rs
ity
A
t 2
1:
42
2
3
N
ov
em
be
r
20
16
(
PT
)
its use of performance indicators for the purpose of
measuring logistics efficiency and effectiveness[12].
Two studies, summarized in Table III, report the results
of surveys which sought to identify the measures used by
decision-makers in assessing logistics performance.
Clarke reports how physical distribution productivity
was measured by South Carolina distribution
executives[13]. Yavas et al. focused a similar study on the
purchasing area. They collected data on the usage of
efficiency measures in Saudi Arabian firms and found
that utilization of measures was associated with
purchasing sophistication[14]. Given the different
orientations of the two studies, the findings are
understandably quite dissimilar.
In Leading-edge Logistics, Bowersox and his colleagues
distinguish between emergent, norm and leading-edge
organizations on the basis of common attributes index
(CAI) scores [15]. However, few significant relationships
were reported between CAI scores and publicly-available
financial performance measures [15, Appendix E, 16].
Four performance-relevant studies have been found
which build on the Leading-edge material. A summary of
these studies (along with the original volume) is
presented in Table IV. An important limitation of the CAI
approach is that it measures potential, that is, services
offered rather than actual logistics performance. For
example, Daugherty et al. suggest that the ability of the
logistics system to accommodate the customization of
service levels to specific markets or customers is an
important dimension of performance[17]. They measured
performance by asking respondents to identify which
“expanded services” were offered to customers (e.g.
customer billing/collection; freight bill audit and payment
and so on). The authors conclude that “firms wishing to
improve logistical performance are well advised to
concentrate on formalizing selected processes” (p. 57).
Because the dependent variable is potential rather than
actual service delivery, this conclusion is best regarded as
tentative and in need of further empirical validation. The
limitations of outcome variables which may have little or
no direct linkage with actual performance are well-
known[18, p. 543]. For, as Cooper and his colleagues
noted, “there can be a large gulf between what companies
say they do and what they actually do” [12, p. 30].
Daugherty et al. found that firms that could be
distinguished as “leading edge” by virtue of several
structural characteristics performed better than
others[19]. The authors defined performance as “ease of
accommodating special requests”, such as sales and
marketing incentive programmes. Again, it is potential,
20 IJPD & LM 24,1
Data collection
Article/book method Data source Measures Definition of
performance/remarks
Fawcett and Closs[22]; Mail survey Managers Soft
“Competitive position” of firm or profit centre:
Fawcett[23] (rated own five perceptual items rating from
nontraditional
organization’s measures of cost and customer service to more
performance) traditional measure of growth in sales and growth
in return on assets
Perry[24] Site visits, Managers Soft “Operating performance” of
specific logistics
questionnaires (rated own dimensions: vendor relations,
material
and interviews firm’s acquisition lead-time, purchasing method,
performance) material invoice, transport management/
comparison between JIT and non-JIT firms
Rhea and Mail survey Key decision Soft “Distribution
effectiveness”: adequacy,
Shrock[25, 26] makers consistency, accuracy, timeliness,
initiative,
responsiveness
Fawcett[28]; Mail survey Managers Soft A single logistics
function, carrier performance:
Fawcett and on-time performance, transit time, rates and
Vellenga[29] tariffs, accuracy, equipment co-ordination,
documentation, information, loss and damage
Marr[30] Mail survey Executives Soft “Distribution service
performance”/one-item
performance measure
Table V. Empirical Performance Studies: Performance as an
Outcome Variable or Basis for Comparison
D
ow
nl
oa
de
d
by
E
ff
at
U
ni
ve
rs
ity
A
t 2
1:
42
2
3
N
ov
em
be
r
20
16
(
PT
)
not actual performance that is being measured. Similar
outcome variables were used in Dröge and Germain’s
study of the effects of formalization[20] and Germain’s
study of the effects of customization and
standardization[21].
A summary of the studies in which performance was
either investigated as an outcome variable or used as a
basis for comparison is provided in Table V. Three
studies investigated variables associated with
performance in a fairly direct fashion. Fawcett and Closs
used a promising application of path analysis to
demonstrate linkages between “perceived globalization”,
“manufacturing”, “logistics”, and the outcome variable,
“competitive position”[22]. In another study using the
same database, Fawcett found that firms that emphasized
logistics issues at a higher level in the early stages
of the co-production decision outperformed their
counterparts[23, p. 39]. In his study of firm behaviour and
operating performance, Perry conducted a qualitative
study utilizing site visits, questionnaires and interviews
with managers. He found differences between just-in-time
(JIT) and non-JIT firms in a number of performance-
related areas: vendor relationships, material acquisition
leadtimes, purchasing methods and materials
inventories[24].
Rhea and Shrock utilized a combination of previous
research and interviews to identify six key elements of
logistics distribution effectiveness[25,26]. They found
that significant differences exist between “effective” and
“ineffective” organizations in the predicted direction. A
strength of this study lies in its use of “customer” food
broker managers to rate the performance of “seller”
producers. While the methodology for collecting the data
is quite defensible, a limitation arises from the fact that
each respondent determined both the overall assessment
of four firms as effective or ineffective, and then evaluated
each one on the various elements. The likelihood for a
consistency bias is consequently quite high[27].
Fawcett and Vellenga compared the performance of
maquiladora and domestic transport operations[28,29].
The survey respondents were managers who rated the
performance of transport firms with whom they dealt.
The analysis revealed that transport service performance
was less in the transnational operating environment.
Marr found “management sophistication” to be
somewhat helpful in predicting “distribution service
performance”, although a limitation in his findings lies in
the one-item measure used to measure “level of overall
distribution service”[30].
Four studies used mathematical or economic models with
hard performance measures, as summarized in Table VI.
The papers by Clarke and Gourdin[31] and Kleinsorge et
al.[32,33] used data envelopment analysis (DEA) to
evaluate the efficiency of logistics practices. Essentially,
DEA uses linear programming methods to measure
efficient combinations of inputs and outputs for a set of
decision-making units (DMUs) and provides relative
performance ratings for all the DMUs in the data set[34].
Writers in logistics and other fields have pointed out that
the advantages of DEA include the less restrictive
requirement for data input in comparison to many other
21LOGISTICS PERFORMANCE: DEFINITION AND
MEASUREMENT
Data collection
Article/book method Data source Measures Definition of
performance/remarks
Clarke and Archival Firm Hard DEA – efficiency/productivity
(also included
Gourdin[31] evaluation of DEA using questionnaire with soft
measure)
Kleinsorge, Schary Archival Firm Hard DEA – efficiency
and Tanner[32, 33]
Diewert and Smith[37] Archival Firm Hard Total factor
productivity
Gomes and Mentzer[38] Simulation Previous Hard Profitability:
also examined order cycle time,
research variance in order cycle time and order fill rate
Table VI. Empirical Performance Studies:
Mathematical/Economic Analyses
Qualitative variables such as
attitudes or perceptions
can be included
D
ow
nl
oa
de
d
by
E
ff
at
U
ni
ve
rs
ity
A
t 2
1:
42
2
3
N
ov
em
be
r
20
16
(
PT
)
methods of quantitative analysis. In particular,
qualitative variables such as attitudes or perceptions can
be included, thereby allowing the injection of essential
intangibles into the system analysis. DEA has the ability
to isolate variables for measurement while still including
the effects of interaction among both input and output
variables[33, p. 39; 35, p. 529). This is in marked contrast
to “conventional” performance indicator analyses which
are only incomplete measures of performance[34].
Disadvantages of DEA include the frequent difficulty of
obtaining data [36, p. 443]. It should also be noted that
thus far, most applications of DEA have been in the
public sector[36, p. 443].
The paper by Diewert and Smith is a promising attempt
at applying total factor productivity measurement in a
distribution setting[37]. Using data from a large appliance
parts distributor in Western Canada, the authors
conclude that large productivity gains were possible in
the distribution sector of the economy thanks to the
computer revolution, which allows a firm to track its
purchases and sales of inventory items and to use the
latest computer software to minimize inventory holding
costs (p. 16). Finally, Gomes and Mentzer employ a
simulation to explore the influence of JIT systems on
distribution system performance[38]. They found that
JIT systems in the physical distribution and materials
management contexts were associated with significantly
more favourable profit and service results in comparison
to non-JIT systems. System-wide JIT, on the other hand,
produced favourable service results, but unfavourable
profit results (p. 47).
Implications
With the exception of the mathematical/economic studies,
almost all of the empirical studies utilized soft measures
for the outcome variable. Nevertheless, both soft and hard
measures are associated with strengths and weaknesses
(as a later section of this article discusses in detail). This
limits a researcher’s ability to infer the existence of
relationships between logistics performance and its
antecedents.
One limitation common to several of the studies is that
the respondents appraised their own performance. This
becomes a particular concern in cases where the
performance dimension under consideration is better
assessed by another source, such as the customer. Also,
very few studies we reviewed adequately captured the
multiplicity of goals that must be included in any
meaningful evaluation of performance at either the
logistics or firm level. To be sure, keeping a study within
a feasible domain will often involve limiting the
examination to one or more dimensions of “performance”.
However, unsupported extrapolations of the findings of
such studies to unmeasured dimensions are difficult to
justify. For example, a researcher who finds a significant
relationship between the utilization of total quality
management programmes and customer satisfaction
should indicate that the findings of the study do not
necessarily generalize to dimensions of performance that
were not included in the study.
The predominance of the mail survey as a data collection
method in the logistics studies reviewed raises some
concern in light of its inherent limitations[39]. To their
credit, however, most authors disclosed these limitations
to one extent or another. A few offered especially coherent
discussions of remedial or assessment measures that had
been completed, such as those suggested by Lambert and
Harrington[40].
The examination of these studies reveals that an immense
variety of operational definitions and measures exists for
logistics performance. This is the result of the varying
interests of the researchers and the complexity of
performance that have been alluded to earlier. Another
source of the variety in performance measures is the
domain to which the measure is relevant. Several of the
studies measure performance at a logistics activity level
(e.g. transport or warehousing). Other studies measure
performance at the logistics function level and several
attempt to measure the firm’s performance.
None of these studies examines logistics performance in
the context of supply chain management. This is
significant. The supply chain comprises all companies
that participate in transforming, selling and distributing
the product from raw material to the final consumer. It
has two implications for research in logistics
performance. First, some research might be oriented
towards measurement of supply chain management, that
is, performance involving multiple organizations. Second,
research oriented to members of a channel should
recognize the relationship between channel structure and
member functions. For example, distributors in the
health-care supply chain are increasingly holding
inventory and performing sorting functions traditionally
performed by hospitals. This integration has resulted in
lower inventory and handling costs in the whole supply
chain, although specific members of the chain may
exhibit higher inventory and sorting costs than might
otherwise be expected.
22 IJPD & LM 24,1
Distributors in the health-care
supply chain are increasingly
holding inventoryDow
nl
oa
de
d
by
E
ff
at
U
ni
ve
rs
ity
A
t 2
1:
42
2
3
N
ov
em
be
r
20
16
(
PT
)
Unfortunately, the variety of performance measures
make it difficult to draw broad inferences from the
literature about the relationship between a given logistics
practice and performance. Meta-analysis, or aggregating
the findings of several studies[41], is frustrated by the use
of diverse measures. Differences in findings between one
study and another may be attributable solely to the
measures used.
Defining Logistics Performance
Conceptually, logistics performance may be viewed as a
subset of the larger notion of firm or organizational
performance. The latter has attracted a large volume of
diverse research over the years[2,35] and illustrates the
futile nature of the search for the “one best way” of
defining performance. For example, Gleason and Barnum
chose to distinguish between effectiveness and efficiency.
They defined effectiveness as “the extent to which an
objective has been achieved”, while efficiency was defined
as “the degree to which resources have been used
economically”[42, p. 380]. Simply put, efficiency is “doing
things right”, while effectiveness is “doing the right
thing”[42, pp. 3,4]. Sink and his colleagues, on the other
hand, defined seven dimensions in order to capture their
conception of “what performance means”: they are
effectiveness, efficiency, quality, productivity, quality of
work life, innovation and profitability/budgetability[43,
pp. 266-7].
Both of these examples have strengths and weaknesses.
A principle strength of Gleason and Barnum’s work is its
simplicity. This simplicity may be somewhat deceptive,
however: a convincing case could be made about the
importance of efficiency as one dimension of
effectiveness. As for the dimensions identified by Sink
and his colleagues, they are intriguing because they meet
the need for a broad, comprehensive framework.
However, this comes at the price of some overlap between
the various dimensions, as the authors themselves
infer[43,p. 268]. In particular, the distinction between
performance and effectiveness is somewhat unclear.
Given the lack of any universally-accepted definition for
performance in the organizational literature, it should not
be surprising that extant literature offers many ideas
about the dimensions that ought to be incorporated into a
conceptualization of “logistics performance”. One of the
best examples is the framework presented by Rhea and
Shrock, where physical distribution effectiveness is
defined as “the extent to which distribution programmes
satisfy customers”[5, p. 35]. They note, however, that
other goals remain important under this definition:
In taking this orientation, decision makers do not ignore the
well-documented need to control costs. Rather, they
incorporate this objective within a customer-oriented
managerial philosophy in which it is believed that the long-
run goal of profitability is achieved by providing customer
need and want satisfaction[44; 5, p. 35].
The literature review provided by Rhea and Shrock
suggests that care must be taken to incorporate multiple
goals in defining performance. In order to begin the task
of conceptualizing what the various dimensions of
logistics effectiveness might look like, we identified a
representative set of answers to the question, “what is
logistics performance?” The results of this exercise are
shown in Figure 1. Logistics performance may be defined
as the extent to which goals such as those suggested in
Figure 1 are achieved.
Figure 1 incorporates various possible dimensions of
performance in a single envelope to help highlight the
numerous interdependencies and conflicts between the
goals. For example, interdependency is likely to exist
between employee satisfaction, the quality of customer
service and profitability. A conflict would occur if a pay
rise for employees were postponed to achieve a short-
term financial improvement – a move which may inhibit
the firm’s ability to attract and retain employees who are
capable of delivering quality customer service to the
benefit of long-run profits. Another example is that a firm
may find it advantageous in the short run to make more
extensive use of packaging in an environmentally-
suboptimal way although it may face more stringent
23LOGISTICS PERFORMANCE: DEFINITION AND
MEASUREMENT
Cost-efficiency
Profitability
Social
responsibility
On-time
delivery
Sales growth
Job security and
working conditions
Customer
satisfaction
Keeping
promises
Flexibility
"Fair" prices
for inputs
Low loss
and damage
Product
availability
Figure 1. What Is Logistics Performance?
Care must be taken
to incorporate multiple
goals…
D
ow
nl
oa
de
d
by
E
ff
at
U
ni
ve
rs
ity
A
t 2
1:
42
2
3
N
ov
em
be
r
20
16
(
PT
)
regulation, increased paper burden and compliance costs
and reduced profits in the long run.
Measuring Logistics Performance
The preceding discussion argues that performance is
multi-dimensional. No one measure will suffice for
logistics performance. Instead, the objective for
researchers and managers is to find a set of measures
which collectively capture most, if not all, of the
performance dimensions thought to be important, over
both short- and long-term horizons. For example, in a
presentation at the Tenth International Logistics
Congress in Toronto, in June 1993, Mr D. Eggleton of
Rank-Xerox described the criteria on which his
performance is evaluated as employee satisfaction,
customer satisfaction, and the company’s rate of return.
Many dimensions of logistics performance lend
themselves well to hard performance measures. A
representative collection of these, along with key
advantages and disadvantages, is shown in Table VII.
Hard performance measures such as net income or order
fill rate are typically impersonal, accurate and easy and
inexpensive to collect. Measures such as net income, and
accounting ratios such as return on investment (ROI) are
useful ways of capturing profitability, and will often be
easy and inexpensive to collect, particularly where
logistics is treated as a profit centre. Profitability is a
particularly useful goal because it directly reflects the
goals of all of the organization’s internal constituent
groups to one extent or another, although it may not be a
good indicator of the viability of the firm in the long run.
Cost accounting measures may also be useful,
particularly in evaluating several dimensions of
efficiency. The data are often highly accurate and, in
many cases, available over long periods of time. However,
these measures are not always comparable between one
organization and another. Changes in accounting
practices may even inhibit valid comparisons within the
same organization over time.
There are some difficulties which are common to both raw
financial measures and cost accounting data. Because
they are often considered confidential, many firms are
reluctant to release information to outsiders. Also, in
making comparisons between organizations or time
periods, variations in standards or accounting methods
are a frequent threat[45]. A particular problem to logistics
researchers is that in many cases, the level of aggregation
is so high that it is difficult to utilize for evaluating sub-
functions of the firm.
The use of input-output ratios (also known as
productivity or performance indicators) is common in
logistics, and has received extensive treatments in
textbooks and other literature[8, 46]. Many goals lend
themselves well to evaluation using these measures. For
example, productivity may be measured utilizing ratios
such as number of shipments per vehicle-mile, while a
ratio such as percentage orders delivered on time will be
helpful in evaluating the quality of service rendered. As
the concern of society over environmental issues grows,
some firms may find it useful to calculate ratios such as
“tons of packaging used/total tonnage shipped”. Again,
the limited ability of the researcher to gain access to these
data because of their confidential nature is a potential
disadvantage. Also, variations in definitions and data
24 IJPD & LM 24,1
Measure type Advantages/disadvantages
Raw financial statistics (e.g. net income, Advantages: Often
easy and inexpensive to collect, and is likely to be comparable
gross sales) between organizations. Can capture several
important dimensions of
performance, often with impressive accuracy
Cost statistics (e.g. transport cost,
standard labour costs) Disadvantages: May not be comparable
between one time interval and another.
Accounting methods may limit comparability between
organizations. Level of
aggregation may be so large that it is difficult to assign
responsibility. Firms
may be unwilling to divulge information
Input/output measures or “performance Advantages: Can be
used to evaluate goal attainment in many areas, particularly
indicators” (e.g. number of shipments/ efficiency and
effectiveness
vehicle hour)
Quality measures (e.g. order cycle time) Disadvantages: Narrow
focus upon individual performance indicators may easily
cause faulty analysis or decision-making. Researchers may have
trouble getting
data. May be incomparable across organizations
Table VII. Alternative “Hard” Measures for Logistics
Performance
D
ow
nl
oa
de
d
by
E
ff
at
U
ni
ve
rs
ity
A
t 2
1:
42
2
3
N
ov
em
be
r
20
16
(
PT
)
collection procedures will often make it difficult to
compare performance indicators between one
organization and another.
For service measures such as order cycle time or lead
time variability, the advantages and disadvantages are
essentially the same as those of performance indicators.
One limitation common to both is that there are many
dimensions of performance which they cannot capture,
particularly the extent to which customers are satisfied.
The difficulty in capturing customer satisfaction is the
underlying reason that hard measures should be
supplemented with “soft”, perceptual ones. Although
there are several dimensions of logistics performance
which hard measures cannot capture in a meaningful
way, customer satisfaction is perhaps the most critical. A
set of soft measures, collected using techniques such as
the mail survey, telephone interview, or similar method
are needed. Besides their usefulness in identifying
problems, soft measures may also be called for where
available hard measures are not comparable between one
organization and another because of differences in
accounting standards or similar problems. These
measures are subject to the limitations inherent in any
self-report, such as consistency bias, and the social
desirability problem[27,39]. The difficulties are especially
serious for one-item measures[27].
Soft measures may also raise comparability problems.
Suppose that a handful of manufacturers in the same
industry report (on a scale of 1 to 5) how well their
logistics function achieves on-time delivery goals. The
responses may be difficult to interpret if (as will likely be
the case), there is variation in the competitive strategy or
goals of the firms. This may well influence what is
reported by the respondent. As an example, consider two
firms with an actual on-time delivery level of 80 per cent.
Each firm’s manager is asked to rate performance. If
Firm A’s goal is 100 per cent and Firm B’s goal is 80 per
cent, it is likely that Firm A’s manager will provide a
lower performance rating than Firm B’s. In other
contexts, low scores on “quality of service” may reflect
the presence of a cost-minimization strategy which are
not meaningfully comparable to those of a firm seeking to
differentiate itself by providing superior service. Soft
measures are associated with a host of other limitations,
the most notable being self-report defects[27] or other
forms of bias[39].
An excellent way to improve the validity of soft measures
may be found in Churchill’s paradigm for developing
better measures of marketing constructs[47]. Essentially,
the paradigm comprises a number of carefully-ordered
steps by which literature searches, surveys and analysis
procedures are linked together in a coherent and justified
sequence. First, the domain of the construct is specified.
Next, a sample of items is generated. Third, the measure
is purified. Reliability and validity of the construct are
then assessed. The Churchill paradigm has been
employed by a handful of logistics scholars[22], with
promising results.
The discussion presented here suggests that although the
optimal set of performance measures will depend on the
purpose of the research, it will often include a collection of
both hard and soft measures. One important criterion to
consider in choosing the set is “representativeness”. That
is, the set of measures should meaningfully capture those
dimensions of performance in which the researcher is
interested. The use of only one or two measures of
performance is justified for the researcher whose study
addresses only customer satisfaction or cost efficiency.
However, findings from such studies should not be
carelessly extrapolated to include the larger variable,
logistics performance.
Recommendations
This article argues that defining and measuring
performance in logistics is a difficult enterprise, for both
researchers and managers. The literature review reveals
the nature and limitations of the various designs and
measures which have been used thus far and, along with
subsequent sections, suggests that there are no “easy”
ways to address the issues raised. In light of this review,
we offer five recommendations which should help
improve the quality of future research.
More Efforts to Develop Performance Measures
In the short run, we urge researchers to give more
detailed information about how they have defined and
measured performance, and about the limitations of their
study and its findings. Inadequate reporting of the
appropriate caveats serves only to mislead readers and
frustrate logistical excellence.
Special issues of logistics journals devoted to
measurement and methodological issues would be most
useful. Their leading role would be very likely to generate
added interest in logistics research methodology among
researchers and students. A more coherent picture of the
various dimensions of performance would make it much
25LOGISTICS PERFORMANCE: DEFINITION AND
MEASUREMENT
Factor analysis will
be an especially
useful tool
D
ow
nl
oa
de
d
by
E
ff
at
U
ni
ve
rs
ity
A
t 2
1:
42
2
3
N
ov
em
be
r
20
16
(
PT
)
easier to address subsequent questions such as, “how”
should each dimension be measured?”, and “who should
provide data for each measurement?”
Increased attention to the development of valid measures
is warranted, particularly the soft ones which capture
dimensions of performance which are otherwise left out.
The encouraging results of the study by Gassenheimer
and his colleagues, in which factor analysis is used,
suggest that this will be an especially useful tool for
developing valid perceptual or self-report scales[11]. As
noted earlier, expanded use of the paradigm suggested by
Churchill[47] is very likely to enhance the validity of
studies that are conducted, and also facilitate aggregation
and comparison among them.
Encouragement of More Innovative Research Designs
Studies in which more than one constituency provides
data in evaluating performance should be
encouraged[48]. Although “rate-your-own-company”
studies have a legitimate place in research, they need to
be supplemented by data from other constituent groups,
especially customers.
While we suspect that the mail survey will continue to be
an important data-collection method, journal editors
should encourage studies in which alternative methods
are used. Also, in the short run, journal reviewers and
editors should insist that submissions articulate and
justify how performance has been defined, and describe
the measures that have been used. In particular,
questionnaires should be reproduced verbatim in an
appendix, or an address provided where interested
researchers may obtain a copy. In this way, a body of
time-tested items can be built up in short order, meta-
analyses are facilitated, and needless “re-invent the
wheel” exercises are avoided.
Quantitative techniques such as data envelopment
analysis and total factor productivity both represent
potentially valuable ways to evaluate economic
performance, and are potentially important tools in
logistics research. However, these should not be
permitted to obscure the potential gains in knowledge
that may be facilitated by qualitative studies, most
notably the “case study” approach. One particular form of
case study that has proven invaluable for many firms is
the “logistics performance audit” in which a team
systematically evaluates a firm’s logistics function.
Development of Contingency Models of Logistics
Performance
Researchers might do well to explore contingency models
of logistics performance[49,50]. To date, their utilization
has been sparse, despite their intuitive appeal. Rather
than the “one-best-way” paradigm which is common in so
many discussions of logistics research, a contingency
model would be based on the supposition that the fit
between logistics organization and strategy and the
organization’s environment, product line, production
technology and size will influence performance outcome
variables. The development and testing of such a model
might well stimulate research on the question of the
primacy of various performance dimensions. For
example, the firm which has adopted a cost-minimization
strategy may be better served by focusing on cost
dimensions of performance than the firm which has
chosen to differentiate itself on quality of service. While
this assertion may have intuitive appeal, it has little in the
way of empirical support thus far.
Recognition of the Implications of Supply Chain
Management
The shift to supply chain management has two
implications for logistics performance. First, the
measurement of performance must recognize the
particular role of an organization in a supply chain.
Comparable stages in different channels may be
associated with different functions. Second, consideration
should be given to assessing the performance of the
supply chain, not just that of individual participants.
More Bridge-building between Theory and Practice Is
Needed
Researchers can and should play a role in making
practitioners more familiar with the importance, nature
and limitations of research. Practitioners, on the other
hand, can offer needed insights into the types of logistics
issues that merit greater study and thought, and more
generally, what our overall “focus” should be. Taking
advantage of whatever opportunities we receive to
engage in dialogue will help ensure that the research we
conduct fulfils pragmatic purposes in the long run.
References
1. Chow, G. and Henriksson, L. E., A Critique of Survey
Research in Logistics, Working Paper 93-TRA-009,
University of British Columbia, Faculty of Commerce
and Business Administration, 1993.
2. Hall, R., Organizations: Structures, Processes and
Outcomes, Prentice-Hall, New York and London, 1991,
p. 267.
26 IJPD & LM 24,1
Quantitative techniques are
potentially important in
logistics research
D
ow
nl
oa
de
d
by
E
ff
at
U
ni
ve
rs
ity
A
t 2
1:
42
2
3
N
ov
em
be
r
ARTICLE IN PRESS0925-5273$ - sedoi10.1016j.ijp.docx

More Related Content

Similar to ARTICLE IN PRESS0925-5273$ - sedoi10.1016j.ijp.docx

A Survey Of The Literature On Order-Picking Systems By Combining Planning Pro...
A Survey Of The Literature On Order-Picking Systems By Combining Planning Pro...A Survey Of The Literature On Order-Picking Systems By Combining Planning Pro...
A Survey Of The Literature On Order-Picking Systems By Combining Planning Pro...Jose Katab
 
CONSIGNMENT INVENTORY SIMULATION MODEL FOR SINGLE VENDOR-MULTI BUYERS IN A SU...
CONSIGNMENT INVENTORY SIMULATION MODEL FOR SINGLE VENDOR-MULTI BUYERS IN A SU...CONSIGNMENT INVENTORY SIMULATION MODEL FOR SINGLE VENDOR-MULTI BUYERS IN A SU...
CONSIGNMENT INVENTORY SIMULATION MODEL FOR SINGLE VENDOR-MULTI BUYERS IN A SU...IAEME Publication
 
European Journal of Operational Research 176 (2007) 210–229.docx
European Journal of Operational Research 176 (2007) 210–229.docxEuropean Journal of Operational Research 176 (2007) 210–229.docx
European Journal of Operational Research 176 (2007) 210–229.docxelbanglis
 
A Modified PSO Based Solution Approach for Economic Ordered Quantity Problem ...
A Modified PSO Based Solution Approach for Economic Ordered Quantity Problem ...A Modified PSO Based Solution Approach for Economic Ordered Quantity Problem ...
A Modified PSO Based Solution Approach for Economic Ordered Quantity Problem ...irjes
 
ch5 Managing Materials Flow.pptx
ch5 Managing Materials Flow.pptxch5 Managing Materials Flow.pptx
ch5 Managing Materials Flow.pptxKaythisoe3
 
Impact of Variable Ordering Cost and Promotional Effort Cost in Deteriorated ...
Impact of Variable Ordering Cost and Promotional Effort Cost in Deteriorated ...Impact of Variable Ordering Cost and Promotional Effort Cost in Deteriorated ...
Impact of Variable Ordering Cost and Promotional Effort Cost in Deteriorated ...IJAEMSJORNAL
 
Inventory Management of a Fast-Fashion Retail Network
Inventory Management of a Fast-Fashion Retail NetworkInventory Management of a Fast-Fashion Retail Network
Inventory Management of a Fast-Fashion Retail NetworkHadi Sharifi
 
STRATEGIES OF DELAY DELIVERY AND CONTROLLABLE LEAD TIME IN SUPPLY CHAIN CONSI...
STRATEGIES OF DELAY DELIVERY AND CONTROLLABLE LEAD TIME IN SUPPLY CHAIN CONSI...STRATEGIES OF DELAY DELIVERY AND CONTROLLABLE LEAD TIME IN SUPPLY CHAIN CONSI...
STRATEGIES OF DELAY DELIVERY AND CONTROLLABLE LEAD TIME IN SUPPLY CHAIN CONSI...IAEME Publication
 
Organizing warehousemanagementN. FaberNetherlands Defe.docx
Organizing warehousemanagementN. FaberNetherlands Defe.docxOrganizing warehousemanagementN. FaberNetherlands Defe.docx
Organizing warehousemanagementN. FaberNetherlands Defe.docxgerardkortney
 
warehouse efficiencies
warehouse efficiencieswarehouse efficiencies
warehouse efficienciesanstedsngist
 
AN OPTIMIZING INTEGRATED INVENTORY MODEL WITH INVESTMENT FOR QUALITY IMPROVEM...
AN OPTIMIZING INTEGRATED INVENTORY MODEL WITH INVESTMENT FOR QUALITY IMPROVEM...AN OPTIMIZING INTEGRATED INVENTORY MODEL WITH INVESTMENT FOR QUALITY IMPROVEM...
AN OPTIMIZING INTEGRATED INVENTORY MODEL WITH INVESTMENT FOR QUALITY IMPROVEM...IJITCA Journal
 
Impact and Dynamics of Centralization in Transportation Cost of Cement Bag’s ...
Impact and Dynamics of Centralization in Transportation Cost of Cement Bag’s ...Impact and Dynamics of Centralization in Transportation Cost of Cement Bag’s ...
Impact and Dynamics of Centralization in Transportation Cost of Cement Bag’s ...IJMER
 
0562 financial management
0562 financial management0562 financial management
0562 financial managementhusnaink
 
Inventory Management: How Incremental Improvements Drive Big Gains
Inventory Management: How Incremental Improvements Drive Big GainsInventory Management: How Incremental Improvements Drive Big Gains
Inventory Management: How Incremental Improvements Drive Big GainsCognizant
 
MANAGEMENT INVENTORY FLOWS IN THE SUPPLY CHAIN
MANAGEMENT INVENTORY FLOWS IN THE SUPPLY CHAINMANAGEMENT INVENTORY FLOWS IN THE SUPPLY CHAIN
MANAGEMENT INVENTORY FLOWS IN THE SUPPLY CHAINAshish Hande
 
Rich routing problems arising in supply chain management (2012)
Rich routing problems arising in supply chain management (2012)Rich routing problems arising in supply chain management (2012)
Rich routing problems arising in supply chain management (2012)siska_suryanto
 

Similar to ARTICLE IN PRESS0925-5273$ - sedoi10.1016j.ijp.docx (20)

A Survey Of The Literature On Order-Picking Systems By Combining Planning Pro...
A Survey Of The Literature On Order-Picking Systems By Combining Planning Pro...A Survey Of The Literature On Order-Picking Systems By Combining Planning Pro...
A Survey Of The Literature On Order-Picking Systems By Combining Planning Pro...
 
CONSIGNMENT INVENTORY SIMULATION MODEL FOR SINGLE VENDOR-MULTI BUYERS IN A SU...
CONSIGNMENT INVENTORY SIMULATION MODEL FOR SINGLE VENDOR-MULTI BUYERS IN A SU...CONSIGNMENT INVENTORY SIMULATION MODEL FOR SINGLE VENDOR-MULTI BUYERS IN A SU...
CONSIGNMENT INVENTORY SIMULATION MODEL FOR SINGLE VENDOR-MULTI BUYERS IN A SU...
 
CONSIGNMENT INVENTORY SIMULATION MODEL FOR SINGLE VENDOR-MULTI BUYERS IN A SU...
CONSIGNMENT INVENTORY SIMULATION MODEL FOR SINGLE VENDOR-MULTI BUYERS IN A SU...CONSIGNMENT INVENTORY SIMULATION MODEL FOR SINGLE VENDOR-MULTI BUYERS IN A SU...
CONSIGNMENT INVENTORY SIMULATION MODEL FOR SINGLE VENDOR-MULTI BUYERS IN A SU...
 
European Journal of Operational Research 176 (2007) 210–229.docx
European Journal of Operational Research 176 (2007) 210–229.docxEuropean Journal of Operational Research 176 (2007) 210–229.docx
European Journal of Operational Research 176 (2007) 210–229.docx
 
A Modified PSO Based Solution Approach for Economic Ordered Quantity Problem ...
A Modified PSO Based Solution Approach for Economic Ordered Quantity Problem ...A Modified PSO Based Solution Approach for Economic Ordered Quantity Problem ...
A Modified PSO Based Solution Approach for Economic Ordered Quantity Problem ...
 
ch5 Managing Materials Flow.pptx
ch5 Managing Materials Flow.pptxch5 Managing Materials Flow.pptx
ch5 Managing Materials Flow.pptx
 
Intro of logistics
Intro of logisticsIntro of logistics
Intro of logistics
 
Impact of Variable Ordering Cost and Promotional Effort Cost in Deteriorated ...
Impact of Variable Ordering Cost and Promotional Effort Cost in Deteriorated ...Impact of Variable Ordering Cost and Promotional Effort Cost in Deteriorated ...
Impact of Variable Ordering Cost and Promotional Effort Cost in Deteriorated ...
 
Inventory Management of a Fast-Fashion Retail Network
Inventory Management of a Fast-Fashion Retail NetworkInventory Management of a Fast-Fashion Retail Network
Inventory Management of a Fast-Fashion Retail Network
 
STRATEGIES OF DELAY DELIVERY AND CONTROLLABLE LEAD TIME IN SUPPLY CHAIN CONSI...
STRATEGIES OF DELAY DELIVERY AND CONTROLLABLE LEAD TIME IN SUPPLY CHAIN CONSI...STRATEGIES OF DELAY DELIVERY AND CONTROLLABLE LEAD TIME IN SUPPLY CHAIN CONSI...
STRATEGIES OF DELAY DELIVERY AND CONTROLLABLE LEAD TIME IN SUPPLY CHAIN CONSI...
 
Organizing warehousemanagementN. FaberNetherlands Defe.docx
Organizing warehousemanagementN. FaberNetherlands Defe.docxOrganizing warehousemanagementN. FaberNetherlands Defe.docx
Organizing warehousemanagementN. FaberNetherlands Defe.docx
 
warehouse efficiencies
warehouse efficiencieswarehouse efficiencies
warehouse efficiencies
 
AN OPTIMIZING INTEGRATED INVENTORY MODEL WITH INVESTMENT FOR QUALITY IMPROVEM...
AN OPTIMIZING INTEGRATED INVENTORY MODEL WITH INVESTMENT FOR QUALITY IMPROVEM...AN OPTIMIZING INTEGRATED INVENTORY MODEL WITH INVESTMENT FOR QUALITY IMPROVEM...
AN OPTIMIZING INTEGRATED INVENTORY MODEL WITH INVESTMENT FOR QUALITY IMPROVEM...
 
AN OPTIMIZING INTEGRATED INVENTORY MODEL WITH INVESTMENT FOR QUALITY IMPROVEM...
AN OPTIMIZING INTEGRATED INVENTORY MODEL WITH INVESTMENT FOR QUALITY IMPROVEM...AN OPTIMIZING INTEGRATED INVENTORY MODEL WITH INVESTMENT FOR QUALITY IMPROVEM...
AN OPTIMIZING INTEGRATED INVENTORY MODEL WITH INVESTMENT FOR QUALITY IMPROVEM...
 
Impact and Dynamics of Centralization in Transportation Cost of Cement Bag’s ...
Impact and Dynamics of Centralization in Transportation Cost of Cement Bag’s ...Impact and Dynamics of Centralization in Transportation Cost of Cement Bag’s ...
Impact and Dynamics of Centralization in Transportation Cost of Cement Bag’s ...
 
0562 financial management
0562 financial management0562 financial management
0562 financial management
 
Inventory Management: How Incremental Improvements Drive Big Gains
Inventory Management: How Incremental Improvements Drive Big GainsInventory Management: How Incremental Improvements Drive Big Gains
Inventory Management: How Incremental Improvements Drive Big Gains
 
MANAGEMENT INVENTORY FLOWS IN THE SUPPLY CHAIN
MANAGEMENT INVENTORY FLOWS IN THE SUPPLY CHAINMANAGEMENT INVENTORY FLOWS IN THE SUPPLY CHAIN
MANAGEMENT INVENTORY FLOWS IN THE SUPPLY CHAIN
 
Rich routing problems arising in supply chain management (2012)
Rich routing problems arising in supply chain management (2012)Rich routing problems arising in supply chain management (2012)
Rich routing problems arising in supply chain management (2012)
 
Warehousing Case Study
Warehousing Case StudyWarehousing Case Study
Warehousing Case Study
 

More from davezstarr61655

you must read two articles which are from the field of Human Resou.docx
you must read two articles which are from the field of Human Resou.docxyou must read two articles which are from the field of Human Resou.docx
you must read two articles which are from the field of Human Resou.docxdavezstarr61655
 
You must produce a minimum of a 5 pages paper. You must use a minimu.docx
You must produce a minimum of a 5 pages paper. You must use a minimu.docxYou must produce a minimum of a 5 pages paper. You must use a minimu.docx
You must produce a minimum of a 5 pages paper. You must use a minimu.docxdavezstarr61655
 
You must provide a references for entire posting. Please use APA for.docx
You must provide a references for entire posting. Please use APA for.docxYou must provide a references for entire posting. Please use APA for.docx
You must provide a references for entire posting. Please use APA for.docxdavezstarr61655
 
you must present your findings to the IT supervisor before the s.docx
you must present your findings to the IT supervisor before the s.docxyou must present your findings to the IT supervisor before the s.docx
you must present your findings to the IT supervisor before the s.docxdavezstarr61655
 
You must produce a minimum of a 10 pages paper. You must use a m.docx
You must produce a minimum of a 10 pages paper. You must use a m.docxYou must produce a minimum of a 10 pages paper. You must use a m.docx
You must produce a minimum of a 10 pages paper. You must use a m.docxdavezstarr61655
 
You must produce a minimum of a 10 pages paper. You must use a minim.docx
You must produce a minimum of a 10 pages paper. You must use a minim.docxYou must produce a minimum of a 10 pages paper. You must use a minim.docx
You must produce a minimum of a 10 pages paper. You must use a minim.docxdavezstarr61655
 
You must include the resources you used if any.. THese papers are op.docx
You must include the resources you used if any.. THese papers are op.docxYou must include the resources you used if any.. THese papers are op.docx
You must include the resources you used if any.. THese papers are op.docxdavezstarr61655
 
You must include the Textbook definition and a picture f.docx
You must include the Textbook definition and a picture f.docxYou must include the Textbook definition and a picture f.docx
You must include the Textbook definition and a picture f.docxdavezstarr61655
 
You must include 6 references, two that must come peer-reviewed .docx
You must include 6 references, two that must come peer-reviewed .docxYou must include 6 references, two that must come peer-reviewed .docx
You must include 6 references, two that must come peer-reviewed .docxdavezstarr61655
 
You must have the Project Libre to create this! Develop a chart .docx
You must have the Project Libre to create this! Develop a chart .docxYou must have the Project Libre to create this! Develop a chart .docx
You must have the Project Libre to create this! Develop a chart .docxdavezstarr61655
 
You must have experience doing PhD proposal , so the topic of th.docx
You must have experience doing PhD proposal , so the topic of th.docxYou must have experience doing PhD proposal , so the topic of th.docx
You must have experience doing PhD proposal , so the topic of th.docxdavezstarr61655
 
You must have at least 3 sources. Sources should be cited within you.docx
You must have at least 3 sources. Sources should be cited within you.docxYou must have at least 3 sources. Sources should be cited within you.docx
You must have at least 3 sources. Sources should be cited within you.docxdavezstarr61655
 
You must have access to the book needed for the Case Study part. I w.docx
You must have access to the book needed for the Case Study part. I w.docxYou must have access to the book needed for the Case Study part. I w.docx
You must have access to the book needed for the Case Study part. I w.docxdavezstarr61655
 
You must give the Source(s) of your answers (textbook - WITH SPECIFI.docx
You must give the Source(s) of your answers (textbook - WITH SPECIFI.docxYou must give the Source(s) of your answers (textbook - WITH SPECIFI.docx
You must give the Source(s) of your answers (textbook - WITH SPECIFI.docxdavezstarr61655
 
You must create a court system for the newly created state of Puerto.docx
You must create a court system for the newly created state of Puerto.docxYou must create a court system for the newly created state of Puerto.docx
You must create a court system for the newly created state of Puerto.docxdavezstarr61655
 
You must conduct an informational interview as part of this course. .docx
You must conduct an informational interview as part of this course. .docxYou must conduct an informational interview as part of this course. .docx
You must conduct an informational interview as part of this course. .docxdavezstarr61655
 
You must complete an Electronic Presentation on Black Culture.docx
You must complete an Electronic Presentation on Black Culture.docxYou must complete an Electronic Presentation on Black Culture.docx
You must complete an Electronic Presentation on Black Culture.docxdavezstarr61655
 
You must complete an Electronic Presentation on Black Cu.docx
You must complete an Electronic Presentation on Black Cu.docxYou must complete an Electronic Presentation on Black Cu.docx
You must complete an Electronic Presentation on Black Cu.docxdavezstarr61655
 
You must choose from the approved list below1. Angels .docx
You must choose from the approved list below1. Angels .docxYou must choose from the approved list below1. Angels .docx
You must choose from the approved list below1. Angels .docxdavezstarr61655
 
You must be proficient in all MS office. I am looking for someon.docx
You must be proficient in all MS office. I am looking for someon.docxYou must be proficient in all MS office. I am looking for someon.docx
You must be proficient in all MS office. I am looking for someon.docxdavezstarr61655
 

More from davezstarr61655 (20)

you must read two articles which are from the field of Human Resou.docx
you must read two articles which are from the field of Human Resou.docxyou must read two articles which are from the field of Human Resou.docx
you must read two articles which are from the field of Human Resou.docx
 
You must produce a minimum of a 5 pages paper. You must use a minimu.docx
You must produce a minimum of a 5 pages paper. You must use a minimu.docxYou must produce a minimum of a 5 pages paper. You must use a minimu.docx
You must produce a minimum of a 5 pages paper. You must use a minimu.docx
 
You must provide a references for entire posting. Please use APA for.docx
You must provide a references for entire posting. Please use APA for.docxYou must provide a references for entire posting. Please use APA for.docx
You must provide a references for entire posting. Please use APA for.docx
 
you must present your findings to the IT supervisor before the s.docx
you must present your findings to the IT supervisor before the s.docxyou must present your findings to the IT supervisor before the s.docx
you must present your findings to the IT supervisor before the s.docx
 
You must produce a minimum of a 10 pages paper. You must use a m.docx
You must produce a minimum of a 10 pages paper. You must use a m.docxYou must produce a minimum of a 10 pages paper. You must use a m.docx
You must produce a minimum of a 10 pages paper. You must use a m.docx
 
You must produce a minimum of a 10 pages paper. You must use a minim.docx
You must produce a minimum of a 10 pages paper. You must use a minim.docxYou must produce a minimum of a 10 pages paper. You must use a minim.docx
You must produce a minimum of a 10 pages paper. You must use a minim.docx
 
You must include the resources you used if any.. THese papers are op.docx
You must include the resources you used if any.. THese papers are op.docxYou must include the resources you used if any.. THese papers are op.docx
You must include the resources you used if any.. THese papers are op.docx
 
You must include the Textbook definition and a picture f.docx
You must include the Textbook definition and a picture f.docxYou must include the Textbook definition and a picture f.docx
You must include the Textbook definition and a picture f.docx
 
You must include 6 references, two that must come peer-reviewed .docx
You must include 6 references, two that must come peer-reviewed .docxYou must include 6 references, two that must come peer-reviewed .docx
You must include 6 references, two that must come peer-reviewed .docx
 
You must have the Project Libre to create this! Develop a chart .docx
You must have the Project Libre to create this! Develop a chart .docxYou must have the Project Libre to create this! Develop a chart .docx
You must have the Project Libre to create this! Develop a chart .docx
 
You must have experience doing PhD proposal , so the topic of th.docx
You must have experience doing PhD proposal , so the topic of th.docxYou must have experience doing PhD proposal , so the topic of th.docx
You must have experience doing PhD proposal , so the topic of th.docx
 
You must have at least 3 sources. Sources should be cited within you.docx
You must have at least 3 sources. Sources should be cited within you.docxYou must have at least 3 sources. Sources should be cited within you.docx
You must have at least 3 sources. Sources should be cited within you.docx
 
You must have access to the book needed for the Case Study part. I w.docx
You must have access to the book needed for the Case Study part. I w.docxYou must have access to the book needed for the Case Study part. I w.docx
You must have access to the book needed for the Case Study part. I w.docx
 
You must give the Source(s) of your answers (textbook - WITH SPECIFI.docx
You must give the Source(s) of your answers (textbook - WITH SPECIFI.docxYou must give the Source(s) of your answers (textbook - WITH SPECIFI.docx
You must give the Source(s) of your answers (textbook - WITH SPECIFI.docx
 
You must create a court system for the newly created state of Puerto.docx
You must create a court system for the newly created state of Puerto.docxYou must create a court system for the newly created state of Puerto.docx
You must create a court system for the newly created state of Puerto.docx
 
You must conduct an informational interview as part of this course. .docx
You must conduct an informational interview as part of this course. .docxYou must conduct an informational interview as part of this course. .docx
You must conduct an informational interview as part of this course. .docx
 
You must complete an Electronic Presentation on Black Culture.docx
You must complete an Electronic Presentation on Black Culture.docxYou must complete an Electronic Presentation on Black Culture.docx
You must complete an Electronic Presentation on Black Culture.docx
 
You must complete an Electronic Presentation on Black Cu.docx
You must complete an Electronic Presentation on Black Cu.docxYou must complete an Electronic Presentation on Black Cu.docx
You must complete an Electronic Presentation on Black Cu.docx
 
You must choose from the approved list below1. Angels .docx
You must choose from the approved list below1. Angels .docxYou must choose from the approved list below1. Angels .docx
You must choose from the approved list below1. Angels .docx
 
You must be proficient in all MS office. I am looking for someon.docx
You must be proficient in all MS office. I am looking for someon.docxYou must be proficient in all MS office. I am looking for someon.docx
You must be proficient in all MS office. I am looking for someon.docx
 

Recently uploaded

Russian Escort Service in Delhi 11k Hotel Foreigner Russian Call Girls in Delhi
Russian Escort Service in Delhi 11k Hotel Foreigner Russian Call Girls in DelhiRussian Escort Service in Delhi 11k Hotel Foreigner Russian Call Girls in Delhi
Russian Escort Service in Delhi 11k Hotel Foreigner Russian Call Girls in Delhikauryashika82
 
Grant Readiness 101 TechSoup and Remy Consulting
Grant Readiness 101 TechSoup and Remy ConsultingGrant Readiness 101 TechSoup and Remy Consulting
Grant Readiness 101 TechSoup and Remy ConsultingTechSoup
 
TỔNG ÔN TẬP THI VÀO LỚP 10 MÔN TIẾNG ANH NĂM HỌC 2023 - 2024 CÓ ĐÁP ÁN (NGỮ Â...
TỔNG ÔN TẬP THI VÀO LỚP 10 MÔN TIẾNG ANH NĂM HỌC 2023 - 2024 CÓ ĐÁP ÁN (NGỮ Â...TỔNG ÔN TẬP THI VÀO LỚP 10 MÔN TIẾNG ANH NĂM HỌC 2023 - 2024 CÓ ĐÁP ÁN (NGỮ Â...
TỔNG ÔN TẬP THI VÀO LỚP 10 MÔN TIẾNG ANH NĂM HỌC 2023 - 2024 CÓ ĐÁP ÁN (NGỮ Â...Nguyen Thanh Tu Collection
 
The basics of sentences session 2pptx copy.pptx
The basics of sentences session 2pptx copy.pptxThe basics of sentences session 2pptx copy.pptx
The basics of sentences session 2pptx copy.pptxheathfieldcps1
 
Application orientated numerical on hev.ppt
Application orientated numerical on hev.pptApplication orientated numerical on hev.ppt
Application orientated numerical on hev.pptRamjanShidvankar
 
Mixin Classes in Odoo 17 How to Extend Models Using Mixin Classes
Mixin Classes in Odoo 17  How to Extend Models Using Mixin ClassesMixin Classes in Odoo 17  How to Extend Models Using Mixin Classes
Mixin Classes in Odoo 17 How to Extend Models Using Mixin ClassesCeline George
 
microwave assisted reaction. General introduction
microwave assisted reaction. General introductionmicrowave assisted reaction. General introduction
microwave assisted reaction. General introductionMaksud Ahmed
 
Class 11th Physics NEET formula sheet pdf
Class 11th Physics NEET formula sheet pdfClass 11th Physics NEET formula sheet pdf
Class 11th Physics NEET formula sheet pdfAyushMahapatra5
 
Nutritional Needs Presentation - HLTH 104
Nutritional Needs Presentation - HLTH 104Nutritional Needs Presentation - HLTH 104
Nutritional Needs Presentation - HLTH 104misteraugie
 
ICT role in 21st century education and it's challenges.
ICT role in 21st century education and it's challenges.ICT role in 21st century education and it's challenges.
ICT role in 21st century education and it's challenges.MaryamAhmad92
 
This PowerPoint helps students to consider the concept of infinity.
This PowerPoint helps students to consider the concept of infinity.This PowerPoint helps students to consider the concept of infinity.
This PowerPoint helps students to consider the concept of infinity.christianmathematics
 
How to Give a Domain for a Field in Odoo 17
How to Give a Domain for a Field in Odoo 17How to Give a Domain for a Field in Odoo 17
How to Give a Domain for a Field in Odoo 17Celine George
 
PROCESS RECORDING FORMAT.docx
PROCESS      RECORDING        FORMAT.docxPROCESS      RECORDING        FORMAT.docx
PROCESS RECORDING FORMAT.docxPoojaSen20
 
Making and Justifying Mathematical Decisions.pdf
Making and Justifying Mathematical Decisions.pdfMaking and Justifying Mathematical Decisions.pdf
Making and Justifying Mathematical Decisions.pdfChris Hunter
 
1029 - Danh muc Sach Giao Khoa 10 . pdf
1029 -  Danh muc Sach Giao Khoa 10 . pdf1029 -  Danh muc Sach Giao Khoa 10 . pdf
1029 - Danh muc Sach Giao Khoa 10 . pdfQucHHunhnh
 
ICT Role in 21st Century Education & its Challenges.pptx
ICT Role in 21st Century Education & its Challenges.pptxICT Role in 21st Century Education & its Challenges.pptx
ICT Role in 21st Century Education & its Challenges.pptxAreebaZafar22
 
Beyond the EU: DORA and NIS 2 Directive's Global Impact
Beyond the EU: DORA and NIS 2 Directive's Global ImpactBeyond the EU: DORA and NIS 2 Directive's Global Impact
Beyond the EU: DORA and NIS 2 Directive's Global ImpactPECB
 
1029-Danh muc Sach Giao Khoa khoi 6.pdf
1029-Danh muc Sach Giao Khoa khoi  6.pdf1029-Danh muc Sach Giao Khoa khoi  6.pdf
1029-Danh muc Sach Giao Khoa khoi 6.pdfQucHHunhnh
 

Recently uploaded (20)

Russian Escort Service in Delhi 11k Hotel Foreigner Russian Call Girls in Delhi
Russian Escort Service in Delhi 11k Hotel Foreigner Russian Call Girls in DelhiRussian Escort Service in Delhi 11k Hotel Foreigner Russian Call Girls in Delhi
Russian Escort Service in Delhi 11k Hotel Foreigner Russian Call Girls in Delhi
 
Grant Readiness 101 TechSoup and Remy Consulting
Grant Readiness 101 TechSoup and Remy ConsultingGrant Readiness 101 TechSoup and Remy Consulting
Grant Readiness 101 TechSoup and Remy Consulting
 
TỔNG ÔN TẬP THI VÀO LỚP 10 MÔN TIẾNG ANH NĂM HỌC 2023 - 2024 CÓ ĐÁP ÁN (NGỮ Â...
TỔNG ÔN TẬP THI VÀO LỚP 10 MÔN TIẾNG ANH NĂM HỌC 2023 - 2024 CÓ ĐÁP ÁN (NGỮ Â...TỔNG ÔN TẬP THI VÀO LỚP 10 MÔN TIẾNG ANH NĂM HỌC 2023 - 2024 CÓ ĐÁP ÁN (NGỮ Â...
TỔNG ÔN TẬP THI VÀO LỚP 10 MÔN TIẾNG ANH NĂM HỌC 2023 - 2024 CÓ ĐÁP ÁN (NGỮ Â...
 
The basics of sentences session 2pptx copy.pptx
The basics of sentences session 2pptx copy.pptxThe basics of sentences session 2pptx copy.pptx
The basics of sentences session 2pptx copy.pptx
 
Application orientated numerical on hev.ppt
Application orientated numerical on hev.pptApplication orientated numerical on hev.ppt
Application orientated numerical on hev.ppt
 
Mixin Classes in Odoo 17 How to Extend Models Using Mixin Classes
Mixin Classes in Odoo 17  How to Extend Models Using Mixin ClassesMixin Classes in Odoo 17  How to Extend Models Using Mixin Classes
Mixin Classes in Odoo 17 How to Extend Models Using Mixin Classes
 
INDIA QUIZ 2024 RLAC DELHI UNIVERSITY.pptx
INDIA QUIZ 2024 RLAC DELHI UNIVERSITY.pptxINDIA QUIZ 2024 RLAC DELHI UNIVERSITY.pptx
INDIA QUIZ 2024 RLAC DELHI UNIVERSITY.pptx
 
microwave assisted reaction. General introduction
microwave assisted reaction. General introductionmicrowave assisted reaction. General introduction
microwave assisted reaction. General introduction
 
Class 11th Physics NEET formula sheet pdf
Class 11th Physics NEET formula sheet pdfClass 11th Physics NEET formula sheet pdf
Class 11th Physics NEET formula sheet pdf
 
Nutritional Needs Presentation - HLTH 104
Nutritional Needs Presentation - HLTH 104Nutritional Needs Presentation - HLTH 104
Nutritional Needs Presentation - HLTH 104
 
ICT role in 21st century education and it's challenges.
ICT role in 21st century education and it's challenges.ICT role in 21st century education and it's challenges.
ICT role in 21st century education and it's challenges.
 
This PowerPoint helps students to consider the concept of infinity.
This PowerPoint helps students to consider the concept of infinity.This PowerPoint helps students to consider the concept of infinity.
This PowerPoint helps students to consider the concept of infinity.
 
How to Give a Domain for a Field in Odoo 17
How to Give a Domain for a Field in Odoo 17How to Give a Domain for a Field in Odoo 17
How to Give a Domain for a Field in Odoo 17
 
PROCESS RECORDING FORMAT.docx
PROCESS      RECORDING        FORMAT.docxPROCESS      RECORDING        FORMAT.docx
PROCESS RECORDING FORMAT.docx
 
Making and Justifying Mathematical Decisions.pdf
Making and Justifying Mathematical Decisions.pdfMaking and Justifying Mathematical Decisions.pdf
Making and Justifying Mathematical Decisions.pdf
 
1029 - Danh muc Sach Giao Khoa 10 . pdf
1029 -  Danh muc Sach Giao Khoa 10 . pdf1029 -  Danh muc Sach Giao Khoa 10 . pdf
1029 - Danh muc Sach Giao Khoa 10 . pdf
 
Mehran University Newsletter Vol-X, Issue-I, 2024
Mehran University Newsletter Vol-X, Issue-I, 2024Mehran University Newsletter Vol-X, Issue-I, 2024
Mehran University Newsletter Vol-X, Issue-I, 2024
 
ICT Role in 21st Century Education & its Challenges.pptx
ICT Role in 21st Century Education & its Challenges.pptxICT Role in 21st Century Education & its Challenges.pptx
ICT Role in 21st Century Education & its Challenges.pptx
 
Beyond the EU: DORA and NIS 2 Directive's Global Impact
Beyond the EU: DORA and NIS 2 Directive's Global ImpactBeyond the EU: DORA and NIS 2 Directive's Global Impact
Beyond the EU: DORA and NIS 2 Directive's Global Impact
 
1029-Danh muc Sach Giao Khoa khoi 6.pdf
1029-Danh muc Sach Giao Khoa khoi  6.pdf1029-Danh muc Sach Giao Khoa khoi  6.pdf
1029-Danh muc Sach Giao Khoa khoi 6.pdf
 

ARTICLE IN PRESS0925-5273$ - sedoi10.1016j.ijp.docx

  • 1. ARTICLE IN PRESS 0925-5273/$ - se doi:10.1016/j.ijp � Correspondi E-mail addre (K. van Donsel Int. J. Production Economics 121 (2009) 620–632 www.elsevier.com/locate/ijpe Logistics drivers for shelf stacking in grocery retail stores: Potential for efficiency improvement Susan van Zelst, Karel van Donselaar � , Tom van Woensel, Rob Broekmeulen, Jan Fransoo Department of Technology Management, Technische Universiteit Eindhoven, P.O. Box 513, 5600 MB Eindhoven, The Netherlands Received 17 March 2006; accepted 28 June 2006 Available online 30 August 2006 Abstract
  • 2. In retail stores, handling of products typically forms the largest share of the operational costs. The handling activities are mainly driven by the shelf stacking process. While the impact of the handling costs on the profitability of a store is substantial, there are no models available of the different drivers influencing store handling. In this paper, a study of the shelf stacking process is presented. First, a conceptual model based on warehouse operations is derived. It is shown that stacking costs are non-linear with the number of consumer units stacked. Secondly, by means of a motion and time study, data has been collected for dry groceries in four stores of two different European retail companies. Using regression, the developed model clearly demonstrates the impact of the most important drivers for stacking efficiency: case pack (CP) size, number of CPs stacked simultaneously, the filling regime and the working place of the employees. Efficiency gains of 8–49% by changing the driver parameter value are identified. Based on the presented insights both retail companies have already decided to structurally change their current operations. r 2006 Elsevier B.V. All rights reserved. Keywords: Retail operations; Handling; Store; Shelf stacking; Motion and time study; Model 1. Introduction In times of severe competition, many retailers
  • 3. recognize the importance of controlling costs. With known supply chain costs, the information needed to most effectively structure the supply chain can be provided. Moreover, different opportunities needed to simultaneously reduce costs and increase perfor- mance can be identified. In Fig. 1 (see Broekmeulen e front matter r 2006 Elsevier B.V. All rights reserved e.2006.06.010 ng author. ss: [email protected] aar). et al., 2006) the operational logistical costs made in the part of the supply chain that includes the retailer’s warehouse and the store are presented. Since we focus on operational costs, total shelf space and the assortment are assumed to be known. Furthermore, since this cost analysis is based on non-perishables (dry groceries), obsolescence costs are negligible. As a result, the inventory costs in the cost pie in Fig. 1 only consist of the inventory holding costs. It can be seen that the majority of the operational costs are handling costs. In another empirical study by Saghir and Jönson (2001) the same trend was observed: they found that 75% of . www.elsevier.com/locate/ijpe dx.doi.org/10.1016/j.ijpe.2006.06.010 mailto:[email protected] mailto:[email protected] ARTICLE IN PRESS
  • 4. Transportation 22% Handling in warehouse 28% Inventory in store 7% Inventory in warehouse 5% Handling in store 38% Fig. 1. Operational logistical costs in the retail supply chain for non-perishables. S. van Zelst et al. / Int. J. Production Economics 121 (2009) 620–632 621 the handling time in the retail chain occur in the store. 1 In their paper efficiency improvements through the integration and development of new packaging systems are described. In this article, the potential to improve store-handling efficiency is discussed by identifying the drivers for shelf stacking (i.e. given the packages and the inventory replenishment rules). Handling costs in the stores in the two retail chains investigated in this paper are equal to around 50 million euro (or 60 million dollar) per year, indicating that efficiency gains can lead to substantial cost savings as well.
  • 5. Since handling costs are significantly higher than the inventory costs, it is worthwhile to assess the drivers of the handling costs. This shows the need for a model which adequately describes the handling process and its related costs in the store. Today, no complete models are available to estimate handling costs. Consequently, no realistic estimation can be made about the effect of potential improvements in order to reduce handling time and the related costs. Assortment planning and shelf space allocation are important issues in retail, which we would expect to be based on a trade-off between shelf space, inventory costs and handling costs. Yet, even recent studies in this area either ignore the handling costs or simply model them as a linear function of the number of consumer units (CUs) sold (i.e. without intercept). Almost all recent contributions in the literature on retail operations are mainly focussed on the inventory aspect (see e.g. Shah and Avittathur, 2006; Van Donselaar et al., 2006a, b; Hwang et al., 2005; Fleisch and Tellkamp, 2005; 1 The fact that the ratio ‘handling costs in the store vs. handling costs in the warehouse’ presented in Fig. 1 is below the ratio 75:25 is due to the large difference in salaries: in stores, replenishment is often done by (young) part-timers. Ketzenberg et al., 2002; Wee and Dada, 2005; Gaur et al., 2005). So, although it is a major part of the profit equation, little literature is available on handling costs in retail stores. The scarce literature which is available, originates from the 1960s.
  • 6. Moreover, only a few papers focused on minimizing operating costs and reducing both inventories and handling costs (see Chain Store Age, 1963, 1965). SLIM (Store Labor and Inventory Management) was the most widely promoted system in the mid- 1960s for minimizing store handling expense by reducing backroom inventories and the double handling of goods (Chain Store Age, 1965). Today, no models for handling activities in retail stores are available which are tested on empirical data and research in the area is lacking as well. The main contributions of this paper are twofold. First, while the body of literature that studies the efficiency of handling in warehouse operations is substantial, the literature on handling related to store operations is scarce. Most of the literature on retail stores focuses primarily on the demand side, and less on the cost side. When there is a focus on cost, most attention is devoted to inventory holding costs. Little research is available on the assessment of handling costs in retail stores. This paper is a new entry into this almost unexplored domain. Starting from handling models used in warehousing literature, a conceptual model for shelf stacking activities in the retail store is derived. Secondly, the conceptual model is validated using data collected at two retail companies in the grocery sector. Evaluating the conceptual model using regression analysis on the empirical data not only shows there is a relationship between the stacking time and its drivers, but also quantifies the effect of the different important drivers for shelf stacking
  • 7. time in the stores: (1) the number of case packs (CPs) per order line; (2) the CP size (3) the way the shelves are stacked (i.e. filling regime); (4) the worker doing the actual stacking. Using these empirical results, the efficiency gains are quantified. Moreover, based on the obtained results and insights both retail companies have decided to adjust their current operational processes. The organization of the paper closely follows the methodology presented by Mitroff et al. (1974). First the problem is conceptualized and the main variables to be studied are identified. Then the model is built and analysis is conducted based on the model. The model is then validated using the ARTICLE IN PRESS 2 Note that the design of a order pick lane in a warehouse is quite different from an aisle in a store (Broekmeulen, 1998), since the locations and the storage space allocations of the SKUs (slots) in an warehouse are optimized for the handling activities, while the slot allocations in a planogram try to optimize the sales (Corstjens and Doyle, 1981; Urban, 1998).
  • 8. S. van Zelst et al. / Int. J. Production Economics 121 (2009) 620–632622 real life data that were collected in the stores on the actual shelf stacking process. As such this approach fits the concept of model-based empirical research where empirical data are analyzed based on quantitative models, and results can thus be interpreted within a validated modeling context (Bertrand and Fransoo, 2001) In Section 2, the conceptual model for the shelf stacking activities in the store is derived from the warehouse handling models. In Section 3, the research methodology is described in detail. In Section 4, the analysis and the results of the model are discussed using the data collected at two retailers; Section 5 explains the implications for efficiency improvement in the stacking process of a store. Finally, Section 6 concludes and further research options are de- scribed. 2. Conceptual model The following replenishment process is observed for the items on the shelves in the different stores: after unloading the truck, the store clerks move the deliveries to the shelves, unpack the CPs and put the CUs on the shelves. To promote First In First Out retrieval from the shelves by customers and to improve the display, the CUs on the shelves are sometimes rearranged, putting the oldest inventory in front (depending upon the specific product category). Although this shelf stacking process in the store is similar to the order picking process at a warehouse, literature on store handling operations is very scarce, while literature on handling in warehouses is abundant. To derive a conceptual
  • 9. model for shelf stacking in the stores, we first describe the handling activities in warehouses (Section 2.1), then the stacking activities in stores (Section 2.2) and finally, the derivation of a formula for the stacking time. 2.1. Handling activities in warehouses Handling activities are explicitly modeled in warehouse models (Rouwenhorst et al., 2000). These models are very useful as they consider each article or stock-keeping unit (SKU) separately and they include handling costs explicitly as part of the objective function. Moreover, different decisions (e.g. routing policies, picking, etc.) and parameters (e.g. productivity of the workers) can be modeled explicitly in these warehouse models. Therefore, the activities needed for stacking SKUs into the shelves of a grocery store are compared with order picking in a warehouse. As such, shelf stacking is seen as the reverse of order picking, i.e., instead of unloading a container with dif- ferent SKUs in the store, an order picker in the warehouse loads different SKUs in a container for shipment. 2 In this paper, a shipment to be stacked in the store is considered as the equivalent of a customer order which has to be picked in the warehouse. In this analogy, shelf stacking at a store, where the relatively large shipments are divided over several store clerks and these store clerks move the goods to the storage locations on the shelves, resembles zone picking in a warehouse. Zone picking is defined by
  • 10. Frazelle and Apple (1994) as an order picking method where a warehouse is divided into several pick zones, order pickers are assigned to a specific zone and only pick the items in that zone, orders are moved from one zone to the next (usually on conveyor systems) as they are picked (also known as ‘‘pick-and-pass’’). To reflect this resemblance, shelf stacking at the store is referred to as zone stacking in this paper. Zone stacking assumes that the incoming goods are already sorted at the supplier according to the different aisles of the stores. This separation along product characteristics is called family grouping. An order pick cycle in zone picking is the process of loading a container that is part of a shipment to a customer. According to Tompkins et al. (2003), an order pick cycle consists of the fixed setup activities that are related to the start and end of the cycle, such as getting the instructions and transferring the loaded container to the dock boards, and variable activities related to the number of order lines. An order line is defined as an instruction to pick a requested number of units from a specific SKU in the zone. The following activities depend on the number of order lines: traveling (to, from, and between the storage locations), searching for the location, and reaching and bending to access the location (included in activity ‘‘Other’’ in Fig. 2). The actual pick activities such as extracting items from the location and packing the items for shipment depend on the number of ARTICLE IN PRESS
  • 11. 50% 20% 15% 10% 5% 0% 20% 40% 60% Travel Search Pick Setup Other A c ti v it y % of order picker's time Fig. 2. Typical distribution of an order picker’s time.
  • 12. S. van Zelst et al. / Int. J. Production Economics 121 (2009) 620–632 623 requested units. Fig. 2, based on Tompkins et al. (2003), shows a typical distribution of an order picker’s time based on a single order picking strategy, where each order picker completes one order at a time. Note that in zone picking, traveling and searching within a zone are less important than in single order picking, since a zone is relatively compact and the order picker is familiar with the locations in the zone. As a result, traveling and searching in zone stacking in a store may also be less dominant than suggested by Fig. 2. The time required for accessing the location can still be relevant in a warehouse. However, in a store accessing the location is an important activity, because it includes maintenance of the location such as preparing the shelves and removing old inventory. If one wants to promote First In First Out (FIFO) retrieval by the customers of the store, the items have to be shifted or removed before one can stack the new items behind them. In a warehouse, (gravity) flow racks, which are replen- ished from the back, can easily maintain FIFO retrieval. Normally, a store has no space for these kinds of racks or not all types of products are suited for these racks. A more costly solution is assigning more slots to a SKU, such that one slot is the active picking location and the other slot holds the backup inventory. 2.2. Stacking activities in stores
  • 13. As mentioned before, (shelf) stacking in the store is considered as the mirror activity of picking in the warehouse. The process of stacking defined in this paper starts with grabbing a full casepack from a rolling container within the store and ends with the disposal of the waste of the empty casepack. There are three different ways a shelf can be filled with items in the store. The basic filling regime Unit is putting the individual CUs on the shelf. The filling regime is referred to as Tray if the complete CP can be put directly on the shelf. In the filling regime Loose, the items can be dumped on the shelf without rearranging. This requires normally the availability of a type of crate on the shelf. While the picking time in a warehouse is related to the number of requested units, the filling time in the store is expected to be dependent on the number of CUs (if filling regime is Unit) or the number of CPs (if filling regime is Tray or Loose). Another important activity in zone stacking is grabbing and unpacking the items. Unpacking is necessary when the store wants to present the individual items or when the CP does not have the same physical dimensions as the storage location. This activity resembles the replenishment operation in a warehouse. During replenishment in a ware- house, the same type of problems are encountered when one wants to put a full pallet in a slot that is less than a pallet or that has still items at the location. The review by Rouwenhorst et al. (2000) indicates that most of the research in warehousing is related
  • 14. to automated storage systems (AS/RS systems) and little research has been done discussing conventional warehouses (e.g. with manual picking). Since stack- ing in the store is done by store clerks, one needs to take into account their work pace in the model too. Only few researchers have reported on the differ- ence in work pace in a warehouse environment (see e.g., Bartholdi and Eisenstein, 1996; Bartholdi et al., 2001). 2.3. The derivation of a formula for the shelf stacking time in stores Most SKUs follow the filling regime Unit, so it is expected that the time needed for filling depends on the number of CUs. Other activities like grab and unpack a CP or travel to and from the shelf location, depend on the number of CPs filled. Finally, preparing the shelves and searching are done only once for each SKU, independent of the number of CPs or CUs. The insights of the stacking process indicate that the number of CU and the number of CP are expected to have an influence on the total stacking ARTICLE IN PRESS S. van Zelst et al. / Int. J. Production Economics 121 (2009) 620–632624 time (TST). The dependent variable is the TST expressed in seconds. The explanatory variables are hypothesized to have the following influence on the TST:
  • 15. 1. The higher the number of CUs to be filled (CU), the higher the TST will be. An increase in the number of CU stacked increases the time needed to put the individual CUs on the shelf, resulting in a higher TST. 2. The higher the number of CPs, the higher the TST will be. More CPs imply more time needed for activities like grab and unpack a case pack or travel to and from the shelf location, thus leading to higher TST. The basic starting equation is then as follows: TST ¼ aþbCUþwCP: Rewriting this specification by dividing the TST by the number of CUs filled (CU) and making use of the fact that CU ¼ CP Q, where Q stands for the case pack size, results in the following revised model: TST CU ¼ a CU þbþw CP CU
  • 16. ) TST CU ¼ bþa 1 CP Q þw 1 Q . It is important to be aware of differences in working pace of store clerks when interpreting the data, i.e. not every employee works equally fast. Consequently, n�1 dummies for store clerks are added, denoted as DWi, (i ¼ 1, y, n�1, with n the number of store clerks considered) and DWi ¼ 1 if store clerk i is selected and zero otherwise. It is expected that the stacking regimes Tray and Loose will have a different effect than the filling regime Unit. Consequently, two extra dummies are added for the filling regime Tray (DT) and the filling regime Loose (DL) which leads to the following general model (with e the error term): TST CU ¼ bþa
  • 17. 1 CP Q þw 1 Q þdDT þ gDL þ Xn i¼1 Zi DWi þ �. Do note that the resulting model for the TST per CU is non-linear in the number of CUs and in the case pack size. This is in contrast to most literature where it is assumed that handling activi- ties are a constant and linear rate in the number of CUs. Ketzenberg et al. (2000) and Cachon (2001) describe models to optimize the replenishment decisions in the absence of a backroom and assuming handling costs that are linear with the number of CUs. This may be explained by the type of store they are considering. In general three basic store types can be distinguished: stores which receive crates composed of multiple SKUs, where each SKU is less than a case pack size (like dense retail outlets); stores which receive CPs and stack CUs; and stores which receive and stack CPs (like discounters). This research is based on the second type of stores, resulting in nonlinear shelf stacking cost, effectively focusing on a different type of store
  • 18. than those studied by Ketzenberg et al. (2000) and Cachon (2001). 3. Research methodology 3.1. Experimental design The research in this paper focuses on the stacking process for which data is collected. The data is collected by means of a motion and time study, which is defined by Barnes (1968) as: ‘‘the systema- tic study of work systems with the purposes of (1) developing the preferred system and method— usually the one with the lowest cost; (2) standardiz- ing this system and method; (3) determining the time required by a qualified and properly trained person working at a normal pace to do a specific task or operation; and (4) assisting in training the worker in the preferred method’’. The two main parts in this definition are motion study (or methods design) and time study (or work measurement). The first part is for finding the preferred method of doing work, that is, the ideal method or the one nearest to it. The second part is for determining the standard time to perform a specific task. Besides determining a certain normal time required for a task, time studies are done to detect work method improvements. In such a way, one can analyze a given process to eliminate or reduce ineffective movements, and facilitate and speed up effective movements. Through a motion study, the work is performed more easily and the rate of output is increased. In the experiment, for each SKU the time needed by a store clerk for stacking the items on the shelf is
  • 19. measured for a delivery (i.e. an order line in the store). In the zone stacking process, each order line consists of taking a case pack from a container, ARTICLE IN PRESS S. van Zelst et al. / Int. J. Production Economics 121 (2009) 620–632 625 unpacking the case pack and putting the CUs on the shelf at the assigned location. As timing an entire operation as one element is seldom satis- factory, the TST for an order line has been separated into different sub-activities. The division should be such that the elements are as short as can be accurately timed and that constant elements can be separated from the variable elements (Barnes, 1968). The TST is divided into the following sub- activities: � grab and unpack the case pack; � search for the assigned location on the shelf; � travel to the shelf; � check the shelf life of the inventory on the shelf;
  • 20. � prepare the location on shelf for stacking; � put the new inventory on the shelf; � put the old inventory back on the shelf; and � 44% 21% 11% 10% 8% 3% 2% Stack new inventory Grab and unpack case
  • 21. pack Dispose waste Travel Prepare the shelf Search Stack old inventory A c ti v it y dispose the waste. One more sub-activity has been distinguished, which is not part of TST, called ‘other activities’ to which all time was registered spent by the store clerks for activities which were not directly related to a specific order-line (like helping a customer). Since Saghir and Jönson (2001) mention the lack of standards and definitions on the handling (sub-)activities in a store, Appendix A contains the definitions which have been used in this research project. 3.2. Data collection Empirical data on the stacking process in two
  • 22. grocery retail companies is collected. In four stores (two of each retail company) employees were followed while stacking the shelves. During the data collection period, the stores were not allowed to change their current operations and were asked to let the most qualified and properly trained qualified personnel do the shelf stacking. Moreover, the days were carefully selected such that the period of measurement did not include any periods of expected demand peaks/drops (e.g., no holidays). The data were gathered for product groups, which meet the following criteria (criteria 1–4 are chosen to enable the investigation of the potential impact of the drivers which are included in the TST-equation in Section 2.3): 0% 20% 40% 60% % of stacking process' time 1. Fig. 3. Distribution of the time of the stacking process. The product groups should contain both fast- and slow movers; 2. The product groups preferably should contain SKUs from all three filling regimes (Tray, Loose, and Unit); 3. The product groups should contain different case pack sizes; 4. The product groups should contain SKUs for which sufficient shelf space is available to
  • 23. accommodate more than one case pack in a delivery (see also Broekmeulen et al., 2006). 5. All selected product groups should contain items that are comparable in terms of the shelf stacking process and productivity. For this reason, we did not consider product groups such as soft drinks, beers as well as dairy products. The store clerks are followed during the shelf stacking with a camcorder. Advantages of using a camcorder are that any short cyclical activities can be measured, the stacking process can easily be reviewed and different aggregation levels can be looked at. After the recording process, the TST per order line was registered using a computerized time registration tool, resulting in an extensive database. 4. Analysis and results Fig. 3 shows the empirical distribution of the TST in the stores. In the zone stacking process at the stores, putting the items on the shelves (‘Stack new inventory’) is the most important activity (for descriptive statistics on the different variables, refer to Appendix B). When comparing Figs. 2 and 3, a difference between the travel time for order picking in a warehouse and the travel time for zone stacking in a store is observed. The first reason is that the typical
  • 24. ARTICLE IN PRESS S. van Zelst et al. / Int. J. Production Economics 121 (2009) 620–632626 distribution of an order picker’s time as given in Fig. 2 is not based on the zone picking strategy but on the single order picking strategy in a warehouse. In the zone picking strategy, travel time is reduced at the expense of increased sorting, which is not included in Fig. 2. The second reason is that the data collection was restricted to the movements within the aisle, which can directly be attributed to the stacking process of an order line. The time needed to bring the container to the right aisle is not part of the travel time in our TST model and has therefore not been measured, i.e., only the time needed for traveling between the container and the shelf is registered. The general model is analyzed using regression analysis. The effect of the work pace of a store clerk is compared with the median store clerk in the data set, which was store clerk 8. Consequently, 8 dummies DWi for the remaining store clerks are added. The results of the Ordinary Least Squares estimation are shown in Table 1. All relevant collinearity tests (e.g. correlation coefficients, var- iance inflation factors) performed indicated no problems with regards to multicollinearity for the estimated model. The F-statistic indicates that the model is valid. Almost 40% of the TST per CU for each order line is explained with this model. Table 1 confirms the a priori expectations: the signs of all coefficients
  • 25. are as expected. Looking at the standardized Table 1 Estimation results TST/CU model Explanatory variable Coefficient t-statistic Standardized coefficient Constant 1.758 15.613** 1/(CP Q) 11.126 8.724** .275 1/Q 10.464 8.767** .273 DT �0.454 �4.074** �.080 DL �1.805 �5.262** �.097 DW1 �.562 �4.372** �.094 DW2 �.292 �0.996 �.018 DW3 2.800 11.145** .211 DW4 �.321 �2.129* �.046 DW5 .143 .971 .020 DW6 .328 3.199** .077 DW7 1.252 7.803** .160
  • 26. DW9 �.091 �.308 �.006 R2a .379 N 1922 *Significant at 5% and; **significant at 1%. coefficients one can see that most of the explanatory power comes from the variables 1/(CP Q) and 1/Q. The filling regimes Tray and Loose are faster than the filling regime Unit. The filling regime Tray reduces the TST per CU with 0.454 s per CU (1.805 s per CU for the filling regime Loose). The TST per CU is equal to 1.758 s per CU (see constant term in the table). Looking at the different store clerks, Store clerk 1 appears to be the fastest as he stacks on average 0.562 s faster per CU. Although some store clerk dummies are not significant the group of the dummies related to the store clerks is significant as a whole (as confirmed by an F-test; see Gujarati, 1995). An alternative model specification where product specific characteristics were included to test the effect of product heterogeneity on the TST per CU did not improve the specification. Product hetero- geneity was tested by adding physical volume of an SKU (and its interactions with the other variables). Estimation results indicated that physical volume and the interaction variables were highly insignif- icant indicating that product heterogeneity did not have a proven influence based on this data set. Moreover, alternative specifications (e.g. multipli- cative models and logarithmic functions of the variables) have been tested extensively, but they did
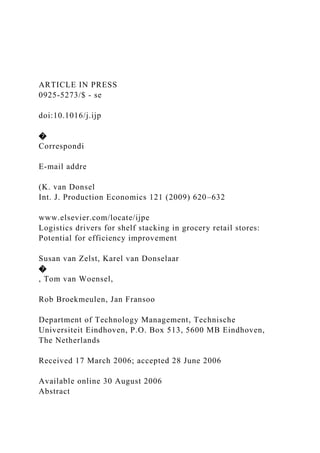
  • 27. not improve the results. Analysis of the other activity revealed that worker 3 was significantly more disturbed by customers than the other workers explaining part of the reduced efficiency of worker 3 (i.e. due to the startup effect after an interruption). The specification is used to quantify the effect of (1) increasing the case pack size; (2) increasing the number of case packs ordered; (3) changing the filling regime. For example, focusing on the median store clerk 8 (i.e. all dummy variables for the store clerks are thus zero) and looking only at the filling 0 5 10 15 20 25 0 2 4 6 8 10 12 14 16 18 20 22 24 Q T S T /C U . Unit CP=1
  • 28. Unit CP=2 Fig. 4. Influence of case pack size and number of case packs on total stacking time per CU [s/CU]. ARTICLE IN PRESS S. van Zelst et al. / Int. J. Production Economics 121 (2009) 620–632 627 regime Unit (i.e. DT ¼ 0 and DL ¼ 0), the effect of an increase in the number of CPs ordered and the CP size can be evaluated (Fig. 4). It can be seen that the TST in seconds per CU decreases if the CP size increases. CP sizes typically occur around the following three values: 6, 12, and 24 CUs. This analysis advocates using the largest possible CP size for a SKU if sufficient shelf space is available. Alternatively, it helps to recognize the impact on handling efficiency if for any other reason (e.g. reduced risk of obsolescence or perishability), it is decided to decrease the CP size. Table 2 shows the effect of increasing the CP size from 6CU to 12CU and from 12CU to 24CU for the three different filling regimes and for each of the store clerks (Wi denotes DWi ¼ 1 for store clerk i and DWi ¼ 0 for all others). On average, when stacking in units the time gain is 28%, stacking in trays results in an efficiency gain of 31% and Table 2 Potential gains on total stacking time per CU [s/CU] when
  • 29. increasing the case pack size Unit (%) Tray (%) Loose (%) 6–12CU 12–24CU 6–12CU 12–24CU 6–12CU 12–24CU W1 37.53 30.03 41.45 35.40 60.19 75.58 W2 35.53 27.55 39.02 32.00 55.20 61.61 W3 22.06 14.15 23.36 15.24 28.33 19.76 W4 35.73 27.80 39.27 32.33 55.70 62.86 W5 32.72 24.31 35.66 27.71 48.70 47.47 W6 31.65 23.15 34.40 26.22 46.38 43.25 W7 27.23 18.71 29.23 20.66 37.46 29.94 W8 33.59 25.29 36.70 28.99 50.66 51.34 W9 34.17 25.95 37.39 29.86 51.99 54.15 Average 32.24 24.11 35.17 27.60 48.29 49.55 Table 3 Potential gains on total stacking time per CU [s/CU] when stacking tw Unit (%) Tray (%) Q ¼ 6 Q ¼ 12 Q ¼ 24 Q ¼ 6 W1 19.34 15.48 11.06 21.36
  • 30. W2 18.31 14.20 9.80 20.11 W3 11.37 7.29 4.25 12.04 W4 18.41 14.33 9.92 20.24 W5 16.86 12.53 8.28 18.38 W6 16.31 11.93 7.76 17.73 W7 14.03 9.64 5.93 15.07 W8 17.31 13.03 8.72 18.91 W9 17.61 13.37 9.03 19.27 Average 16.62 12.42 8.31 18.12 stacking in Loose gives a 49% time reduction when the CP size is increased. A second observation involves the number of CPs ordered: the more CPs per order line, the higher the time gains, suggesting that more CPs per order line is more efficient. Note that increased casepack sizes or higher number of casepacks per orderline will result in higher inventories resulting in a need for sufficient shelf space. Therefore a trade-off has to be made between the shelf stacking costs and inventory holding costs. In Broekmeulen et al. (2006) it is shown that for a large part of the assortment excess shelf space is available to enable higher inventories in the store without the need to allocate more facings to the items. Moreover, Fig. 1 showed that inventory holding costs are small compared to handling costs for non-perishables in
  • 31. retail stores. Table 3 shows for each worker the gains that can be achieved when stacking two CPs rather than one CP for the same SKU. As can be seen from the table, significant gains can be realized when products are not ordered with only one CP at the time, but with 2 CPs per order line. Depending upon the fill regime the average gains are 12% (Unit), 14% (Tray) and 26% (Loose). The reason these gains are smaller than the gains from increased casepack sizes is visible in the equation for the total stacking time per CU at the end of paragraph 2: the casepack size Q influences two terms of this equation and CP only influences one of these terms. In other words: if the casepack size Q is changed, not only the number of orderlines change, but also the number of casepacks per year. The last observation made is that the filling regime has a clear influence on the gains that can be o case packs instead of one case pack Loose (%) Q ¼ 12 Q ¼ 24 Q ¼ 6 Q ¼ 12 Q ¼ 24 18.24 14.12 31.02 38.95 79.77 16.49 12.13 28.45 31.75 41.35 7.85 4.63 14.60 10.18 6.35 16.66 12.31 28.70 32.39 43.60 14.28 9.88 25.10 24.46 23.28
  • 32. 13.51 9.16 23.90 22.29 19.63 10.64 6.71 19.30 15.43 11.01 14.94 10.52 26.11 26.46 27.19 15.39 10.97 26.79 27.91 30.44 14.22 10.05 24.88 25.54 31.40 ARTICLE IN PRESS Table 4 Potential gains on total stacking time per CU [s/CU] when changing the filling regime from units to tray and tray to loose U-T (%) T-L (%) Q ¼ 6 Q ¼ 12 Q ¼ 24 Q ¼ 6 Q ¼ 12 Q ¼ 24 W1 9.47 15.16 21.66 31.13 53.16 82.30 W2 8.96 13.90 19.19 29.30 48.06 70.67 W3 5.57 7.14 8.32 17.54 22.89 27.00 W4 9.02 14.03 19.43 29.49 48.56 71.76 W5 8.26 12.27 16.21 26.78 41.62 57.57 W6 7.99 11.69 15.21 25.83 39.37 53.37
  • 33. W7 6.87 9.44 11.61 21.95 31.02 39.10 W8 8.48 12.76 17.08 27.56 43.54 61.31 W9 8.62 13.10 17.69 28.08 44.85 63.95 Average 8.14 12.17 16.27 26.41 41.45 58.56 Table 5 Overview of the efficiency gains achieved Increase case pack size (%) Increase number of case packs (%) Filling regime Unit 28 12 Tray 31 14 12% (U-T) Loose 49 26 42% (T-L)
  • 34. S. van Zelst et al. / Int. J. Production Economics 121 (2009) 620–632628 achieved: The filling regimes Tray and Loose are more favorable. Moreover, store clerks that are faster than the median worker have larger gains when using the filling regime Loose. These results can partially be derived from the above tables; next to this, Table 4 shows the efficiency gains for different CP sizes if the filling regime changes from Unit to Tray (U-T) and from Tray to Loose (T-L). On average, the filling regime Tray is 12% faster than Unit and the filling regime Loose is on average 42% faster. 5. Discussion and managerial implications Using the specification and the results for the empirical data obtained, important managerial in- sights can be obtained with regards to the effect of (1) increasing the CP size; (2) increasing the number of CPs per order line; (3) changing the filling regime. Table 5 summarizes the main findings from the previous section. Based on this table, the first step, which contributes the most to an efficiency gain, is to set the filling regime to Tray or Loose for as many SKUs as possible. This strategy needs an additional amount of shelf space needed compared to Unit or Tray which might not be available in stores where usually shelf space in the breadth is scarce and expensive. Next to this logistical constraint, the marketing department might perceive the filling regimes Tray and/or Loose not suitable for the store format. Tang et al. (2001) analyze the different price formats a retail chain can follow: they consider the
  • 35. whole continuum from Every Day Low Price (discount stores, e.g. Wal-Mart) to HI-LO or Promotional Pricing (e.g. Ahold formats such as Giant). Changing the filling regime to Tray or Loose might imply that the customers perceive the retail format as a discount store rather than a high-end service oriented store. As such, marketing consid- erations need to be taken into account too when the presentation of the assortment in the store is changed (Campo et al., 2000). A second way of gaining efficiency in shelf stacking, is to increase all CP sizes to the largest possible size (e.g. from 6 CUs to 12 CUs or from 12 CUs to 24 CUs). In practice, some retailers have already recognized the possible gains especially with regards to their private label products. However, for the branded products the manufacturer decides upon the CP size. Studies show that also brand manufacturers (e.g. Procter and Gamble, Nestlé, etc.) are investigating the consequences of different CP sizes and different packages in the retail supply chain (Saghir and Jönson, 2001). Note that there is a trend observed to reduce the CP sizes (see e.g. Ketzenberg et al., 2000). The above results still apply and then can be used to see how much shelf stacking efficiency is lost in the store due to the reduced CP size. The third and last option involves the store ordering policy: increase the number of CPs per order line as much as possible. Van Donselaar (1990) and Whybark and Yang (1996) showed that in a 2-echelon distribution system locating most of the inventory close to the customer is the best choice for companies that must fill customer demand from
  • 36. inventory. Putting more inventory on the shelves however implies that there should be enough space to accommodate for this extra inventory. However, shelf space is limited in the breadth, but Broekmeu- len et al. (2006) showed that there is a significant amount of unused space available in the back of the shelf (behind the products), which is called Excess ARTICLE IN PRESS S. van Zelst et al. / Int. J. Production Economics 121 (2009) 620–632 629 Shelf Space. Excess Shelf Space is defined as the retail space that is not required to carry out the current operations with respect to customer service and costs. The available space on the shelf is shown to be strongly influenced by the physical dimensions of the product, the CP size, and the shelf dimen- sions. This observation advocates stacking multiple CPs of one product at the same time instead of stacking one CP at multiple times for these products where enough Excess Shelf Space is available. This can be achieved by consolidating replenishment orders (see Van Donselaar et al., 2006a, b). Finally, it has to be noted that the effect of the worker should not be neglected: fillers who work faster have higher efficiency gains than slower workers. For example, focus on the slowest worker (number 3), he is on average already 2.8 s per CU slower than the median worker who typically spends only 3–5 s on shelf stacking per CU. This result suggests that worker training is an important aspect in order to get the full benefit from the different actions that can be taken. Next to this, it was also
  • 37. observed that due to interruptions of customers in the store, the worker can also slow down in his stacking time. It might thus be worthwhile to evaluate whether it is worthwhile stacking after opening hours. According to Saghir and Jönson (2001), every second reduction in the total handling time would represent a reduction of five million euro (or 6 million dollar) in the Swedish grocery industry. Since handling costs in the 2 retail chains studied in this paper are around 50 million euro (or 60 million dollar) per year, every reduction in handling time would lead to a substantial increase in yearly profits for these two companies. This indicates that a lot of costs can be reduced by following the above recommendations with regards to the efficiency in handling. 6. Conclusions It is argued that when store-handling costs have an important share of the retail supply chain operations costs, it is important to know the cost drivers. A conceptual model for shelf stacking in stores was derived using the analogy based on order picking models for warehouses. It was shown that the presented model for the stacking time was, unlike reported in the literature so far, non-linear in CUs. By means of a motion and time study, data was collected in four grocery stores from two different retail companies. Regression models re- vealed the impact of the most important drivers for shelf stacking efficiency, measured by the TST per CU. The main results of the model are: (1) increasing the CP size results in an average
  • 38. efficiency gain of 24–49%; (2) stacking multiple CPs of one product at the same time instead of stacking one CP at multiple times, results in an average gain between 8% and 31% in TST per CU; (3) the filling regime has a significant effect on the stacking time (12–42%); (4) Increased training, experience and/or motivation may help to improve the working pace of the employees. Based on the presented results both retail chains have decided to structurally change their current operations. Future research involves extending the currently used reorder policies in the retail companies to take into account the handling efficiency with the replenishment. Usually, the underlying logic is based on a (R, s, nQ)-reorder policy with a dynamic reorder level s. The reorder level s is based on a demand forecast for the coming L+R days (L+R being the sum of the lead time and the review period). The above analysis shows the need for an adapted inventory replenishment rule taking into account the handling aspects. This implies that for the majority of the items the new replenishment logic should be: whenever a replenishment can no longer be postponed, order as many CPs as can be added to the existing inventory on the shelves. Future research is also needed to analyze the impact on handling of different types of packaging materi- al, different shelf maintenance strategies (such as ‘mirroring’) as well as different levels of inventory just before stacking the shelves. Moreover, it is expected that larger CPs also reduce the cost of packaging material and the costs of waste. Increased number of CPs per order line reduces the ordering and delivery frequency of a product, which also may lead to lower ordering costs in the store and to
  • 39. lower picking costs in the retailers’ warehouse. Appendix A The definitions which have been used in this research project are given in Table A1. Appendix B For descriptive statistics on the different variables see Table B1. ARTICLE IN PRESS Table A1 Sub-activity Starting/ending point of sub-activity Grab/open case pack (G) Start The filler stands in front of the rolling container and reaches for a case pack End The filler prepares to walk away from the rolling container (case pack is or is not opened) or Start The filler has arrived at the shelf location and starts opening the case pack End The filler is ready with opening the case pack and an other sub-activity starts Search (S) Start The filler starts with checking the product and he/she lookes for the right shelf location End The filler sees the right shelf location and prepares to
  • 40. approach it (walk) Walk (W) Start The filler prepares to walk away from the rolling container or walks after searching the right shelf location End The filler stands still in front of the shelves and Start The filler prepares to walk away from the shelf location or waste disposal place, to the rolling container End The filler stands in front of the rolling container and reaches for a case pack Prepare the shelves/check ‘best before’ date (P) Start The filler reaches for the old inventory on the shelves and start to check the ‘best before’ date (if needed) End The filler is ready with preparing the shelves. This means that old inventory is straightened or is removed from the shelves Fill new inventory (Fn) Start The filler reaches for the new inventory in the case pack End The filler reaches for the old inventory or grabs the empty box or plastic
  • 41. Fill old inventory (Fo) Start In case old inventory was removed from the shelves, the filler starts with putting old inventory back on the shelves End The filler is ready with putting old inventory back on the shelves en grabs the empty box or plastic Waste disposal (D) Start The filler holds an empty box (or plastic) and starts to flatten it (sometimes the box is preserved for customers) End The moment the filler prepares to leave the waste disposal place (a trolley or a place near the rolling container) Extra (E) Any activity not part of the first sub -activities, e.g. help a customer, customer is in the way, get or put away crate, process inventory remainder, organize labels, general cleaning, discuss with a colleague, take away waste, bring empty boxes for customers to check out area, get a new rolling container, take away misplaced products, repair a broken product, remove cord from rolling container, take a product to the kiosk, straighten separation plate Nota bene: *Grabbing and opening the case pack are taken
  • 42. together, because the individual activities were difficult to separate; **Walking does not include walking with the rolling container from the storage area to the right aisle or walking with the rolling container between the aisles. But it does include (in exceptional cases) walking with the rolling container when the rolling container is moved to bring certain case packs to the right shelf location (e.g. heavy products); ***It is possible that a filler performs multiple sub-activities at once, e.g. walking while opening the case pack, searching or disposing waste. When this took place, the following reasoning was used: if the walking time was significantly influenced by the attention focused on opening the case pack (or searching or waste disposal), the time for e.g. opening the case pack was measured as sub-activity ‘‘G’’, and the remaining time as sub-activity ‘‘W’’. If the walking time was not significantly influenced by one of these sub-activities, then the total time was measured as walking time (W). S. van Zelst et al. / Int. J. Production Economics 121 (2009) 620–632630 ARTICLE IN PRESS
  • 66. 2 0 8 1 4 S. van Zelst et al. / Int. J. Production Economics 121 (2009) 620–632 631 References Barnes, R.M., 1968. Motion and Time Study Design and Measurement of Work. Wiley, New York. Bartholdi, J., Eisenstein, D., 1996. Bucket brigades: A self- organizing order-picking system for a warehouse, working paper. Bartholdi, J., Eisenstein, D., Foley, R., 2001. Performance of bucket brigades when work is stochastic. Operations Research 49, 710–719. Bertrand, J.W.M., Fransoo, J.C., 2001. Operations management research methodologies using quantitative modeling. Inter- national Journal of Operations and Production Manage- ment 22, 241–264. Broekmeulen, R.A.C.M., 1998. Layout and operations manage-
  • 67. ment of distribution centers for perishables, Ph.D. Thesis, Eindhoven University of Technology. Broekmeulen, R., van Donselaar, K., Fransoo, J., van Woensel, T., 2006. The opportunity of excess shelf space in grocery retail store, under review. Cachon, G., 2001. Managing a retailer’s shelf space, inventory, and transportation. Manufacturing & Service Operations Management 3, 211–229. Campo, K., Gijsbrechts, E., Goossens, T., Verhetsel, A., 2000. The impact of location factors on the attractiveness and optimal space shares of product categories. International Journal of Research in Marketing 17, 255–279. Chain Store Age, 1963. Cifrino’s Space Yield Formula: A Breakthrough for Measuring Product Profit 39. Chain Store Age, 1965. Shelf allocation breakthrough 41, 77– 88. Corstjens, M., Doyle, P., 1981. A model for optimizing retail space allocations. Management Science 27 (7),
  • 68. 822–833. van Donselaar, K., 1990. Integral stock norms in divergent systems with lot-sizes. European Journal of Operational Research 45 (1), 70–85. van Donselaar, K., van Woensel, T., Broekmeulen, R., Fransoo, J., 2006a. Inventory control of perishables in supermarkets. International Journal of Production Economics, in press. van Donselaar, K., Gaur, V., van Woensel, T., Broekmeulen, R., Fransoo, J., 2006b. An empirical study of ordering behavior of retail stores, under review. Fleisch, E., Tellkamp, C., 2005. Inventory inaccuracy and supply chain performance: a simulation study of a retail supply chain. International Journal of Production Econom- ics 95 (3), 373–385. Frazelle, E.H., Apple Jr., J.M., 1994. Warehouse Operations. The Distribution Management Handbook, McGraw-Hill Inc., New York. Gaur, V., Fisher, M.L., Raman, A., 2005. An econometric
  • 69. analysis of inventory turnover performance in retail services. Management Science 51 (2), 181–194. Gujarati, D., 1995. Basic Econometrics. McGraw-Hill Health Professions Division, 849pp. Hwang, H., Choi, B., Lee, M., 2005. A model for shelf space allocation and inventory control considering location and inventory level effects on demand. International Journal of Production Economics 97 (2), 185–195. Ketzenberg, M., Metters, R., Vargas, V., 2000. Inventory policy for dense retail outlets. Journal of Operations Management 18, 303–316. ARTICLE IN PRESS S. van Zelst et al. / Int. J. Production Economics 121 (2009) 620–632632 Ketzenberg, M., Metters, R., Vargas, V., 2002. Quantifying the benefits of breaking bulk in retail operations. International Journal of Production Economics 80 (3), 249–263. Mitroff, I.I., Betz, F., Pondy, L.R., Sagasti, F., 1974. On
  • 70. managing science in the systems age: two schemas for the study of science as a whole systems phenomenon. Interfaces 4 (3), 46–58. Rouwenhorst, B., Reuter, B., Stockrahm, V., van Houtum, G.J., Mantel, R.J., Zijm, W.H.M., 2000. Warehouse design and control: framework and literature review. European Journal of Operational Research 122, 515–533. Saghir, M., Jönson, G., 2001. Packaging handling evaluation methods in the grocery retail industry. Packaging Technology and Science 14 (1), 21–29. Shah, J., Avittathur, B., 2006. The retailer multi-item in ventory problem with demand cannibalization and sub- stitution. International Journal of Production Economics, in press. Tang, C.S., Bell, D.R., Ho, T.-H., 2001. Store choice and shopping behavior, how price format works. California Management Review 43 (2), 56–74. Tompkins, J.A., White, J.A., Bozer, Y.A., Frazelle, E.H.,
  • 71. Tanchoco, J.M.A., Trevino, J., 2003. Facilities Planning, second ed. Wiley, New York. Urban, T.L., 1998. An inventory-theoretic approach to product assortment and shelf-space allocation. Journal of Retailing 74, 15–35. Wee, K.E., Dada, M., 2005. Optimal policies for transshipping inventory in a retail network. Management Science 51 (10), 1519–1533. Whybark, D.C., Yang, S., 1996. Positioning inventory in distribution systems. International Journal of Production Economics 45, 271–278. Logistics drivers for shelf stacking in grocery retail stores: Potential for efficiency improvementIntroductionConceptual modelHandling activities in warehousesStacking activities in storesThe derivation of a formula for the shelf stacking time in storesResearch methodologyExperimental designData collectionAnalysis and resultsDiscussion and managerial implicationsConclusionsReferences International Journal of Physical Distribution & Logistics Management Logistics Performance: Definition and Measurement Garland Chow Trevor D. Heaver Lennart E. Henriksson
  • 72. Article information: To cite this document: Garland Chow Trevor D. Heaver Lennart E. Henriksson, (1994),"Logistics Performance", International Journal of Physical Distribution & Logistics Management, Vol. 24 Iss 1 pp. 17 - 28 Permanent link to this document: http://dx.doi.org/10.1108/09600039410055981 Downloaded on: 23 November 2016, At: 21:42 (PT) References: this document contains references to 50 other documents. To copy this document: [email protected] The fulltext of this document has been downloaded 13871 times since 2006* Users who downloaded this article also downloaded: (2009),"Logistics performance measurement in the supply chain: a benchmark", Benchmarking: An International Journal, Vol. 16 Iss 6 pp. 785-798 http://dx.doi.org/10.1108/14635770911000114 (2001),"The relationship of logistics to supply chain management: developing a common industry definition", Industrial Management & Data Systems, Vol. 101 Iss 8 pp. 426-432 http://dx.doi.org/10.1108/02635570110406730 Access to this document was granted through an Emerald subscription provided by emerald-srm:585788 [] For Authors If you would like to write for this, or any other Emerald publication, then please use our Emerald for Authors service information about how to choose which publication to write for and submission guidelines are available for all. Please
  • 73. visit www.emeraldinsight.com/authors for more information. About Emerald www.emeraldinsight.com Emerald is a global publisher linking research and practice to the benefit of society. The company manages a portfolio of more than 290 journals and over 2,350 books and book series volumes, as well as providing an extensive range of online products and additional customer resources and services. Emerald is both COUNTER 4 and TRANSFER compliant. The organization is a partner of the Committee on Publication Ethics (COPE) and also works with Portico and the LOCKSS initiative for digital archive preservation. *Related content and download information correct at time of download.D ow nl oa de d by E ff at U ni ve rs
  • 74. ity A t 2 1: 42 2 3 N ov em be r 20 16 ( PT ) http://dx.doi.org/10.1108/09600039410055981 Introduction Logistics research may be defined as the systematic and objective search for, and analysis of, information relevant to the identification and solution of any problem in the field of logistics[1]. A great deal of logistics research is conducted around the premiss that a relationship exists between a particular course of action and logistics
  • 75. performance (or effectiveness). Unfortunately, drawing broad inferences from the work that has been done is frustrating because of the great variety of ways in which performance has been defined in the literature. The definition of performance is a challenge for researchers in any field of management because organizations have multiple and frequently conflicting goals[2]. Some define goals in terms of profits. Others may choose goals such as customer service or sales maximization. Also difficult are the tasks of selecting and developing adequate measures for the chosen definition. “Hard” measures (such as net income or accounting figures) and “soft” measures (such as customer satisfaction ratings) each have strengths and weaknesses associated with them. The purpose of this article is to examine the definition and measurement of performance in logistics research. We begin with a literature review which includes an examination of the various ways in which “performance” has been defined. Data collection methods, sources, and the measures that have been used are also identified. Next, potential sources of performance data are identified and discussed. Recommendations arising from the review complete the article. Literature Review The contents of five leading logistics journals between 1982 and 1992 (International Journal of Logistics Management, International Journal of Physical Distribution & Logistics Management and its predecessors, Journal of Business Logistics, Logistics and Transportation Review and Transportation Journal) were reviewed for studies addressing performance. A number of studies from other sources were selected for examination on an ad hoc basis.
  • 76. Summary of the Literature The literature may be divided into six categories. They are: (1) Conceptual works; (2) Performance definition; (3) Performance measurement; (4) “Leading edge” literature; (5) Performance as an outcome variable; (6) Mathematical/economic analyses. The first category is composed of three articles and three volumes. These conceptual works are listed and summarized briefly in Table I. Armitage studied how management accounting techniques could be used to improve productivity analysis in distribution operations[3], while Mentzer and Konrad reviewed performance measurement practices from an efficiency and effectiveness perspective[4]. Rhea and Shrock presented a framework for the development of measures of the effectiveness of distribution customer service programmes[5]. While some empirical work is reported in Byrne and Markham’s volume, a key contribution lies in its conceptual treatment of measurement issues, particularly performance indicators[6]. The volume by La Londe et al. focuses on customer service[7]. This excellent work includes an ambitious survey of shippers, carriers and warehouse executives, and provides several ideas relevant to measuring customer service performance. A
  • 77. 17LOGISTICS PERFORMANCE: DEFINITION AND MEASUREMENT Data collection methods, sources and the measures used are identified. Logistics Performance: Definition and Measurement International Journal of Physical Distribution & Logistics Management, Vol. 24 No. 1, 1994, pp. 17-28 © MCB University Press, 0960- 0035 Garland Chow, Trevor D. Heaver and Lennart E. Henriksson The authors gratefully acknowledge the financial support provided by the Social Sciences and Humanities Research Council of Canada (SSHRC). An earlier version of this article was presented at the 1993 International Logistics Congress in Toronto, Canada. D ow nl oa de d by
  • 79. particular contribution of the book lies in its emphasis upon the inter-temporal and multi-dimensional nature of customer service. The volume by the Nevem Working Group is a comprehensive description and application of “hard” performance indicators in the logistics setting[8]. A variety of empirical studies comprise the remaining categories. Tables II – VI list the studies by category, and identify the data source and collection method used, how performance is defined, and whether the measures used for performance are soft or hard. 18 IJPD & LM 24,1 Article/book Summary Armitage[3] Focuses on the use of management accounting techniques to measure (and improve) efficiency and effectiveness in distribution operations Mentzer and Konrad[4] Reviews measurement practices and suggests methods for improvement Rhea and Shrock[5] Defines “physical distribution effectiveness” and discusses some implications for measurement Byrne and Markham[6] Focus is on quality; a key value of this book lies in its treatment of performance indicators for various dimensions of logistics La Londe, Cooper and Noordewier[7] Focus on customer service and how it may be measured
  • 80. Nevem Working Group[8] Comprehensive review of performance indicators in logistics Table I. Conceptual Articles Data collection Article/book method Data source Measures Definition of performance/remarks Read and Miller[9] Mail survey Managers Soft Quality: (total customer satisfaction, on-time delivery, zero defects, employee awareness of quality importance, reduction of the cost of quality, best-in-class practices, human resource excellence, satisfaction of industry regulations, employee education, other) Harrington, Lambert Archival Firm Hard Vendor performance (criteria developed using and Christopher[10] brainstorming method): promised lead- time, lead- time variability, fill rate, discrepancies, total purchases Gassenheimer, Mail survey Executives Soft Logistical performance: length of promised order Sterling and cycle times for base-line/in-stock products, Robicheaux[11] manufacturer’s performance in meeting promised delivery dates, fill rate on base-line/in-stock items, advance notice on shipping delays, accuracy of manufacturer in forecasting and committing to estimated shipping dates on contract/project orders, manufacturer's
  • 81. adherence to special shipping instructions, accuracy in filling orders Cooper, Browne Personal European-based Soft Study focused upon performance indicators and and Peters[12] interviews companies found significant variation in logistics efficiency depending upon which performance indicators were used Table II. Empirical Studies: How Performance May Be Measured D ow nl oa de d by E ff at U ni ve rs ity
  • 82. A t 2 1: 42 2 3 N ov em be r 20 16 ( PT ) Four empirical studies focus primarily upon how performance could be measured: their content is summarized in Table II. Read and Miller conducted an exploratory study of quality in logistics, using a sample of firms on a consultant’s mailing list[9]. One of the most important findings of their study is “a clear gap between the importance given to the components of logistics quality, and the measures being used” (p. 36). Harrington et al. developed an interesting model for vendor
  • 83. performance evaluation in a logistics context[10]. A brainstorming method was used to identify the various dimensions of vendor performance, and to evaluate the priority that each deserved. The model was subsequently tested in a health-care setting. Gassenheimer et al. on the other hand, employed factor analysis to identify the dimensions of “performance”[11]. Their analysis revealed five key dimensions: “logistical”, “boundary personnel”, “product/product support” [sic], “flexibility and innovative” [sic] and “inventory assistance” (p. 20). A principal contribution of the paper by Cooper et al. lies in 19LOGISTICS PERFORMANCE: DEFINITION AND MEASUREMENT Data collection Article/book method Data source Measures Definition of performance/remarks Bowersox, Daugherty, Mail survey Firm Soft Common attributes index (performance Dröge, Rogers and and interview antecedents). Appendices include attempts to Wardlow[15] associate firm CAI measures with performance; results revealed few associations that were statistically significant Daugherty, Stank and Mail survey Firm Soft Service capabilities of firm (various logistics and Rogers[17] support services) Daugherty, Sabath and Mail survey Firm Soft Firm’s ability to accommodate special requests: Rogers[19] special service requests, programme support,
  • 84. customized service, modification while in logistics system Dröge and Mail survey Firm Soft Firm’s ability to accommodate product Germain[20] introduction, product phaseout, product recall and customization of service levels to specific markets or customers Germain[21] Mail survey Firm Soft Ability of firm’s logistics system to accommodate: supply disruption, production schedule changes, in-stream product modification, services level customization, incentive programmes, special customer requests, product introduction, product phase-out, product recall and computer breakdown Table IV. Empirical Performance Studies: “Leading-edge” Literature Data collection Article/book method Data source Measures Definition of performance/remarks Clarke[13] Mail survey Executives Soft Productivity (study sought to determine which measures used) Yavas, Luqmani Mail survey Managers Soft Efficiency (study provides data on efficiency and Quraeshi[14] measure usage, and attempts to correlate this with a measure of purchasing sophistication
  • 85. developed by the authors) Table III. Empirical Studies :Which Performance Measures Are Used D ow nl oa de d by E ff at U ni ve rs ity A t 2 1: 42 2 3
  • 86. N ov em be r 20 16 ( PT ) its use of performance indicators for the purpose of measuring logistics efficiency and effectiveness[12]. Two studies, summarized in Table III, report the results of surveys which sought to identify the measures used by decision-makers in assessing logistics performance. Clarke reports how physical distribution productivity was measured by South Carolina distribution executives[13]. Yavas et al. focused a similar study on the purchasing area. They collected data on the usage of efficiency measures in Saudi Arabian firms and found that utilization of measures was associated with purchasing sophistication[14]. Given the different orientations of the two studies, the findings are understandably quite dissimilar. In Leading-edge Logistics, Bowersox and his colleagues distinguish between emergent, norm and leading-edge
  • 87. organizations on the basis of common attributes index (CAI) scores [15]. However, few significant relationships were reported between CAI scores and publicly-available financial performance measures [15, Appendix E, 16]. Four performance-relevant studies have been found which build on the Leading-edge material. A summary of these studies (along with the original volume) is presented in Table IV. An important limitation of the CAI approach is that it measures potential, that is, services offered rather than actual logistics performance. For example, Daugherty et al. suggest that the ability of the logistics system to accommodate the customization of service levels to specific markets or customers is an important dimension of performance[17]. They measured performance by asking respondents to identify which “expanded services” were offered to customers (e.g. customer billing/collection; freight bill audit and payment and so on). The authors conclude that “firms wishing to improve logistical performance are well advised to concentrate on formalizing selected processes” (p. 57). Because the dependent variable is potential rather than actual service delivery, this conclusion is best regarded as tentative and in need of further empirical validation. The limitations of outcome variables which may have little or no direct linkage with actual performance are well- known[18, p. 543]. For, as Cooper and his colleagues noted, “there can be a large gulf between what companies say they do and what they actually do” [12, p. 30]. Daugherty et al. found that firms that could be distinguished as “leading edge” by virtue of several structural characteristics performed better than others[19]. The authors defined performance as “ease of accommodating special requests”, such as sales and
  • 88. marketing incentive programmes. Again, it is potential, 20 IJPD & LM 24,1 Data collection Article/book method Data source Measures Definition of performance/remarks Fawcett and Closs[22]; Mail survey Managers Soft “Competitive position” of firm or profit centre: Fawcett[23] (rated own five perceptual items rating from nontraditional organization’s measures of cost and customer service to more performance) traditional measure of growth in sales and growth in return on assets Perry[24] Site visits, Managers Soft “Operating performance” of specific logistics questionnaires (rated own dimensions: vendor relations, material and interviews firm’s acquisition lead-time, purchasing method, performance) material invoice, transport management/ comparison between JIT and non-JIT firms Rhea and Mail survey Key decision Soft “Distribution effectiveness”: adequacy, Shrock[25, 26] makers consistency, accuracy, timeliness, initiative, responsiveness Fawcett[28]; Mail survey Managers Soft A single logistics function, carrier performance:
  • 89. Fawcett and on-time performance, transit time, rates and Vellenga[29] tariffs, accuracy, equipment co-ordination, documentation, information, loss and damage Marr[30] Mail survey Executives Soft “Distribution service performance”/one-item performance measure Table V. Empirical Performance Studies: Performance as an Outcome Variable or Basis for Comparison D ow nl oa de d by E ff at U ni ve rs ity A
  • 90. t 2 1: 42 2 3 N ov em be r 20 16 ( PT ) not actual performance that is being measured. Similar outcome variables were used in Dröge and Germain’s study of the effects of formalization[20] and Germain’s study of the effects of customization and standardization[21]. A summary of the studies in which performance was either investigated as an outcome variable or used as a basis for comparison is provided in Table V. Three studies investigated variables associated with performance in a fairly direct fashion. Fawcett and Closs
  • 91. used a promising application of path analysis to demonstrate linkages between “perceived globalization”, “manufacturing”, “logistics”, and the outcome variable, “competitive position”[22]. In another study using the same database, Fawcett found that firms that emphasized logistics issues at a higher level in the early stages of the co-production decision outperformed their counterparts[23, p. 39]. In his study of firm behaviour and operating performance, Perry conducted a qualitative study utilizing site visits, questionnaires and interviews with managers. He found differences between just-in-time (JIT) and non-JIT firms in a number of performance- related areas: vendor relationships, material acquisition leadtimes, purchasing methods and materials inventories[24]. Rhea and Shrock utilized a combination of previous research and interviews to identify six key elements of logistics distribution effectiveness[25,26]. They found that significant differences exist between “effective” and “ineffective” organizations in the predicted direction. A strength of this study lies in its use of “customer” food broker managers to rate the performance of “seller” producers. While the methodology for collecting the data is quite defensible, a limitation arises from the fact that each respondent determined both the overall assessment of four firms as effective or ineffective, and then evaluated each one on the various elements. The likelihood for a consistency bias is consequently quite high[27]. Fawcett and Vellenga compared the performance of maquiladora and domestic transport operations[28,29]. The survey respondents were managers who rated the performance of transport firms with whom they dealt. The analysis revealed that transport service performance
  • 92. was less in the transnational operating environment. Marr found “management sophistication” to be somewhat helpful in predicting “distribution service performance”, although a limitation in his findings lies in the one-item measure used to measure “level of overall distribution service”[30]. Four studies used mathematical or economic models with hard performance measures, as summarized in Table VI. The papers by Clarke and Gourdin[31] and Kleinsorge et al.[32,33] used data envelopment analysis (DEA) to evaluate the efficiency of logistics practices. Essentially, DEA uses linear programming methods to measure efficient combinations of inputs and outputs for a set of decision-making units (DMUs) and provides relative performance ratings for all the DMUs in the data set[34]. Writers in logistics and other fields have pointed out that the advantages of DEA include the less restrictive requirement for data input in comparison to many other 21LOGISTICS PERFORMANCE: DEFINITION AND MEASUREMENT Data collection Article/book method Data source Measures Definition of performance/remarks Clarke and Archival Firm Hard DEA – efficiency/productivity (also included Gourdin[31] evaluation of DEA using questionnaire with soft measure) Kleinsorge, Schary Archival Firm Hard DEA – efficiency and Tanner[32, 33]
  • 93. Diewert and Smith[37] Archival Firm Hard Total factor productivity Gomes and Mentzer[38] Simulation Previous Hard Profitability: also examined order cycle time, research variance in order cycle time and order fill rate Table VI. Empirical Performance Studies: Mathematical/Economic Analyses Qualitative variables such as attitudes or perceptions can be included D ow nl oa de d by E ff at U ni ve rs
  • 94. ity A t 2 1: 42 2 3 N ov em be r 20 16 ( PT ) methods of quantitative analysis. In particular, qualitative variables such as attitudes or perceptions can be included, thereby allowing the injection of essential intangibles into the system analysis. DEA has the ability to isolate variables for measurement while still including the effects of interaction among both input and output variables[33, p. 39; 35, p. 529). This is in marked contrast to “conventional” performance indicator analyses which
  • 95. are only incomplete measures of performance[34]. Disadvantages of DEA include the frequent difficulty of obtaining data [36, p. 443]. It should also be noted that thus far, most applications of DEA have been in the public sector[36, p. 443]. The paper by Diewert and Smith is a promising attempt at applying total factor productivity measurement in a distribution setting[37]. Using data from a large appliance parts distributor in Western Canada, the authors conclude that large productivity gains were possible in the distribution sector of the economy thanks to the computer revolution, which allows a firm to track its purchases and sales of inventory items and to use the latest computer software to minimize inventory holding costs (p. 16). Finally, Gomes and Mentzer employ a simulation to explore the influence of JIT systems on distribution system performance[38]. They found that JIT systems in the physical distribution and materials management contexts were associated with significantly more favourable profit and service results in comparison to non-JIT systems. System-wide JIT, on the other hand, produced favourable service results, but unfavourable profit results (p. 47). Implications With the exception of the mathematical/economic studies, almost all of the empirical studies utilized soft measures for the outcome variable. Nevertheless, both soft and hard measures are associated with strengths and weaknesses (as a later section of this article discusses in detail). This limits a researcher’s ability to infer the existence of relationships between logistics performance and its antecedents. One limitation common to several of the studies is that
  • 96. the respondents appraised their own performance. This becomes a particular concern in cases where the performance dimension under consideration is better assessed by another source, such as the customer. Also, very few studies we reviewed adequately captured the multiplicity of goals that must be included in any meaningful evaluation of performance at either the logistics or firm level. To be sure, keeping a study within a feasible domain will often involve limiting the examination to one or more dimensions of “performance”. However, unsupported extrapolations of the findings of such studies to unmeasured dimensions are difficult to justify. For example, a researcher who finds a significant relationship between the utilization of total quality management programmes and customer satisfaction should indicate that the findings of the study do not necessarily generalize to dimensions of performance that were not included in the study. The predominance of the mail survey as a data collection method in the logistics studies reviewed raises some concern in light of its inherent limitations[39]. To their credit, however, most authors disclosed these limitations to one extent or another. A few offered especially coherent discussions of remedial or assessment measures that had been completed, such as those suggested by Lambert and Harrington[40]. The examination of these studies reveals that an immense variety of operational definitions and measures exists for logistics performance. This is the result of the varying interests of the researchers and the complexity of performance that have been alluded to earlier. Another source of the variety in performance measures is the domain to which the measure is relevant. Several of the
  • 97. studies measure performance at a logistics activity level (e.g. transport or warehousing). Other studies measure performance at the logistics function level and several attempt to measure the firm’s performance. None of these studies examines logistics performance in the context of supply chain management. This is significant. The supply chain comprises all companies that participate in transforming, selling and distributing the product from raw material to the final consumer. It has two implications for research in logistics performance. First, some research might be oriented towards measurement of supply chain management, that is, performance involving multiple organizations. Second, research oriented to members of a channel should recognize the relationship between channel structure and member functions. For example, distributors in the health-care supply chain are increasingly holding inventory and performing sorting functions traditionally performed by hospitals. This integration has resulted in lower inventory and handling costs in the whole supply chain, although specific members of the chain may exhibit higher inventory and sorting costs than might otherwise be expected. 22 IJPD & LM 24,1 Distributors in the health-care supply chain are increasingly holding inventoryDow nl oa de
  • 99. PT ) Unfortunately, the variety of performance measures make it difficult to draw broad inferences from the literature about the relationship between a given logistics practice and performance. Meta-analysis, or aggregating the findings of several studies[41], is frustrated by the use of diverse measures. Differences in findings between one study and another may be attributable solely to the measures used. Defining Logistics Performance Conceptually, logistics performance may be viewed as a subset of the larger notion of firm or organizational performance. The latter has attracted a large volume of diverse research over the years[2,35] and illustrates the futile nature of the search for the “one best way” of defining performance. For example, Gleason and Barnum chose to distinguish between effectiveness and efficiency. They defined effectiveness as “the extent to which an objective has been achieved”, while efficiency was defined as “the degree to which resources have been used economically”[42, p. 380]. Simply put, efficiency is “doing things right”, while effectiveness is “doing the right thing”[42, pp. 3,4]. Sink and his colleagues, on the other hand, defined seven dimensions in order to capture their conception of “what performance means”: they are effectiveness, efficiency, quality, productivity, quality of work life, innovation and profitability/budgetability[43, pp. 266-7]. Both of these examples have strengths and weaknesses. A principle strength of Gleason and Barnum’s work is its
  • 100. simplicity. This simplicity may be somewhat deceptive, however: a convincing case could be made about the importance of efficiency as one dimension of effectiveness. As for the dimensions identified by Sink and his colleagues, they are intriguing because they meet the need for a broad, comprehensive framework. However, this comes at the price of some overlap between the various dimensions, as the authors themselves infer[43,p. 268]. In particular, the distinction between performance and effectiveness is somewhat unclear. Given the lack of any universally-accepted definition for performance in the organizational literature, it should not be surprising that extant literature offers many ideas about the dimensions that ought to be incorporated into a conceptualization of “logistics performance”. One of the best examples is the framework presented by Rhea and Shrock, where physical distribution effectiveness is defined as “the extent to which distribution programmes satisfy customers”[5, p. 35]. They note, however, that other goals remain important under this definition: In taking this orientation, decision makers do not ignore the well-documented need to control costs. Rather, they incorporate this objective within a customer-oriented managerial philosophy in which it is believed that the long- run goal of profitability is achieved by providing customer need and want satisfaction[44; 5, p. 35]. The literature review provided by Rhea and Shrock suggests that care must be taken to incorporate multiple goals in defining performance. In order to begin the task of conceptualizing what the various dimensions of logistics effectiveness might look like, we identified a representative set of answers to the question, “what is
  • 101. logistics performance?” The results of this exercise are shown in Figure 1. Logistics performance may be defined as the extent to which goals such as those suggested in Figure 1 are achieved. Figure 1 incorporates various possible dimensions of performance in a single envelope to help highlight the numerous interdependencies and conflicts between the goals. For example, interdependency is likely to exist between employee satisfaction, the quality of customer service and profitability. A conflict would occur if a pay rise for employees were postponed to achieve a short- term financial improvement – a move which may inhibit the firm’s ability to attract and retain employees who are capable of delivering quality customer service to the benefit of long-run profits. Another example is that a firm may find it advantageous in the short run to make more extensive use of packaging in an environmentally- suboptimal way although it may face more stringent 23LOGISTICS PERFORMANCE: DEFINITION AND MEASUREMENT Cost-efficiency Profitability Social responsibility On-time delivery Sales growth Job security and
  • 102. working conditions Customer satisfaction Keeping promises Flexibility "Fair" prices for inputs Low loss and damage Product availability Figure 1. What Is Logistics Performance? Care must be taken to incorporate multiple goals… D ow nl oa de d by
  • 104. regulation, increased paper burden and compliance costs and reduced profits in the long run. Measuring Logistics Performance The preceding discussion argues that performance is multi-dimensional. No one measure will suffice for logistics performance. Instead, the objective for researchers and managers is to find a set of measures which collectively capture most, if not all, of the performance dimensions thought to be important, over both short- and long-term horizons. For example, in a presentation at the Tenth International Logistics Congress in Toronto, in June 1993, Mr D. Eggleton of Rank-Xerox described the criteria on which his performance is evaluated as employee satisfaction, customer satisfaction, and the company’s rate of return. Many dimensions of logistics performance lend themselves well to hard performance measures. A representative collection of these, along with key advantages and disadvantages, is shown in Table VII. Hard performance measures such as net income or order fill rate are typically impersonal, accurate and easy and inexpensive to collect. Measures such as net income, and accounting ratios such as return on investment (ROI) are useful ways of capturing profitability, and will often be easy and inexpensive to collect, particularly where logistics is treated as a profit centre. Profitability is a particularly useful goal because it directly reflects the goals of all of the organization’s internal constituent groups to one extent or another, although it may not be a good indicator of the viability of the firm in the long run.
  • 105. Cost accounting measures may also be useful, particularly in evaluating several dimensions of efficiency. The data are often highly accurate and, in many cases, available over long periods of time. However, these measures are not always comparable between one organization and another. Changes in accounting practices may even inhibit valid comparisons within the same organization over time. There are some difficulties which are common to both raw financial measures and cost accounting data. Because they are often considered confidential, many firms are reluctant to release information to outsiders. Also, in making comparisons between organizations or time periods, variations in standards or accounting methods are a frequent threat[45]. A particular problem to logistics researchers is that in many cases, the level of aggregation is so high that it is difficult to utilize for evaluating sub- functions of the firm. The use of input-output ratios (also known as productivity or performance indicators) is common in logistics, and has received extensive treatments in textbooks and other literature[8, 46]. Many goals lend themselves well to evaluation using these measures. For example, productivity may be measured utilizing ratios such as number of shipments per vehicle-mile, while a ratio such as percentage orders delivered on time will be helpful in evaluating the quality of service rendered. As the concern of society over environmental issues grows, some firms may find it useful to calculate ratios such as “tons of packaging used/total tonnage shipped”. Again, the limited ability of the researcher to gain access to these data because of their confidential nature is a potential disadvantage. Also, variations in definitions and data
  • 106. 24 IJPD & LM 24,1 Measure type Advantages/disadvantages Raw financial statistics (e.g. net income, Advantages: Often easy and inexpensive to collect, and is likely to be comparable gross sales) between organizations. Can capture several important dimensions of performance, often with impressive accuracy Cost statistics (e.g. transport cost, standard labour costs) Disadvantages: May not be comparable between one time interval and another. Accounting methods may limit comparability between organizations. Level of aggregation may be so large that it is difficult to assign responsibility. Firms may be unwilling to divulge information Input/output measures or “performance Advantages: Can be used to evaluate goal attainment in many areas, particularly indicators” (e.g. number of shipments/ efficiency and effectiveness vehicle hour) Quality measures (e.g. order cycle time) Disadvantages: Narrow focus upon individual performance indicators may easily cause faulty analysis or decision-making. Researchers may have trouble getting data. May be incomparable across organizations Table VII. Alternative “Hard” Measures for Logistics Performance D
  • 108. r 20 16 ( PT ) collection procedures will often make it difficult to compare performance indicators between one organization and another. For service measures such as order cycle time or lead time variability, the advantages and disadvantages are essentially the same as those of performance indicators. One limitation common to both is that there are many dimensions of performance which they cannot capture, particularly the extent to which customers are satisfied. The difficulty in capturing customer satisfaction is the underlying reason that hard measures should be supplemented with “soft”, perceptual ones. Although there are several dimensions of logistics performance which hard measures cannot capture in a meaningful way, customer satisfaction is perhaps the most critical. A set of soft measures, collected using techniques such as the mail survey, telephone interview, or similar method are needed. Besides their usefulness in identifying problems, soft measures may also be called for where available hard measures are not comparable between one organization and another because of differences in accounting standards or similar problems. These
  • 109. measures are subject to the limitations inherent in any self-report, such as consistency bias, and the social desirability problem[27,39]. The difficulties are especially serious for one-item measures[27]. Soft measures may also raise comparability problems. Suppose that a handful of manufacturers in the same industry report (on a scale of 1 to 5) how well their logistics function achieves on-time delivery goals. The responses may be difficult to interpret if (as will likely be the case), there is variation in the competitive strategy or goals of the firms. This may well influence what is reported by the respondent. As an example, consider two firms with an actual on-time delivery level of 80 per cent. Each firm’s manager is asked to rate performance. If Firm A’s goal is 100 per cent and Firm B’s goal is 80 per cent, it is likely that Firm A’s manager will provide a lower performance rating than Firm B’s. In other contexts, low scores on “quality of service” may reflect the presence of a cost-minimization strategy which are not meaningfully comparable to those of a firm seeking to differentiate itself by providing superior service. Soft measures are associated with a host of other limitations, the most notable being self-report defects[27] or other forms of bias[39]. An excellent way to improve the validity of soft measures may be found in Churchill’s paradigm for developing better measures of marketing constructs[47]. Essentially, the paradigm comprises a number of carefully-ordered steps by which literature searches, surveys and analysis procedures are linked together in a coherent and justified sequence. First, the domain of the construct is specified. Next, a sample of items is generated. Third, the measure is purified. Reliability and validity of the construct are
  • 110. then assessed. The Churchill paradigm has been employed by a handful of logistics scholars[22], with promising results. The discussion presented here suggests that although the optimal set of performance measures will depend on the purpose of the research, it will often include a collection of both hard and soft measures. One important criterion to consider in choosing the set is “representativeness”. That is, the set of measures should meaningfully capture those dimensions of performance in which the researcher is interested. The use of only one or two measures of performance is justified for the researcher whose study addresses only customer satisfaction or cost efficiency. However, findings from such studies should not be carelessly extrapolated to include the larger variable, logistics performance. Recommendations This article argues that defining and measuring performance in logistics is a difficult enterprise, for both researchers and managers. The literature review reveals the nature and limitations of the various designs and measures which have been used thus far and, along with subsequent sections, suggests that there are no “easy” ways to address the issues raised. In light of this review, we offer five recommendations which should help improve the quality of future research. More Efforts to Develop Performance Measures In the short run, we urge researchers to give more detailed information about how they have defined and measured performance, and about the limitations of their study and its findings. Inadequate reporting of the appropriate caveats serves only to mislead readers and frustrate logistical excellence.
  • 111. Special issues of logistics journals devoted to measurement and methodological issues would be most useful. Their leading role would be very likely to generate added interest in logistics research methodology among researchers and students. A more coherent picture of the various dimensions of performance would make it much 25LOGISTICS PERFORMANCE: DEFINITION AND MEASUREMENT Factor analysis will be an especially useful tool D ow nl oa de d by E ff at U ni ve rs
  • 112. ity A t 2 1: 42 2 3 N ov em be r 20 16 ( PT ) easier to address subsequent questions such as, “how” should each dimension be measured?”, and “who should provide data for each measurement?” Increased attention to the development of valid measures is warranted, particularly the soft ones which capture dimensions of performance which are otherwise left out.
  • 113. The encouraging results of the study by Gassenheimer and his colleagues, in which factor analysis is used, suggest that this will be an especially useful tool for developing valid perceptual or self-report scales[11]. As noted earlier, expanded use of the paradigm suggested by Churchill[47] is very likely to enhance the validity of studies that are conducted, and also facilitate aggregation and comparison among them. Encouragement of More Innovative Research Designs Studies in which more than one constituency provides data in evaluating performance should be encouraged[48]. Although “rate-your-own-company” studies have a legitimate place in research, they need to be supplemented by data from other constituent groups, especially customers. While we suspect that the mail survey will continue to be an important data-collection method, journal editors should encourage studies in which alternative methods are used. Also, in the short run, journal reviewers and editors should insist that submissions articulate and justify how performance has been defined, and describe the measures that have been used. In particular, questionnaires should be reproduced verbatim in an appendix, or an address provided where interested researchers may obtain a copy. In this way, a body of time-tested items can be built up in short order, meta- analyses are facilitated, and needless “re-invent the wheel” exercises are avoided. Quantitative techniques such as data envelopment analysis and total factor productivity both represent potentially valuable ways to evaluate economic performance, and are potentially important tools in logistics research. However, these should not be
  • 114. permitted to obscure the potential gains in knowledge that may be facilitated by qualitative studies, most notably the “case study” approach. One particular form of case study that has proven invaluable for many firms is the “logistics performance audit” in which a team systematically evaluates a firm’s logistics function. Development of Contingency Models of Logistics Performance Researchers might do well to explore contingency models of logistics performance[49,50]. To date, their utilization has been sparse, despite their intuitive appeal. Rather than the “one-best-way” paradigm which is common in so many discussions of logistics research, a contingency model would be based on the supposition that the fit between logistics organization and strategy and the organization’s environment, product line, production technology and size will influence performance outcome variables. The development and testing of such a model might well stimulate research on the question of the primacy of various performance dimensions. For example, the firm which has adopted a cost-minimization strategy may be better served by focusing on cost dimensions of performance than the firm which has chosen to differentiate itself on quality of service. While this assertion may have intuitive appeal, it has little in the way of empirical support thus far. Recognition of the Implications of Supply Chain Management The shift to supply chain management has two implications for logistics performance. First, the measurement of performance must recognize the particular role of an organization in a supply chain. Comparable stages in different channels may be
  • 115. associated with different functions. Second, consideration should be given to assessing the performance of the supply chain, not just that of individual participants. More Bridge-building between Theory and Practice Is Needed Researchers can and should play a role in making practitioners more familiar with the importance, nature and limitations of research. Practitioners, on the other hand, can offer needed insights into the types of logistics issues that merit greater study and thought, and more generally, what our overall “focus” should be. Taking advantage of whatever opportunities we receive to engage in dialogue will help ensure that the research we conduct fulfils pragmatic purposes in the long run. References 1. Chow, G. and Henriksson, L. E., A Critique of Survey Research in Logistics, Working Paper 93-TRA-009, University of British Columbia, Faculty of Commerce and Business Administration, 1993. 2. Hall, R., Organizations: Structures, Processes and Outcomes, Prentice-Hall, New York and London, 1991, p. 267. 26 IJPD & LM 24,1 Quantitative techniques are potentially important in logistics research D ow