SlideShare a Scribd company logo
1 of 16
Download to read offline
Trends in Educational Disadvantage in Dutch Elementary School
Dr Geert Driessen
ITS, Radboud University Nijmegen, the Netherlands
g.driessen@its.ru.nl
www.geertdriessen.nl
Paper presented at the Annual Meeting of AERA
Vancouver, BC, Canada, April 13-17, 2012
Invited session
The Cohort Study on Educational Careers in Primary en Secondary Education COOL5-18
Sponsored by
The Dutch Program Council for Education Research (PROO),
The Netherlands Organization for Scientific Research (NWO)
Geert Driessen Trends in Educational Disadvantage in Dutch School 2
Trends in Educational Disadvantage in Dutch Elementary School
Dr Geert Driessen
ITS, Radboud University Nijmegen, the Netherlands
1. Background
1.1 Current policy on educational disadvantage
For almost half a century now, policy has existed in the Netherlands to improve the educational
chances of children from situations of disadvantage (Driessen, 2012). This policy has gradually
changed with regard to predominantly organization and funding but also new policy domains, themes,
objectives and target groups have been defined.
In the 1970s, following the example of the USA, compensation programs were developed and
implemented to help working class children in a number of large cities in the Netherlands. This local
policy was later expanded to become national policy and, in addition to this policy, policy was
developed to improve the educational opportunities of minority children. Half way through the 1980s,
these two lines of policy were integrated into a single educational disadvantage policy. Initially, this
policy was steered by the Ministry of Education. It was later decentralized to the local authorities and
school administrations. Specific target groups were identified within the groups of minority and non-
minority students but, under the influence of political-societal developments, the ethnic component
was omitted in 2006 (Driessen & Merry, 2011; Vasta, 2007). Since that time, no distinction has been
made between minority versus non-minority disadvantaged children. And over the years, the focus of
policy has shifted from the reduction of educational disadvantage to the prevention of such
disadvantage. Increased emphasis is being placed on the preschool and early phases of education and
thus the prevention of delays among children in play and preschool groups.
The core of the policy involves the allocation of extra financial resources to elementary schools
with a given percentage of their students coming from the target groups. This policy instrument is
known as “weighted student funding.” The less favorable the home situation, the higher the weighting
and the more money the school receives (Ladd & Fiske, 2009). The indicators used to identify target
group children and thus the student weighting have been changed on a number of occasions. At this
point, the target group consists of parents with little education. Substantively, the emphasis has
always been on improving the language and math skills of the children. However, the schools are free
in principle to spend the extra funds received from the Ministry of Education as they see fit.
1.2 Monitoring of disadvantage
The Dutch educational disadvantage policy has been accompanied from the beginning by large-scale,
long-term evaluations (Stevens et al., 2011). This was already the case for the local compensation
programs in large cities and continued to be the case for national policy. With the introduction of the
educational disadvantage policy in 1985, the large-scale LEO (National Evaluation of the Educational
Priority Policy) cohort study was launched (van der Werf, 1995). In 1994, following three biennial
measurement moments, a transition was made to the PRIMA cohort study, which entailed six biennial
measurement moments (Driessen, Sleegers, & Smit, 2008). In 2007, the PRIMA studied was
Geert Driessen Trends in Educational Disadvantage in Dutch School 3
followed by the COOL5-18
cohort study (Driessen & Merry, 2011) with the second measurement
occasion held in 2007 and the third planned for 2013.
The immense amount of data collected during the cohort studies provides not only an important
part of the input for the evaluation of the policy being conducted but is also frequently used to
monitor the educational position of the target groups (Driessen, 2009; Herweijer, 2009; Mulder,
1996).
1.3 Prior research
In an extended series of studies, the development of the school careers of disadvantaged students has
been examined. To give you an impression of the insights provided by the studies to date, the most
important findings can be summarized briefly. To do this, we will make use of primarily the review
provided by Ledoux and Veen (2009). In addition, we will call upon the studies by Mulder (1996),
van Langen and Suhre (2001) and Dagevos and Gijsberts (2009). All of these studies are based on
analyses of the databases from the LEO, PRIMA, and COOL cohort studies or — in other words —
large-scale national studies of the school careers and achievement of students in elementary education
across the period 1988–2007.
1.3.1 Starting differences
In the second grade of Dutch elementary school (i.e. when the children are 6 years of age),1
the
achievement differences between target group students and non-target group students are large. In
particular, Turkish and Moroccan students (i.e., children of so-called “guest workers” in the
Netherlands) start their school careers with large delays in both the areas of language and — to a
lesser degree — math. In the most recent cohorts, however, a reduction in the initial differences can
be seen. Turkish and Moroccan children but also non-minority children of low-educated parents are
moving towards the starting level for non-target group students in both the areas of language and
math. The gap between target and non-target group students is nevertheless far from being bridged.
1.3.2 Development of minority target group students
During the first cohort studies, one could speak of no or at most marginal development in the
achievement of target group students. Later cohort studies show some catching up to occur relative to
the non-target group students during the course of elementary education for the minority target group
students. By grade 8 (i.e., the last grade of Dutch elementary school), the differences in language
achievement levels have shrunk — but are still clearly present — while the differences in math
achievement levels have largely disappeared — with particularly Moroccan students catching up
almost completely. This gain is largely achieved in the upper levels of elementary school (i.e., grades
6 - 8).
1. Dutch elementary schools are for 4- to 12-year-olds and consist of 8 grades. In grades 1 and 2, play takes a central
place, but also pre-reading, pre-math, and pre-writing activities commence. In grade 3, formal instruction in reading,
math, and writing starts. After the last grade in elementary school, grade 8, the students move on to secondary
school. Depending on their attainment levels, they continue in one of the following four tracks of secondary school:
special needs education, pre-vocational education, senior general education, or pre-university education (MinOCW,
2007). For an overview, see Appendix 1.
Geert Driessen Trends in Educational Disadvantage in Dutch School 4
1.3.3 Development of non-minority target group students
A similarly positive development is not seen to occur for non-minority target group students (i.e., the
children of low-educated native Dutch parents). In fact, the achievement delays among this group of
students relative to the group of non-target students have increased rather than decreased with the
delays in math larger than the delays in language. Compared to minority target group students at this
moment, non-minority target group students thus perform better in the area of language but not math.
1.3.4 Progression to higher forms of education
One can speak of a major increase in the percentage of target group students who progress to a higher
level of secondary education. For minority target group students, the increase is predominantly due to
the achievements of Surinamese students (i.e., children from a former Dutch colony) and Moroccan
students. Non-target group students still progress more than twice as often to a higher level of
secondary education than target group students. One can thus speak of perceptible progress among
target group students but little catching up to the non-target group students.
1.3.5 In sum
Positive gains can be observed for the language and math achievements of minority target group
children across the period 1988–2007, but they still have the lowest language scores in the final year
of elementary school — scores which are lower than those for non-minority target group students. No
positive gains are observed for the elementary school achievements of non-minority target group
students. While their starting delays are largely made up during the course of their elementary school
careers and the progression to higher forms of secondary education improves for both minority and
non-minority target group students, non-target group students still progress considerably more often
than target group students to higher levels of secondary education.
2 Definition of the problem
In the present research, we examined how the language and math achievements of the students
targeted by Dutch educational disadvantage policy developed during the period 1994–2007. The
central question was whether the delays of specific groups of students decreased with respect to a
reference group of students during this period. We examined developments in the language and math
skills of different groups of students between grades 2 and 8 in order to answer this question. As
already noted, the weighted student funding criteria and the target groups distinguished using this
information have changed on a number of occasions over the years. With the use of a separate set of
groups identified specifically for the present research, it was possible to trace the development of
different categories of students in considerable detail.
3 Method
3.1 Sample
To map student gains in elementary education, we used the data collected on the different
measurement occasions for the PRIMA cohort studies and the first measurement occasion for the
COOL cohort study. PRIMA started with the first measurement occasion in 1994 and collected
Geert Driessen Trends in Educational Disadvantage in Dutch School 5
information on students in grades 2, 4, 6 and 8. Measurement was then repeated every two years
through 2004. The Netherlands has some 7000 elementary schools, and a total of some 60,000
students from 600 elementary schools participated in each PRIMA measurement occasion (Driessen
et al., 2006). The PRIMA studied was followed by the COOL study in 2007 when information was
collected from some 38,000 students in grades 2, 5 and 8 in 550 schools (Driessen et al., 2009;
Roeleveld et al., 2011).
One can speak of an overrepresentation of schools with many disadvantaged students in the
PRIMA and COOL samples. This is intentional and aimed at obtaining sufficient numbers of students
for smaller categories of disadvantaged students. Furthermore, disadvantaged students and
particularly minority disadvantaged students tend to be concentrated in particular schools. The over-
representation of these schools in a sample thus provides a “typical” picture of the minority
disadvantaged student. The aim of the present research was also not to obtain a representative picture
of the positions of disadvantaged students in the Netherlands but to trace developments within the
groups of students targeted by educational disadvantage policy, which means that over-representation
is not a problem.
For the present analyses, we used the data collected in the years 1994, 1998, and 2002 for the
PRIMA study and the year 2007 for the COOL study. The information from students in grades 2 and
8 was selected to represent the start and end points of elementary education. In grade 2, the children
receive preparatory reading and math instruction. Grade 8 is the last year of Dutch elementary school;
students at the age of about 12 years then proceed to secondary school.
3.2 Measurement instruments and sample characteristics
Two types of data stand central in the present research: namely, the social-ethnic backgrounds of the
students and their language and math skills during elementary school.
The information regarding the social-ethnic backgrounds of the students is based upon the
parental level of education and parental place of birth. We first determined the minority versus non-
minority status of the parents on the basis of their country of birth and then their levels of education.
Within the group of low-educated minority parents, we next distinguished the largest countries of
origin: Turkey, Morocco (former guest worker countries for the Netherlands); Suriname and the
Dutch Antilles (former colonies of the Netherlands); and other non-Western countries. An overview
of the categories used in this study is presented in Table 1.
Geert Driessen Trends in Educational Disadvantage in Dutch School 6
Table 1 - Social-ethnic background categories of students
Categories Labels Indicators
Non-minority
Senior vocational plus N-e both parents more than pre-vocational education, at least one higher
professional or university education
Senior vocational*** N-d both parents senior vocational education
Pre-vocational plus** N-c one parent no more than pre-vocational education, the other more
Pre-vocational* N-b both parents no more than pre-vocational education
Elementary plus* N-a both parents no more than pre-vocational education, at least one no more
than elementary school
Minority
Senior vocational plus M-e both parents more than pre-vocational education, at least one higher
professional or university education
Senior vocational M-d both parents senior vocational education
Pre-vocational plus** M-c one parent no more than pre-vocational education, the other more
Pre-vocational* M-b both parents no more than pre-vocational education
Elementary plus* M-a both parents no more than pre-vocational education, at least one no more
than elementary school
* Currently the group targeted by educational disadvantage policy.
** Group also targeted by educational disadvantage policy up until 2006.
*** Reference category for present analyses.
The language and math skills in both of the cohort studies were measured using the standardized tests
developed by the National Institute for Educational Measurement (CITO). The test results are
expressed as so-called skill scores for language and math. In the period we studied, the exact same
tests were not always used on each measurement occasion. This does not constitute a problem for our
analyses, however, as we did not compare actual test scores across cohorts but, rather, the relative
positions of the categories of students with respect to each other and any changes in these over time.
The tests need not measure exactly the same for this, provided all the students in a cohort have
completed the same tests (which is the case).
3.3 Data analysis
To map the developments of the students, the mean scores for the categories of students we
distinguished were compared to the mean scores for a reference category, which was the category of
non-target students of parents who both have more than a high school but no college education (i.e.,
some form of vocational education). To gain insight into the magnitude of the differences, a so-called
effect size (ES) was calculated for each difference (Thompson, 1998). Effect sizes have the advantage
of not depending on the size of a sample and, because they involve a standardized coefficient,
indicators from different domains can be compared to each other (Coe, 2002). Another advantage is
that the research results can be summarized concisely. In its most simple form, an ES is the difference
between the means (i.e., test scores here) for two groups divided by the pooled standard deviation;
this ES is referred to as the Cohen’s d. With regard to the interpretation of an ES, the rule of thumb
provided by Cohen (1988) is usually followed, namely that a coefficient with a value of 0.20 is
Geert Driessen Trends in Educational Disadvantage in Dutch School 7
considered “small,” one with a coefficient of 0.50 “medium,” and one with a coefficient of 0.80
“large.”
4 Results
4.1 Language skill
In Figures 1 and 2, the effect sizes for language skills are presented for the grade 2 and 8 groups of
children, respectively.
Figure 1 - Language skills of children in grade 2 between 1994 and 2007 according to social-ethnic
background (effect sizes; reference category: Non-minority, maximum of senior vocational education
(N-d))
1994 1998 2002 2007
N-e 0,20 0,17 0,25 0,19
N-d -0,05 -0,08 -0,08 -0,14
N-b -0,32 -0,37 -0,42 -0,32
N-a -0,54 -0,51 -0,77 -0,64
M-e -0,33 -0,35 -0,47 -0,49
M-d -0,50 -0,81 -0,76 -0,84
M-c -0,61 -0,79 -0,98 -0,81
M-b -0,83 -0,96 -1,09 -0,92
M-a -1,30 -1,22 -1,25 -1,09
-1,40
-1,20
-1,00
-0,80
-0,60
-0,40
-0,20
0,00
0,20
0,40
This figure and the following figures can be interpreted as follows. From the first row, it can be seen
that in 1994 the standardized difference (ES) between the non-minority (i.e., native Dutch) students
with high educated parents (N-e) and the reference category of non-minority students who have
parents with no more than a senior vocational education (N-d) is 0.20. This is a small positive effect:
The language skills of the children of non-minority, high educated parents are slightly better than
those of the children in the reference category. The figures from 1998, 2002, and 2007 show the size
of the differences between the two categories of students to remain more or less the same. The second
row in the table shows the differences between the non-minority disadvantaged category of students
Geert Driessen Trends in Educational Disadvantage in Dutch School 8
who were a target of educational disadvantage policy up until 2006 (N-c) relative to the reference
category. For 1994, the ES is -0.05, which is a very slight negative effect: The grade 2 language skills
of the students previously considered disadvantaged are minimally poorer than those of the students
in the reference category. On the subsequent two measurement occasions, this effect remains stable.
In 2007, however, the negative effect has increased to -0.14. Apart from the fact that the difference is
quite small, this finding shows the difference with respect to the reference category to have increased
and the language skills of the grade 2 students in question to thus lag further behind than was
previously the case.
With regard to the language skills of the grade 2 students across the period examined, one can
hardly speak of improvement. Some minor differences can be seen to occur between measurement
points, but these do not persist. Progress can only be seen for the heavily disadvantaged category of
minority students (M-a) on the last measurement occasion with respect to previous occasions, but the
question is whether this improvement persists in later years.
Figure 2 - Language skills of children in grade 8 between 1994 and 2007 according to social-ethnic
background (effect sizes; reference category: Non-minority, maximum of senior vocational education
(N-d))
1994 1998 2002 2007
N-e 0,27 0,31 0,33 0,39
N-d -0,23 -0,19 -0,14 -0,24
N-b -0,53 -0,51 -0,49 -0,57
N-a -0,85 -0,70 -0,65 -0,72
M-e -0,26 -0,29 -0,13 0,01
M-d -0,68 -0,61 -0,47 -0,40
M-c -0,83 -0,78 -0,64 -0,45
M-b -1,01 -0,98 -0,83 -0,75
M-a -1,57 -1,35 -1,12 -0,76
-2,00
-1,50
-1,00
-0,50
0,00
0,50
All of the minority categories of students in grade 8 show progress across the period we examined
with strongly positive development standing out for the category of heavily disadvantaged students
(M-a) in particular: During the period under study, their delay with respect to the reference group
decreased by 50%.
Geert Driessen Trends in Educational Disadvantage in Dutch School 9
When further subdivided according to country of origin, the grade 2 difference between the
Turkish children and the reference category decreased across the period under study; they were thus
catching up to the students in the reference category. In grade 8, this is found to be the case for more
of the minority categories of students and then between the next-to-last and last measurement
occasions in particular.
4.2 Math skill
In Figures 3 and 4, the effect sizes are presented for the math skills of the students in grades 2 and 8,
respectively.
Figure 3 - Math skills of children in grade 2 between 1994 and 2007 according to social-ethnic
background (effect sizes; reference category: Non-minority, maximum of senior vocational education
(N-d))
1994 1998 2002 2007
N-e 0,18 0,20 0,29 0,24
N-d -0,17 -0,10 -0,04 -0,12
N-b -0,43 -0,38 -0,36 -0,31
N-a -0,63 -0,57 -0,63 -0,52
M-e -0,23 -0,18 -0,25 -0,23
M-d -0,51 -0,59 -0,49 -0,56
M-c -0,60 -0,58 -0,60 -0,49
M-b -0,81 -0,72 -0,73 -0,64
M-a -1,07 -0,93 -0,78 -0,66
-1,20
-1,00
-0,80
-0,60
-0,40
-0,20
0,00
0,20
0,40
Once again, the position of the heavily disadvantage minority children in grade 2 (M-a) can be seen to
have markedly improved during the period under study.
Geert Driessen Trends in Educational Disadvantage in Dutch School 10
Figure 4 - Math skills of children in grade 8 between 1994 and 2007 according to social-ethnic
background (effect sizes; reference category: Non-minority, maximum of senior vocational education
(N-d))
1994 1998 2002 2007
N-e 0,19 0,32 0,34 0,35
N-d -0,16 -0,17 -0,18 -0,16
N-b -0,50 -0,50 -0,52 -0,42
N-a -0,81 -0,72 -0,74 -0,48
M-e -0,23 -0,02 0,07 0,13
M-d -0,52 -0,34 -0,35 -0,32
M-c -0,54 -0,56 -0,40 -0,25
M-b -0,73 -0,76 -0,66 -0,56
M-a -0,98 -0,73 -0,69 -0,44
-1,20
-1,00
-0,80
-0,60
-0,40
-0,20
0,00
0,20
0,40
0,60
What stands out for the math skills of the students in grade 8 during the period under study is
improvement in the relative positions of both the minority and non-minority disadvantaged categories
of students (N-a, N-b, M-a, M-b).
When we further subdivided the data from the minority children according to country of origin,
a slight decrease in the disadvantage can be seen to occur for the math skills of the grade 2 students
and particularly the Turkish students across the period under study. In grade 8, the gains in the
category of other non-Western disadvantaged students stand out in particular.
4.3 Reduction of language and math delays
For purposes of the present study, we compared categories of students formed on the basis of the
criteria used to determine weighted student funding. Given that these criteria have changed on a
number of occasions over the years, we adopted a highly differentiated set of ten categories. In
educational disadvantage policy, certain objectives are formulated in terms of a reduction in the
delays of target group students relative to non-target group students (MinOCW, 2010). By the end of
elementary school in the period 2002–2014, for example, language delays should be reduced by 40%;
in the period 2008–2011, this should be 20%.
Geert Driessen Trends in Educational Disadvantage in Dutch School 11
In Table 2, we present the results of our analyses showing the degree of reduction in grade 8 for
delays in the language skills of the disadvantaged groups of students. The relative differences in the
effect sizes for the first and final measurement occasions were calculated for this purpose. For the
sake of completeness, we also did this for their math skills. Different comparisons are presented in the
table. The changes for the entire target group (i.e., minority plus non-minority students) relative to the
non-target group are shown, for example. We then split the total target group into minority versus
non-minority disadvantaged groups. And we examine the size of the changes between 1994 and 2007,
on the one hand, and 2002 and 2007, on the other hand, that is, the full period under study here and
the most recent period under study here, respectively.
Table 2 - Differences in the grade 8 language and math skills of target versus non-target group
students in 1994, 2002, and 2007 (effect sizes), reduction of delays between 1994 and 2007, and
reduction of delays between 2002 and 2007 (in %).
Categories 1994 2002 2007 1994–2007 2002–2007
Total target vs. non-target
Language skill -0.77 -0.71 -0.61 21% 14%
Math Skill -0.62 -0.61 -0.47 24% 23%
Non-minority target vs. non-target
Language skill -0.50 -0.47 -0.53 -6% -13%
Math skill -0.49 -0.55 -0.45 8% 18%
Minority target vs. non-target
Language skill -1.24 -0.96 -0.67 46% 30%
Math skill -0.82 -0.67 -0.49 40% 27%
Inspection of the upper part of the table shows major reductions in the delays of the total target group
relative to the non-target group for the period 1994–2007. For their language skills, the target group
can be seen to have gained 21% on the non-target group. For their math skills, the gain is even larger
than for their language skills, namely 24%. In the period 2002–2007, which obviously is shorter, the
gain for language skills is more limited with 14% but still 23% for math skills.
When the total target group is subdivided into the categories of minority versus non-minority
disadvantaged students, a much more differentiated picture presents itself. The minority target group
has made major gains: a minimum of 40% for the period 1994–2007 and more than 27% for the
period 2002–2007. For the non-minority target group, however, the developments are not nearly so
favorable. In the period 1994–2007, their language skills have either hardly improved or — worse yet
— declined relative to the non-target group; in the period 2002–2007, a deterioration of 13% relative
to the non-target group can be seen. For their math skills, in contrast, some positive developments can
be seen: an almost 10% gain in the period 1994–2007 and almost 20% gain in the period 2002–2007.
Geert Driessen Trends in Educational Disadvantage in Dutch School 12
5 Conclusions and discussion
5.1 Conclusions
Throughout the period we studied, the position of the grade 2 children’s language skills went virtually
unchanged. In grade 8, however, the minority target group students show major gains in the position
of their language skills relative to the non-minority reference category. And similar major gains are
seen for the math skills of the minority target group in both grades 2 and 8.
For the situation in grade 8 of elementary school, we examined the extent to which the delays
of the target groups were reduced. This indeed happened in both the periods 1994–2007 and 2002–
2007. The results of our analyses nevertheless point to large differences between the minority and
non-minority target groups. The minority target group made major gains: a minimum of 40% in the
period 1997–2007 and more than 25% in the period 2002–2007. The development of the non-
minority target group less rose colored. In the period 1994–2007, one can speak of hardly any
progress and even a slight decline in the group’s language skills. In the period 2002–2007, there is a
deterioration of almost 15%. With respect to the group’s math skills, positive gains can be seen:
almost 10% for the period 1994–2007 and almost 20% for the period 2002–2007.
The central question in this study was whether the delays of the different groups targeted by
Dutch educational disadvantage policy during the past decades have diminished or not. The results
presented here are in line with those of previous overviews (Driessen, 2009; Mulder et al., 2005; van
Langen & Suhre, 2001; Vogels & Bronnemans-Helmers, 2003). In short, the conclusion is that large
differences exist between disadvantaged and non-disadvantaged students at the start of elementary
school. Minority target group students have a substantial language delay. In the last year of
elementary school, this delay has diminished somewhat but it is still substantial. The delays of the
minority target group students have declined over the years and in the period 1994–2007 by more
than 40%. Part of the non-minority target group students also made gains, but these are less than
those observed for the minority target group students. Moreover, for the period 2002–2007, the
relative position of the non-minority target group students with regard to their language skills can be
seen to deteriorate.
5.2 Discussion
Various explanations can be offered for the gains made by the minority target group students. To start
with, there is the fact that the length of residence in the Netherlands for the minority students has
increased and many of them belong to the second or even third generation of immigrants (cf. Mulder,
1996). Such demographic developments generally exert a positive effect on the Dutch language skills
of not only parents but also children (Driessen & Merry, 2011). Second, minority parents from later
generations also tend to be higher educated than minority parents from first generations. They can
thus be expected to have greater “cultural capital” at their disposal, know Dutch society better, and be
able to give their children more support with respect to school matters than first-generation immigrant
parents. Third, it is also the case that teachers have gained more experience with interacting with
minority students and learned to better adapt their teaching to the specific situations of these students.
Teachers may have raised their expectations for such students over the years (van den Bergh et al.,
2010). Fourth, part of the explanation may also lie in the effects of educational disadvantage policy,
but convincing evidence for this is still lacking. Particularly those programs conducted within the
Geert Driessen Trends in Educational Disadvantage in Dutch School 13
framework of Preschool and Early Childhood Education and especially those aimed at improving the
language skills of minority target group students presumably play a role.
It is very much the question if the positive developments observed over the years for minority
target group students will continue through the coming years. The changes made in weighted student
funding in 2006 have done away with the ethnic component of the equation. For the allocation of
extra resources to schools, it no longer matters if the child’s parents were born in a foreign country;
the only criterion is now the level of parental education. The consequences of this for special
attention to the relevant children in the class are thus as yet unclear.
Compared to the development of the minority target group students, the development of the
non-minority target group students proceeds less successfully and one can even speak of a relative
decline. It is also regularly asked if all the policy attention for minority target group students does not
occur at the cost of attention for non-minority target group students. For Vogels and Bronneman-
Helmers (2003), this is a reason to refer to the latter group as the “forgotten group.” These authors
offer some other possible explanations for the relative decline in the school achievement of non-
minority disadvantaged students although it should be noted that it would be very difficult to test
these empirically. One explanation might nevertheless be that one can speak of underutilization or
insufficient use of the talents and potential of minority students due to their immigrant histories while
the reservoir of unused or potential talent among non-minority disadvantaged students is simply more
limited to start with. The previously unused talent among non-minority disadvantaged students has,
according to this explanation, now been used to its maximum: A ceiling has been reached with regard
to inherited capacities and talent. Another explanation for the relative decline points to the marginal
level of ambition among low educated non-minority parents in rural areas of the Netherlands (van
Ruijven, 2003). This stands in shrill contrast to the high — but often unrealistic — level of ambition
among minority parents located in urban areas of the country (Driessen, Smit, & Klaassen, 2011). If
this is indeed the case, it can nevertheless only be part of the explanation. Research shows, namely,
large variation in the achievement levels of rural students depending on location: they invariably
perform poorly in the northern provinces (Friesland, Groningen, Drenthe) but well in the southern
province of Limburg (Driessen & Withagen, 1999). One explanation that is frequently offered for this
variation points to the possibly negative effects of speaking a dialect. Once again, however, there is
only very weak empirical evidence for this: The regional variation is quite marked and one can even
speak of a positive effect of speaking the dialect in the province of Limburg (cf. Driessen, 2005).
According to the Dutch Education Inspectorate (Inspectie van het Onderwijs, 2001), the achievement
differences between the northern and southern rural areas of the Netherlands stem primarily from
differences in the quality of the instructional materials, which are often quite limited in the small rural
schools located in the northern provinces (also see van Ruijven, 2003). In addition to this, there is
often little opportunity to provide sufficient extra attention, such as remedial teaching and student
guidance, for those students who need it in such small schools. But it is precisely in these schools that
more care is needed because there are also fewer opportunities for special education and thus chances
for referral. A final explanation offered by Vogels and Bronneman-Helmers (2003) is the limited
extra resources allocated to rural schools in terms of weighted student funding. In 2006, steps were
taken to deal with this critique and extra resources were made available for rural areas of the
Netherlands. We must nevertheless wait to see what the consequences of these measures are for
Geert Driessen Trends in Educational Disadvantage in Dutch School 14
actual educational practice and whether it is really possible to turn the tide for non-minority
disadvantaged students without this happening at the cost of minority disadvantaged students. And
underlying all of this is the question of the extent to which extra financial means directly translate
into better achievement (cf. Mulder, 1996).
References
Coe, R. (2002). It’s the effect size, stupid! What effect size is and why it is important. Paper presented
at the British Educational Research Association annual conference, Exeter, 12-14 September,
2002.
Cohen, J. (1988). Statistical power analysis for the behavioral sciences. Hillsdale, NJ: Erlbaum.
Dagevos, J., & Gijsberts, M. (Eds.) (2009). Jaarrapport integratie 2009. WODC/SCO/CBS. Den
Haag: SCP.
Driessen, G. (2005). In Dutch? Usage of Dutch regional languages and dialects. Language, Culture
and Curriculum, 18(3), 271-285.
Driessen, G. (2009). Prestaties, gedrag en houding van basisschoolleerlingen. Stand van zaken in
2008 en ontwikkelingen sinds 2001. Nijmegen: ITS.
Driessen, G. (2012). Combating ethnic educational disadvantage in the Netherlands. An analysis of
policies and effects. In C. Kassimeris & M. Vryonides (Eds.), The politics of education
Challenging multiculturalism (pp. 31-51). New York: Routledge.
Driessen, G., & Merry, M. (2011).The effects of the integration and generation of immigrants on
language and numeracy achievement. Educational Studies, 37(5), 581-592.
Driessen, G., & Withagen, V. (1999). Language varieties and educational achievement of indigenous
primary school pupils. Language, Culture and Curriculum, 12(1), 1-22.
Driessen, G., Sleegers, P., & Smit, F. (2008). The transition from primary to secondary education:
Meritocracy and ethnicity. European Sociological Review, 24(4), 527-542.
Driessen, G., Smit, F., & Klaassen, C. (2011). Connecting ethnic minority parents to school. From
empirical research to practical suggestions. Journal of Education Research, 4(1), 9-20.
Driessen, G., van Langen, A., & Vierke, H. (2006). Basisonderwijs: Veldwerkverslag,
leerlinggegevens en oudervragenlijsten. Basisrapportage PRIMA-cohortonderzoek. Zesde meting
2004-2005. Nijmegen: ITS.
Driessen, G., Mulder, L., Ledoux, G., Roeleveld, J., & van der Veen, I. (2009). Cohortonderzoek
COOL5-18
. Technisch rapport basisonderwijs, eerste meting 2007/08. Nijmegen: ITS/ Amsterdam:
SCO-Kohnstamm Instituut.
Herweijer, L. (2009). Making up the gap. Migrant education in the Netherlands. Den Haag: SCP.
Inspectie van het Onderwijs (2001). Onderwijsverslag over het jaar 2000. Utrecht: Inspectie van het
Onderwijs.
Ladd, H., & Fiske, E. (2009). The Dutch experience with weighted student funding: Some lessons for
the U.S. Durham, NC: Duke University.
Ledoux, G., & Veen, A. (2009). Beleidsdoorlichting onderwijsachterstandenbeleid. Periode 2002-
2008. Amsterdam: SCO-Kohnstamm Instituut.
Min OCW (2007). The education system in the Netherlands 2007. Den Haag: Ministerie van OCW.
Geert Driessen Trends in Educational Disadvantage in Dutch School 15
MinOCW (2010). Rijksbegroting 2010. VIII Onderwijs, Cultuur en Wetenschap. Den Haag:
Ministerie van OCW.
Mulder, L. (1996). Meer voorrang, minder achterstand? Het Onderwijsvoorrangsbeleid getoetst.
Nijmegen: ITS.
Mulder, L., Roeleveld, J., van der Veen, I., & Vierke, H. (2005) Onderwijsachterstanden tussen 1988
en 2002: ontwikkelingen in basis- en voortgezet onderwijs. Nijmegen/Amsterdam: ITS/SCO-
Kohnstamm Instituut
Roeleveld, J., Driessen, G., Ledoux, G., Cuppen, J. & Meijer, J. (2011). Doelgroepleerlingen in het
basisonderwijs; historische ontwikkeling en actuele situatie. Amsterdam/Nijmegen: SCO-
Kohnstamm Instituut/ITS.
Stevens, P., Clycq, N., Timmerman, C., & Van Houtte, M. (2011). Researching race/ethnicity and
educational inequality in the Netherlands: A critical review of the research literature between 1980
and 2008. British Educational Research Journal, 37(1), 5-43.
Thompson, B. (1998). Five methodology errors in educational research: The pantheon of statistical
significance and other faux pas. Invited address AERA annual meeting, San Diego, US, April
1998.
Vasta, E. (2007). From ethnic minorities to ethnic majority policy: Multiculturalism and the shift to
assimilationism in the Netherlands. Ethnic and Racial Studies, 30(5), 713-740.
Vogels, R., & Bronnemans-Helmers, R. (2003). Autochtone achterstandsleerlingen: een vergeten
groep. Den Haag: SCP.
Van den Bergh, L., Denessen, E., Hornstra, L., Voeten, M., & Holland, R. (2010).The implicit
prejudiced attitudes of teachers relations to teacher expectations and the ethnic achievement gap.
American Educational Research Journal, 47( 2), 497-527.
Van der Werf, M. (1995). The Educational Priority Policy in the Netherlands. Content,
implementation and outcomes. Den Haag: SVO.
Van Langen, A., & Suhre, C. (2001). Ontwikkelingen in de schoolloopbanen van
achterstandsleerlingen. Vergelijkende analyses van een aantal leerlingcohorten in basis- en
voortgezet onderwijs. Nijmegen: ITS.
Van Ruijven, E. (2003). Voorsprong of achterstand? Onderzoek naar het onderwijsniveau van de
Friese leerlingen in het basisonderwijs en het voortgezet onderwijs. Ljouwert: Fryske Akademy.
Geert Driessen Trends in Educational Disadvantage in Dutch School 16
Appendix 1 - An overview of the Dutch education system
Elementary education
Pre-
university
education
(VWO)
Senior general
secondary education
(HAVO)
Pre-vocational secondary
education (VMBO)
Senior secondary vocational
education (MBO)
Higher professional
education (HBO)
University
(WO)
Basic secondary education
Age 4
Age 12
Age 18
Specialelementary
education
Specialsecondary
education
Practical
training
(PRO)

More Related Content

What's hot

Marika Veisson EECERA 2013 Keynote
Marika Veisson EECERA 2013 Keynote Marika Veisson EECERA 2013 Keynote
Marika Veisson EECERA 2013 Keynote EECERA
 
MeredithScoggins_Final thesis
MeredithScoggins_Final thesisMeredithScoggins_Final thesis
MeredithScoggins_Final thesisMeredith Scoggins
 
Teaching Reading in Australia Article - Buckingham, Wheldall, Beaman-Wheldall.
Teaching Reading in Australia Article - Buckingham, Wheldall, Beaman-Wheldall.Teaching Reading in Australia Article - Buckingham, Wheldall, Beaman-Wheldall.
Teaching Reading in Australia Article - Buckingham, Wheldall, Beaman-Wheldall.Read Australia (Wiring Brains Education)
 
"It Makes Me smarter:" Exploratory World Language Instruction in Catholic El...
"It Makes Me smarter:"  Exploratory World Language Instruction in Catholic El..."It Makes Me smarter:"  Exploratory World Language Instruction in Catholic El...
"It Makes Me smarter:" Exploratory World Language Instruction in Catholic El...ericdouglashoward
 
Karim Anil: Need for Change
Karim Anil: Need for ChangeKarim Anil: Need for Change
Karim Anil: Need for ChangeAnilKarim
 
Parents' Perceptions and Attitudes for Denying Bilingual Education by Dr. Mar...
Parents' Perceptions and Attitudes for Denying Bilingual Education by Dr. Mar...Parents' Perceptions and Attitudes for Denying Bilingual Education by Dr. Mar...
Parents' Perceptions and Attitudes for Denying Bilingual Education by Dr. Mar...William Kritsonis
 
Wong esl teacher candidates’ perceptions of readiness
Wong   esl teacher candidates’ perceptions of readinessWong   esl teacher candidates’ perceptions of readiness
Wong esl teacher candidates’ perceptions of readinessNur Raieda Ainul Maslih
 
Position paper on language and literacy development
Position paper on language and literacy developmentPosition paper on language and literacy development
Position paper on language and literacy developmentRe Martins
 
Closing Achievement Gaps in U.S. Public Schools: Exploring Global Models of L...
Closing Achievement Gaps in U.S. Public Schools: Exploring Global Models of L...Closing Achievement Gaps in U.S. Public Schools: Exploring Global Models of L...
Closing Achievement Gaps in U.S. Public Schools: Exploring Global Models of L...Meghan Lee
 
Cascading Towards Implementing Learning Strategies- A Recipe for Success
Cascading Towards Implementing Learning Strategies- A Recipe for SuccessCascading Towards Implementing Learning Strategies- A Recipe for Success
Cascading Towards Implementing Learning Strategies- A Recipe for SuccessNettie Boivin
 
Reading Comprehension Treatment Ghada Awada- Mar Gutierrezcolon
Reading Comprehension Treatment Ghada Awada- Mar GutierrezcolonReading Comprehension Treatment Ghada Awada- Mar Gutierrezcolon
Reading Comprehension Treatment Ghada Awada- Mar GutierrezcolonGhada Awada
 
Frederik Smit, Geert Driessen, Peter Sleegers & Paul Hoop (2002) INET Relatio...
Frederik Smit, Geert Driessen, Peter Sleegers & Paul Hoop (2002) INET Relatio...Frederik Smit, Geert Driessen, Peter Sleegers & Paul Hoop (2002) INET Relatio...
Frederik Smit, Geert Driessen, Peter Sleegers & Paul Hoop (2002) INET Relatio...Driessen Research
 
Tomtatchuongtrinh_Engl-final
Tomtatchuongtrinh_Engl-finalTomtatchuongtrinh_Engl-final
Tomtatchuongtrinh_Engl-finalSaoirse McCann
 

What's hot (17)

Marika Veisson EECERA 2013 Keynote
Marika Veisson EECERA 2013 Keynote Marika Veisson EECERA 2013 Keynote
Marika Veisson EECERA 2013 Keynote
 
MeredithScoggins_Final thesis
MeredithScoggins_Final thesisMeredithScoggins_Final thesis
MeredithScoggins_Final thesis
 
Teaching Reading in Australia Article - Buckingham, Wheldall, Beaman-Wheldall.
Teaching Reading in Australia Article - Buckingham, Wheldall, Beaman-Wheldall.Teaching Reading in Australia Article - Buckingham, Wheldall, Beaman-Wheldall.
Teaching Reading in Australia Article - Buckingham, Wheldall, Beaman-Wheldall.
 
"It Makes Me smarter:" Exploratory World Language Instruction in Catholic El...
"It Makes Me smarter:"  Exploratory World Language Instruction in Catholic El..."It Makes Me smarter:"  Exploratory World Language Instruction in Catholic El...
"It Makes Me smarter:" Exploratory World Language Instruction in Catholic El...
 
Karim Anil: Need for Change
Karim Anil: Need for ChangeKarim Anil: Need for Change
Karim Anil: Need for Change
 
Parents' Perceptions and Attitudes for Denying Bilingual Education by Dr. Mar...
Parents' Perceptions and Attitudes for Denying Bilingual Education by Dr. Mar...Parents' Perceptions and Attitudes for Denying Bilingual Education by Dr. Mar...
Parents' Perceptions and Attitudes for Denying Bilingual Education by Dr. Mar...
 
Wong esl teacher candidates’ perceptions of readiness
Wong   esl teacher candidates’ perceptions of readinessWong   esl teacher candidates’ perceptions of readiness
Wong esl teacher candidates’ perceptions of readiness
 
Research Paper
Research PaperResearch Paper
Research Paper
 
Prepárate!
Prepárate!Prepárate!
Prepárate!
 
Position paper on language and literacy development
Position paper on language and literacy developmentPosition paper on language and literacy development
Position paper on language and literacy development
 
Closing Achievement Gaps in U.S. Public Schools: Exploring Global Models of L...
Closing Achievement Gaps in U.S. Public Schools: Exploring Global Models of L...Closing Achievement Gaps in U.S. Public Schools: Exploring Global Models of L...
Closing Achievement Gaps in U.S. Public Schools: Exploring Global Models of L...
 
Cascading Towards Implementing Learning Strategies- A Recipe for Success
Cascading Towards Implementing Learning Strategies- A Recipe for SuccessCascading Towards Implementing Learning Strategies- A Recipe for Success
Cascading Towards Implementing Learning Strategies- A Recipe for Success
 
Nyu Pte Overview Of Ells Oct2009
Nyu Pte Overview Of Ells Oct2009Nyu Pte Overview Of Ells Oct2009
Nyu Pte Overview Of Ells Oct2009
 
Kto12
Kto12Kto12
Kto12
 
Reading Comprehension Treatment Ghada Awada- Mar Gutierrezcolon
Reading Comprehension Treatment Ghada Awada- Mar GutierrezcolonReading Comprehension Treatment Ghada Awada- Mar Gutierrezcolon
Reading Comprehension Treatment Ghada Awada- Mar Gutierrezcolon
 
Frederik Smit, Geert Driessen, Peter Sleegers & Paul Hoop (2002) INET Relatio...
Frederik Smit, Geert Driessen, Peter Sleegers & Paul Hoop (2002) INET Relatio...Frederik Smit, Geert Driessen, Peter Sleegers & Paul Hoop (2002) INET Relatio...
Frederik Smit, Geert Driessen, Peter Sleegers & Paul Hoop (2002) INET Relatio...
 
Tomtatchuongtrinh_Engl-final
Tomtatchuongtrinh_Engl-finalTomtatchuongtrinh_Engl-final
Tomtatchuongtrinh_Engl-final
 

Viewers also liked

Geert Driessen, Paul Jungbluth & Jo Louvenberg (1987) Onderwijs in Eigen Taal...
Geert Driessen, Paul Jungbluth & Jo Louvenberg (1987) Onderwijs in Eigen Taal...Geert Driessen, Paul Jungbluth & Jo Louvenberg (1987) Onderwijs in Eigen Taal...
Geert Driessen, Paul Jungbluth & Jo Louvenberg (1987) Onderwijs in Eigen Taal...Driessen Research
 
Paul Jungbluth, Chris Verhaak & Geert Driessen (1990) PS Vervolgadviezen in r...
Paul Jungbluth, Chris Verhaak & Geert Driessen (1990) PS Vervolgadviezen in r...Paul Jungbluth, Chris Verhaak & Geert Driessen (1990) PS Vervolgadviezen in r...
Paul Jungbluth, Chris Verhaak & Geert Driessen (1990) PS Vervolgadviezen in r...Driessen Research
 
Geert Driessen (2012) AERA Trends in educational disadvantage
Geert Driessen (2012) AERA Trends in educational disadvantageGeert Driessen (2012) AERA Trends in educational disadvantage
Geert Driessen (2012) AERA Trends in educational disadvantageDriessen Research
 
Geert Driessen (2012) Presessional testing and learning
Geert Driessen (2012) Presessional testing and learningGeert Driessen (2012) Presessional testing and learning
Geert Driessen (2012) Presessional testing and learningDriessen Research
 
Frederik Smit, Roderick Sluiter & Geert Driessen (2006) Literatuurstudie oude...
Frederik Smit, Roderick Sluiter & Geert Driessen (2006) Literatuurstudie oude...Frederik Smit, Roderick Sluiter & Geert Driessen (2006) Literatuurstudie oude...
Frederik Smit, Roderick Sluiter & Geert Driessen (2006) Literatuurstudie oude...Driessen Research
 
Anne Bert Dijkstra, Geert Driessen & Rene Veenstra (2001) AERA Academic Achie...
Anne Bert Dijkstra, Geert Driessen & Rene Veenstra (2001) AERA Academic Achie...Anne Bert Dijkstra, Geert Driessen & Rene Veenstra (2001) AERA Academic Achie...
Anne Bert Dijkstra, Geert Driessen & Rene Veenstra (2001) AERA Academic Achie...Driessen Research
 
Geert Driessen & Jeff Bezemer (1999) Islamitisch basisonderwijs schipperen tu...
Geert Driessen & Jeff Bezemer (1999) Islamitisch basisonderwijs schipperen tu...Geert Driessen & Jeff Bezemer (1999) Islamitisch basisonderwijs schipperen tu...
Geert Driessen & Jeff Bezemer (1999) Islamitisch basisonderwijs schipperen tu...Driessen Research
 
Geert Driessen (1996) NTOOV De gezinssituatie van leerlingen op islamitische ...
Geert Driessen (1996) NTOOV De gezinssituatie van leerlingen op islamitische ...Geert Driessen (1996) NTOOV De gezinssituatie van leerlingen op islamitische ...
Geert Driessen (1996) NTOOV De gezinssituatie van leerlingen op islamitische ...Driessen Research
 
Michael Merry, Geert Driessen & Imane Oulali (2012) Pedagogiek Doet onderwijs...
Michael Merry, Geert Driessen & Imane Oulali (2012) Pedagogiek Doet onderwijs...Michael Merry, Geert Driessen & Imane Oulali (2012) Pedagogiek Doet onderwijs...
Michael Merry, Geert Driessen & Imane Oulali (2012) Pedagogiek Doet onderwijs...Driessen Research
 
Eddie Denessen, Geert Driessen & Joep Bakker (2010) AERA Cognitive and non co...
Eddie Denessen, Geert Driessen & Joep Bakker (2010) AERA Cognitive and non co...Eddie Denessen, Geert Driessen & Joep Bakker (2010) AERA Cognitive and non co...
Eddie Denessen, Geert Driessen & Joep Bakker (2010) AERA Cognitive and non co...Driessen Research
 
Geert Driessen (2012) ECER Early Childhood Education
Geert Driessen (2012) ECER Early Childhood EducationGeert Driessen (2012) ECER Early Childhood Education
Geert Driessen (2012) ECER Early Childhood EducationDriessen Research
 
Eddie Denessen, Geert Driessen & Peter Sleegers (2005) JEP Segregation by cho...
Eddie Denessen, Geert Driessen & Peter Sleegers (2005) JEP Segregation by cho...Eddie Denessen, Geert Driessen & Peter Sleegers (2005) JEP Segregation by cho...
Eddie Denessen, Geert Driessen & Peter Sleegers (2005) JEP Segregation by cho...Driessen Research
 
Geert Driessen (1993) SEE Socio-economic or ethnic determinants of educationa...
Geert Driessen (1993) SEE Socio-economic or ethnic determinants of educationa...Geert Driessen (1993) SEE Socio-economic or ethnic determinants of educationa...
Geert Driessen (1993) SEE Socio-economic or ethnic determinants of educationa...Driessen Research
 
Geert Driessen & Pim Valkenberg (2000) BJRE Islamic schools in the Netherland...
Geert Driessen & Pim Valkenberg (2000) BJRE Islamic schools in the Netherland...Geert Driessen & Pim Valkenberg (2000) BJRE Islamic schools in the Netherland...
Geert Driessen & Pim Valkenberg (2000) BJRE Islamic schools in the Netherland...Driessen Research
 
Geert Driessen (2002) SEE School composition and achievement in primary educa...
Geert Driessen (2002) SEE School composition and achievement in primary educa...Geert Driessen (2002) SEE School composition and achievement in primary educa...
Geert Driessen (2002) SEE School composition and achievement in primary educa...Driessen Research
 
Marjolein van den Nieuwenhof, Frans van der Slik & Geert Driessen (2004) ed K...
Marjolein van den Nieuwenhof, Frans van der Slik & Geert Driessen (2004) ed K...Marjolein van den Nieuwenhof, Frans van der Slik & Geert Driessen (2004) ed K...
Marjolein van den Nieuwenhof, Frans van der Slik & Geert Driessen (2004) ed K...Driessen Research
 
Frederik Smit & Geert Driessen (2009) Innovaties in ouderbetrokkenheid
Frederik Smit & Geert Driessen (2009) Innovaties in ouderbetrokkenheidFrederik Smit & Geert Driessen (2009) Innovaties in ouderbetrokkenheid
Frederik Smit & Geert Driessen (2009) Innovaties in ouderbetrokkenheidDriessen Research
 

Viewers also liked (17)

Geert Driessen, Paul Jungbluth & Jo Louvenberg (1987) Onderwijs in Eigen Taal...
Geert Driessen, Paul Jungbluth & Jo Louvenberg (1987) Onderwijs in Eigen Taal...Geert Driessen, Paul Jungbluth & Jo Louvenberg (1987) Onderwijs in Eigen Taal...
Geert Driessen, Paul Jungbluth & Jo Louvenberg (1987) Onderwijs in Eigen Taal...
 
Paul Jungbluth, Chris Verhaak & Geert Driessen (1990) PS Vervolgadviezen in r...
Paul Jungbluth, Chris Verhaak & Geert Driessen (1990) PS Vervolgadviezen in r...Paul Jungbluth, Chris Verhaak & Geert Driessen (1990) PS Vervolgadviezen in r...
Paul Jungbluth, Chris Verhaak & Geert Driessen (1990) PS Vervolgadviezen in r...
 
Geert Driessen (2012) AERA Trends in educational disadvantage
Geert Driessen (2012) AERA Trends in educational disadvantageGeert Driessen (2012) AERA Trends in educational disadvantage
Geert Driessen (2012) AERA Trends in educational disadvantage
 
Geert Driessen (2012) Presessional testing and learning
Geert Driessen (2012) Presessional testing and learningGeert Driessen (2012) Presessional testing and learning
Geert Driessen (2012) Presessional testing and learning
 
Frederik Smit, Roderick Sluiter & Geert Driessen (2006) Literatuurstudie oude...
Frederik Smit, Roderick Sluiter & Geert Driessen (2006) Literatuurstudie oude...Frederik Smit, Roderick Sluiter & Geert Driessen (2006) Literatuurstudie oude...
Frederik Smit, Roderick Sluiter & Geert Driessen (2006) Literatuurstudie oude...
 
Anne Bert Dijkstra, Geert Driessen & Rene Veenstra (2001) AERA Academic Achie...
Anne Bert Dijkstra, Geert Driessen & Rene Veenstra (2001) AERA Academic Achie...Anne Bert Dijkstra, Geert Driessen & Rene Veenstra (2001) AERA Academic Achie...
Anne Bert Dijkstra, Geert Driessen & Rene Veenstra (2001) AERA Academic Achie...
 
Geert Driessen & Jeff Bezemer (1999) Islamitisch basisonderwijs schipperen tu...
Geert Driessen & Jeff Bezemer (1999) Islamitisch basisonderwijs schipperen tu...Geert Driessen & Jeff Bezemer (1999) Islamitisch basisonderwijs schipperen tu...
Geert Driessen & Jeff Bezemer (1999) Islamitisch basisonderwijs schipperen tu...
 
Geert Driessen (1996) NTOOV De gezinssituatie van leerlingen op islamitische ...
Geert Driessen (1996) NTOOV De gezinssituatie van leerlingen op islamitische ...Geert Driessen (1996) NTOOV De gezinssituatie van leerlingen op islamitische ...
Geert Driessen (1996) NTOOV De gezinssituatie van leerlingen op islamitische ...
 
Michael Merry, Geert Driessen & Imane Oulali (2012) Pedagogiek Doet onderwijs...
Michael Merry, Geert Driessen & Imane Oulali (2012) Pedagogiek Doet onderwijs...Michael Merry, Geert Driessen & Imane Oulali (2012) Pedagogiek Doet onderwijs...
Michael Merry, Geert Driessen & Imane Oulali (2012) Pedagogiek Doet onderwijs...
 
Eddie Denessen, Geert Driessen & Joep Bakker (2010) AERA Cognitive and non co...
Eddie Denessen, Geert Driessen & Joep Bakker (2010) AERA Cognitive and non co...Eddie Denessen, Geert Driessen & Joep Bakker (2010) AERA Cognitive and non co...
Eddie Denessen, Geert Driessen & Joep Bakker (2010) AERA Cognitive and non co...
 
Geert Driessen (2012) ECER Early Childhood Education
Geert Driessen (2012) ECER Early Childhood EducationGeert Driessen (2012) ECER Early Childhood Education
Geert Driessen (2012) ECER Early Childhood Education
 
Eddie Denessen, Geert Driessen & Peter Sleegers (2005) JEP Segregation by cho...
Eddie Denessen, Geert Driessen & Peter Sleegers (2005) JEP Segregation by cho...Eddie Denessen, Geert Driessen & Peter Sleegers (2005) JEP Segregation by cho...
Eddie Denessen, Geert Driessen & Peter Sleegers (2005) JEP Segregation by cho...
 
Geert Driessen (1993) SEE Socio-economic or ethnic determinants of educationa...
Geert Driessen (1993) SEE Socio-economic or ethnic determinants of educationa...Geert Driessen (1993) SEE Socio-economic or ethnic determinants of educationa...
Geert Driessen (1993) SEE Socio-economic or ethnic determinants of educationa...
 
Geert Driessen & Pim Valkenberg (2000) BJRE Islamic schools in the Netherland...
Geert Driessen & Pim Valkenberg (2000) BJRE Islamic schools in the Netherland...Geert Driessen & Pim Valkenberg (2000) BJRE Islamic schools in the Netherland...
Geert Driessen & Pim Valkenberg (2000) BJRE Islamic schools in the Netherland...
 
Geert Driessen (2002) SEE School composition and achievement in primary educa...
Geert Driessen (2002) SEE School composition and achievement in primary educa...Geert Driessen (2002) SEE School composition and achievement in primary educa...
Geert Driessen (2002) SEE School composition and achievement in primary educa...
 
Marjolein van den Nieuwenhof, Frans van der Slik & Geert Driessen (2004) ed K...
Marjolein van den Nieuwenhof, Frans van der Slik & Geert Driessen (2004) ed K...Marjolein van den Nieuwenhof, Frans van der Slik & Geert Driessen (2004) ed K...
Marjolein van den Nieuwenhof, Frans van der Slik & Geert Driessen (2004) ed K...
 
Frederik Smit & Geert Driessen (2009) Innovaties in ouderbetrokkenheid
Frederik Smit & Geert Driessen (2009) Innovaties in ouderbetrokkenheidFrederik Smit & Geert Driessen (2009) Innovaties in ouderbetrokkenheid
Frederik Smit & Geert Driessen (2009) Innovaties in ouderbetrokkenheid
 

Similar to Geert Driessen (2012) AERA Trends in Educational Disadvantage in Dutch Elementary School

Geert Driessen & Michael Merry (2013) AERA Tackling socioeconomic and ethnic ...
Geert Driessen & Michael Merry (2013) AERA Tackling socioeconomic and ethnic ...Geert Driessen & Michael Merry (2013) AERA Tackling socioeconomic and ethnic ...
Geert Driessen & Michael Merry (2013) AERA Tackling socioeconomic and ethnic ...Driessen Research
 
Geert Driessen & Michael Merry (2014) ER Trends in educational disadvantage.pdf
Geert Driessen & Michael Merry (2014) ER Trends in educational disadvantage.pdfGeert Driessen & Michael Merry (2014) ER Trends in educational disadvantage.pdf
Geert Driessen & Michael Merry (2014) ER Trends in educational disadvantage.pdfDriessen Research
 
Ton Mooij & Geert Driessen (2008) BJEP Differential ability and attainment.pdf
Ton Mooij &  Geert Driessen (2008) BJEP Differential ability and attainment.pdfTon Mooij &  Geert Driessen (2008) BJEP Differential ability and attainment.pdf
Ton Mooij & Geert Driessen (2008) BJEP Differential ability and attainment.pdfDriessen Research
 
Geert Driessen 2018 Encyclopedia Early childhood education intervention progr...
Geert Driessen 2018 Encyclopedia Early childhood education intervention progr...Geert Driessen 2018 Encyclopedia Early childhood education intervention progr...
Geert Driessen 2018 Encyclopedia Early childhood education intervention progr...Driessen Research
 
Geert Driessen & Hetty Dekkers (2008) ISSJ Dutch policies on socio-ecomic and...
Geert Driessen & Hetty Dekkers (2008) ISSJ Dutch policies on socio-ecomic and...Geert Driessen & Hetty Dekkers (2008) ISSJ Dutch policies on socio-ecomic and...
Geert Driessen & Hetty Dekkers (2008) ISSJ Dutch policies on socio-ecomic and...Driessen Research
 
Geert Driessen (2020) The evidence for the effectiveness of family and cente...
Geert Driessen (2020) The evidence for the effectiveness of family  and cente...Geert Driessen (2020) The evidence for the effectiveness of family  and cente...
Geert Driessen (2020) The evidence for the effectiveness of family and cente...Driessen Research
 
Geert Driessen (2017) EPASR The validity of educational disadvantage indicators
Geert Driessen (2017) EPASR The validity of educational disadvantage indicatorsGeert Driessen (2017) EPASR The validity of educational disadvantage indicators
Geert Driessen (2017) EPASR The validity of educational disadvantage indicatorsDriessen Research
 
Interventions Strategies in Special Education: How Effective Are They for Cu...
Interventions Strategies in Special Education:  How Effective Are They for Cu...Interventions Strategies in Special Education:  How Effective Are They for Cu...
Interventions Strategies in Special Education: How Effective Are They for Cu...rabgibrine
 
Geert Driessen 2017 JER Language choice and language proficiency.pdf
Geert Driessen 2017 JER Language choice and language proficiency.pdfGeert Driessen 2017 JER Language choice and language proficiency.pdf
Geert Driessen 2017 JER Language choice and language proficiency.pdfDriessen Research
 
Hetty Dekkers & Geert Driessen (1997) SEE An evaluation of the Educational Pr...
Hetty Dekkers & Geert Driessen (1997) SEE An evaluation of the Educational Pr...Hetty Dekkers & Geert Driessen (1997) SEE An evaluation of the Educational Pr...
Hetty Dekkers & Geert Driessen (1997) SEE An evaluation of the Educational Pr...Driessen Research
 
Geert Driessen (2021) Parental involvement: Types and effects
Geert Driessen (2021) Parental involvement: Types and effectsGeert Driessen (2021) Parental involvement: Types and effects
Geert Driessen (2021) Parental involvement: Types and effectsDriessen Research
 
Parents' Perceptions and Attitudes for Denying Blingual Education by Dr. Mari...
Parents' Perceptions and Attitudes for Denying Blingual Education by Dr. Mari...Parents' Perceptions and Attitudes for Denying Blingual Education by Dr. Mari...
Parents' Perceptions and Attitudes for Denying Blingual Education by Dr. Mari...William Kritsonis
 
Martinez, luz elena perceptions and attitudes focus v9 n1 2012 (posted)
Martinez, luz elena perceptions and attitudes focus v9 n1 2012 (posted)Martinez, luz elena perceptions and attitudes focus v9 n1 2012 (posted)
Martinez, luz elena perceptions and attitudes focus v9 n1 2012 (posted)William Kritsonis
 
Dante Montebon (iloveyouJCD)
Dante Montebon (iloveyouJCD)Dante Montebon (iloveyouJCD)
Dante Montebon (iloveyouJCD)iloveyouJOSAIAH
 
Geert Driessen (2004) ECDC A large-scale longitudinal study of the
Geert Driessen (2004) ECDC A large-scale longitudinal study of theGeert Driessen (2004) ECDC A large-scale longitudinal study of the
Geert Driessen (2004) ECDC A large-scale longitudinal study of theDriessen Research
 
Power Point Bilingual Education Final 2
Power Point Bilingual Education Final 2Power Point Bilingual Education Final 2
Power Point Bilingual Education Final 2elizabethsroberts85
 
Eddie Denessen, Geert Driessen & Joep Bakker (2011) JEDR School and classroom...
Eddie Denessen, Geert Driessen & Joep Bakker (2011) JEDR School and classroom...Eddie Denessen, Geert Driessen & Joep Bakker (2011) JEDR School and classroom...
Eddie Denessen, Geert Driessen & Joep Bakker (2011) JEDR School and classroom...Driessen Research
 

Similar to Geert Driessen (2012) AERA Trends in Educational Disadvantage in Dutch Elementary School (20)

Geert Driessen & Michael Merry (2013) AERA Tackling socioeconomic and ethnic ...
Geert Driessen & Michael Merry (2013) AERA Tackling socioeconomic and ethnic ...Geert Driessen & Michael Merry (2013) AERA Tackling socioeconomic and ethnic ...
Geert Driessen & Michael Merry (2013) AERA Tackling socioeconomic and ethnic ...
 
Geert Driessen & Michael Merry (2014) ER Trends in educational disadvantage.pdf
Geert Driessen & Michael Merry (2014) ER Trends in educational disadvantage.pdfGeert Driessen & Michael Merry (2014) ER Trends in educational disadvantage.pdf
Geert Driessen & Michael Merry (2014) ER Trends in educational disadvantage.pdf
 
Ton Mooij & Geert Driessen (2008) BJEP Differential ability and attainment.pdf
Ton Mooij &  Geert Driessen (2008) BJEP Differential ability and attainment.pdfTon Mooij &  Geert Driessen (2008) BJEP Differential ability and attainment.pdf
Ton Mooij & Geert Driessen (2008) BJEP Differential ability and attainment.pdf
 
Geert Driessen 2018 Encyclopedia Early childhood education intervention progr...
Geert Driessen 2018 Encyclopedia Early childhood education intervention progr...Geert Driessen 2018 Encyclopedia Early childhood education intervention progr...
Geert Driessen 2018 Encyclopedia Early childhood education intervention progr...
 
Geert Driessen & Hetty Dekkers (2008) ISSJ Dutch policies on socio-ecomic and...
Geert Driessen & Hetty Dekkers (2008) ISSJ Dutch policies on socio-ecomic and...Geert Driessen & Hetty Dekkers (2008) ISSJ Dutch policies on socio-ecomic and...
Geert Driessen & Hetty Dekkers (2008) ISSJ Dutch policies on socio-ecomic and...
 
Geert Driessen (2020) The evidence for the effectiveness of family and cente...
Geert Driessen (2020) The evidence for the effectiveness of family  and cente...Geert Driessen (2020) The evidence for the effectiveness of family  and cente...
Geert Driessen (2020) The evidence for the effectiveness of family and cente...
 
Geert Driessen (2017) EPASR The validity of educational disadvantage indicators
Geert Driessen (2017) EPASR The validity of educational disadvantage indicatorsGeert Driessen (2017) EPASR The validity of educational disadvantage indicators
Geert Driessen (2017) EPASR The validity of educational disadvantage indicators
 
Interventions Strategies in Special Education: How Effective Are They for Cu...
Interventions Strategies in Special Education:  How Effective Are They for Cu...Interventions Strategies in Special Education:  How Effective Are They for Cu...
Interventions Strategies in Special Education: How Effective Are They for Cu...
 
Geert Driessen 2017 JER Language choice and language proficiency.pdf
Geert Driessen 2017 JER Language choice and language proficiency.pdfGeert Driessen 2017 JER Language choice and language proficiency.pdf
Geert Driessen 2017 JER Language choice and language proficiency.pdf
 
Hetty Dekkers & Geert Driessen (1997) SEE An evaluation of the Educational Pr...
Hetty Dekkers & Geert Driessen (1997) SEE An evaluation of the Educational Pr...Hetty Dekkers & Geert Driessen (1997) SEE An evaluation of the Educational Pr...
Hetty Dekkers & Geert Driessen (1997) SEE An evaluation of the Educational Pr...
 
Oldandnewliteracies
OldandnewliteraciesOldandnewliteracies
Oldandnewliteracies
 
Geert Driessen (2021) Parental involvement: Types and effects
Geert Driessen (2021) Parental involvement: Types and effectsGeert Driessen (2021) Parental involvement: Types and effects
Geert Driessen (2021) Parental involvement: Types and effects
 
What is the k to 12 program
What is the k to 12 programWhat is the k to 12 program
What is the k to 12 program
 
Parents' Perceptions and Attitudes for Denying Blingual Education by Dr. Mari...
Parents' Perceptions and Attitudes for Denying Blingual Education by Dr. Mari...Parents' Perceptions and Attitudes for Denying Blingual Education by Dr. Mari...
Parents' Perceptions and Attitudes for Denying Blingual Education by Dr. Mari...
 
Martinez, luz elena perceptions and attitudes focus v9 n1 2012 (posted)
Martinez, luz elena perceptions and attitudes focus v9 n1 2012 (posted)Martinez, luz elena perceptions and attitudes focus v9 n1 2012 (posted)
Martinez, luz elena perceptions and attitudes focus v9 n1 2012 (posted)
 
Dante Montebon (iloveyouJCD)
Dante Montebon (iloveyouJCD)Dante Montebon (iloveyouJCD)
Dante Montebon (iloveyouJCD)
 
Peer
PeerPeer
Peer
 
Geert Driessen (2004) ECDC A large-scale longitudinal study of the
Geert Driessen (2004) ECDC A large-scale longitudinal study of theGeert Driessen (2004) ECDC A large-scale longitudinal study of the
Geert Driessen (2004) ECDC A large-scale longitudinal study of the
 
Power Point Bilingual Education Final 2
Power Point Bilingual Education Final 2Power Point Bilingual Education Final 2
Power Point Bilingual Education Final 2
 
Eddie Denessen, Geert Driessen & Joep Bakker (2011) JEDR School and classroom...
Eddie Denessen, Geert Driessen & Joep Bakker (2011) JEDR School and classroom...Eddie Denessen, Geert Driessen & Joep Bakker (2011) JEDR School and classroom...
Eddie Denessen, Geert Driessen & Joep Bakker (2011) JEDR School and classroom...
 

More from Driessen Research

Geert Driessen (2024) OOP De generaliseerbaarheid van een VVE-modelprogramma....
Geert Driessen (2024) OOP De generaliseerbaarheid van een VVE-modelprogramma....Geert Driessen (2024) OOP De generaliseerbaarheid van een VVE-modelprogramma....
Geert Driessen (2024) OOP De generaliseerbaarheid van een VVE-modelprogramma....Driessen Research
 
Geert Driessen (2024) Demasqué VVE-modelprogramma's.pdf
Geert Driessen (2024) Demasqué VVE-modelprogramma's.pdfGeert Driessen (2024) Demasqué VVE-modelprogramma's.pdf
Geert Driessen (2024) Demasqué VVE-modelprogramma's.pdfDriessen Research
 
Geert Driessen (2024) Encyclopedia Abecedarian an impossible model preschool ...
Geert Driessen (2024) Encyclopedia Abecedarian an impossible model preschool ...Geert Driessen (2024) Encyclopedia Abecedarian an impossible model preschool ...
Geert Driessen (2024) Encyclopedia Abecedarian an impossible model preschool ...Driessen Research
 
Geert Driessen (2023) Encyclopedia The Perry HighScope Preschool Program A Cr...
Geert Driessen (2023) Encyclopedia The Perry HighScope Preschool Program A Cr...Geert Driessen (2023) Encyclopedia The Perry HighScope Preschool Program A Cr...
Geert Driessen (2023) Encyclopedia The Perry HighScope Preschool Program A Cr...Driessen Research
 
Kees de Bot, Geert Driessen & Paul Jungbluth (1988) MLEML An exploration of t...
Kees de Bot, Geert Driessen & Paul Jungbluth (1988) MLEML An exploration of t...Kees de Bot, Geert Driessen & Paul Jungbluth (1988) MLEML An exploration of t...
Kees de Bot, Geert Driessen & Paul Jungbluth (1988) MLEML An exploration of t...Driessen Research
 
Geert Driessen (1992) MLEML Developments in first and second language acquisi...
Geert Driessen (1992) MLEML Developments in first and second language acquisi...Geert Driessen (1992) MLEML Developments in first and second language acquisi...
Geert Driessen (1992) MLEML Developments in first and second language acquisi...Driessen Research
 
Geert Driessen, Lia Mulder & Paul Jungbluth (1994) ILAPSI Ethnicity and socia...
Geert Driessen, Lia Mulder & Paul Jungbluth (1994) ILAPSI Ethnicity and socia...Geert Driessen, Lia Mulder & Paul Jungbluth (1994) ILAPSI Ethnicity and socia...
Geert Driessen, Lia Mulder & Paul Jungbluth (1994) ILAPSI Ethnicity and socia...Driessen Research
 
Geert Driessen & Pim Valkenberg (2000) AERA Islamic schools in the western wo...
Geert Driessen & Pim Valkenberg (2000) AERA Islamic schools in the western wo...Geert Driessen & Pim Valkenberg (2000) AERA Islamic schools in the western wo...
Geert Driessen & Pim Valkenberg (2000) AERA Islamic schools in the western wo...Driessen Research
 
Geert Driessen (2000) AEGEE Islamic schools in the western world Paper.pdf
Geert Driessen (2000) AEGEE Islamic schools in the western world Paper.pdfGeert Driessen (2000) AEGEE Islamic schools in the western world Paper.pdf
Geert Driessen (2000) AEGEE Islamic schools in the western world Paper.pdfDriessen Research
 
Geert Driessen (2001) AERA Public-private effects in elementary schools in th...
Geert Driessen (2001) AERA Public-private effects in elementary schools in th...Geert Driessen (2001) AERA Public-private effects in elementary schools in th...
Geert Driessen (2001) AERA Public-private effects in elementary schools in th...Driessen Research
 
Geert Driessen & Frederik Smit (2005) ERNAPE Integration participation and ed...
Geert Driessen & Frederik Smit (2005) ERNAPE Integration participation and ed...Geert Driessen & Frederik Smit (2005) ERNAPE Integration participation and ed...
Geert Driessen & Frederik Smit (2005) ERNAPE Integration participation and ed...Driessen Research
 
Frederik Smit & Geert Driessen (2005) CARE Parent and community involvement i...
Frederik Smit & Geert Driessen (2005) CARE Parent and community involvement i...Frederik Smit & Geert Driessen (2005) CARE Parent and community involvement i...
Frederik Smit & Geert Driessen (2005) CARE Parent and community involvement i...Driessen Research
 
Geert Driessen (2006) ERCOMER Integration participation and education Pres.ppt
Geert Driessen (2006) ERCOMER Integration participation and education Pres.pptGeert Driessen (2006) ERCOMER Integration participation and education Pres.ppt
Geert Driessen (2006) ERCOMER Integration participation and education Pres.pptDriessen Research
 
Michael Merry & Geert Driessen (2010) WCCES Integration by other means Hindu ...
Michael Merry & Geert Driessen (2010) WCCES Integration by other means Hindu ...Michael Merry & Geert Driessen (2010) WCCES Integration by other means Hindu ...
Michael Merry & Geert Driessen (2010) WCCES Integration by other means Hindu ...Driessen Research
 
Frederik Smit & Geert Driessen (2013) ERNAPE Dealing with street culture in s...
Frederik Smit & Geert Driessen (2013) ERNAPE Dealing with street culture in s...Frederik Smit & Geert Driessen (2013) ERNAPE Dealing with street culture in s...
Frederik Smit & Geert Driessen (2013) ERNAPE Dealing with street culture in s...Driessen Research
 
Frederik Smit & Geert Driessen (2013) ERNAPE Critical lessons from practices ...
Frederik Smit & Geert Driessen (2013) ERNAPE Critical lessons from practices ...Frederik Smit & Geert Driessen (2013) ERNAPE Critical lessons from practices ...
Frederik Smit & Geert Driessen (2013) ERNAPE Critical lessons from practices ...Driessen Research
 
Geert Driessen & Michael Merry (2015) RA The gross and net effects Pres.pdf
Geert Driessen & Michael Merry (2015) RA The gross and net effects Pres.pdfGeert Driessen & Michael Merry (2015) RA The gross and net effects Pres.pdf
Geert Driessen & Michael Merry (2015) RA The gross and net effects Pres.pdfDriessen Research
 
Orhan Agirdag, Geert Driessen & Michael Merry (2015) ESA Is there a Catholic ...
Orhan Agirdag, Geert Driessen & Michael Merry (2015) ESA Is there a Catholic ...Orhan Agirdag, Geert Driessen & Michael Merry (2015) ESA Is there a Catholic ...
Orhan Agirdag, Geert Driessen & Michael Merry (2015) ESA Is there a Catholic ...Driessen Research
 
Geert Driessen (2013) GemOss Onderwijsachterstandenbestrijding Pres.pptx
Geert Driessen (2013) GemOss Onderwijsachterstandenbestrijding Pres.pptxGeert Driessen (2013) GemOss Onderwijsachterstandenbestrijding Pres.pptx
Geert Driessen (2013) GemOss Onderwijsachterstandenbestrijding Pres.pptxDriessen Research
 
Geert Driessen (2016) College RUG Performance differences between religious a...
Geert Driessen (2016) College RUG Performance differences between religious a...Geert Driessen (2016) College RUG Performance differences between religious a...
Geert Driessen (2016) College RUG Performance differences between religious a...Driessen Research
 

More from Driessen Research (20)

Geert Driessen (2024) OOP De generaliseerbaarheid van een VVE-modelprogramma....
Geert Driessen (2024) OOP De generaliseerbaarheid van een VVE-modelprogramma....Geert Driessen (2024) OOP De generaliseerbaarheid van een VVE-modelprogramma....
Geert Driessen (2024) OOP De generaliseerbaarheid van een VVE-modelprogramma....
 
Geert Driessen (2024) Demasqué VVE-modelprogramma's.pdf
Geert Driessen (2024) Demasqué VVE-modelprogramma's.pdfGeert Driessen (2024) Demasqué VVE-modelprogramma's.pdf
Geert Driessen (2024) Demasqué VVE-modelprogramma's.pdf
 
Geert Driessen (2024) Encyclopedia Abecedarian an impossible model preschool ...
Geert Driessen (2024) Encyclopedia Abecedarian an impossible model preschool ...Geert Driessen (2024) Encyclopedia Abecedarian an impossible model preschool ...
Geert Driessen (2024) Encyclopedia Abecedarian an impossible model preschool ...
 
Geert Driessen (2023) Encyclopedia The Perry HighScope Preschool Program A Cr...
Geert Driessen (2023) Encyclopedia The Perry HighScope Preschool Program A Cr...Geert Driessen (2023) Encyclopedia The Perry HighScope Preschool Program A Cr...
Geert Driessen (2023) Encyclopedia The Perry HighScope Preschool Program A Cr...
 
Kees de Bot, Geert Driessen & Paul Jungbluth (1988) MLEML An exploration of t...
Kees de Bot, Geert Driessen & Paul Jungbluth (1988) MLEML An exploration of t...Kees de Bot, Geert Driessen & Paul Jungbluth (1988) MLEML An exploration of t...
Kees de Bot, Geert Driessen & Paul Jungbluth (1988) MLEML An exploration of t...
 
Geert Driessen (1992) MLEML Developments in first and second language acquisi...
Geert Driessen (1992) MLEML Developments in first and second language acquisi...Geert Driessen (1992) MLEML Developments in first and second language acquisi...
Geert Driessen (1992) MLEML Developments in first and second language acquisi...
 
Geert Driessen, Lia Mulder & Paul Jungbluth (1994) ILAPSI Ethnicity and socia...
Geert Driessen, Lia Mulder & Paul Jungbluth (1994) ILAPSI Ethnicity and socia...Geert Driessen, Lia Mulder & Paul Jungbluth (1994) ILAPSI Ethnicity and socia...
Geert Driessen, Lia Mulder & Paul Jungbluth (1994) ILAPSI Ethnicity and socia...
 
Geert Driessen & Pim Valkenberg (2000) AERA Islamic schools in the western wo...
Geert Driessen & Pim Valkenberg (2000) AERA Islamic schools in the western wo...Geert Driessen & Pim Valkenberg (2000) AERA Islamic schools in the western wo...
Geert Driessen & Pim Valkenberg (2000) AERA Islamic schools in the western wo...
 
Geert Driessen (2000) AEGEE Islamic schools in the western world Paper.pdf
Geert Driessen (2000) AEGEE Islamic schools in the western world Paper.pdfGeert Driessen (2000) AEGEE Islamic schools in the western world Paper.pdf
Geert Driessen (2000) AEGEE Islamic schools in the western world Paper.pdf
 
Geert Driessen (2001) AERA Public-private effects in elementary schools in th...
Geert Driessen (2001) AERA Public-private effects in elementary schools in th...Geert Driessen (2001) AERA Public-private effects in elementary schools in th...
Geert Driessen (2001) AERA Public-private effects in elementary schools in th...
 
Geert Driessen & Frederik Smit (2005) ERNAPE Integration participation and ed...
Geert Driessen & Frederik Smit (2005) ERNAPE Integration participation and ed...Geert Driessen & Frederik Smit (2005) ERNAPE Integration participation and ed...
Geert Driessen & Frederik Smit (2005) ERNAPE Integration participation and ed...
 
Frederik Smit & Geert Driessen (2005) CARE Parent and community involvement i...
Frederik Smit & Geert Driessen (2005) CARE Parent and community involvement i...Frederik Smit & Geert Driessen (2005) CARE Parent and community involvement i...
Frederik Smit & Geert Driessen (2005) CARE Parent and community involvement i...
 
Geert Driessen (2006) ERCOMER Integration participation and education Pres.ppt
Geert Driessen (2006) ERCOMER Integration participation and education Pres.pptGeert Driessen (2006) ERCOMER Integration participation and education Pres.ppt
Geert Driessen (2006) ERCOMER Integration participation and education Pres.ppt
 
Michael Merry & Geert Driessen (2010) WCCES Integration by other means Hindu ...
Michael Merry & Geert Driessen (2010) WCCES Integration by other means Hindu ...Michael Merry & Geert Driessen (2010) WCCES Integration by other means Hindu ...
Michael Merry & Geert Driessen (2010) WCCES Integration by other means Hindu ...
 
Frederik Smit & Geert Driessen (2013) ERNAPE Dealing with street culture in s...
Frederik Smit & Geert Driessen (2013) ERNAPE Dealing with street culture in s...Frederik Smit & Geert Driessen (2013) ERNAPE Dealing with street culture in s...
Frederik Smit & Geert Driessen (2013) ERNAPE Dealing with street culture in s...
 
Frederik Smit & Geert Driessen (2013) ERNAPE Critical lessons from practices ...
Frederik Smit & Geert Driessen (2013) ERNAPE Critical lessons from practices ...Frederik Smit & Geert Driessen (2013) ERNAPE Critical lessons from practices ...
Frederik Smit & Geert Driessen (2013) ERNAPE Critical lessons from practices ...
 
Geert Driessen & Michael Merry (2015) RA The gross and net effects Pres.pdf
Geert Driessen & Michael Merry (2015) RA The gross and net effects Pres.pdfGeert Driessen & Michael Merry (2015) RA The gross and net effects Pres.pdf
Geert Driessen & Michael Merry (2015) RA The gross and net effects Pres.pdf
 
Orhan Agirdag, Geert Driessen & Michael Merry (2015) ESA Is there a Catholic ...
Orhan Agirdag, Geert Driessen & Michael Merry (2015) ESA Is there a Catholic ...Orhan Agirdag, Geert Driessen & Michael Merry (2015) ESA Is there a Catholic ...
Orhan Agirdag, Geert Driessen & Michael Merry (2015) ESA Is there a Catholic ...
 
Geert Driessen (2013) GemOss Onderwijsachterstandenbestrijding Pres.pptx
Geert Driessen (2013) GemOss Onderwijsachterstandenbestrijding Pres.pptxGeert Driessen (2013) GemOss Onderwijsachterstandenbestrijding Pres.pptx
Geert Driessen (2013) GemOss Onderwijsachterstandenbestrijding Pres.pptx
 
Geert Driessen (2016) College RUG Performance differences between religious a...
Geert Driessen (2016) College RUG Performance differences between religious a...Geert Driessen (2016) College RUG Performance differences between religious a...
Geert Driessen (2016) College RUG Performance differences between religious a...
 

Recently uploaded

Web & Social Media Analytics Previous Year Question Paper.pdf
Web & Social Media Analytics Previous Year Question Paper.pdfWeb & Social Media Analytics Previous Year Question Paper.pdf
Web & Social Media Analytics Previous Year Question Paper.pdfJayanti Pande
 
microwave assisted reaction. General introduction
microwave assisted reaction. General introductionmicrowave assisted reaction. General introduction
microwave assisted reaction. General introductionMaksud Ahmed
 
mini mental status format.docx
mini    mental       status     format.docxmini    mental       status     format.docx
mini mental status format.docxPoojaSen20
 
Accessible design: Minimum effort, maximum impact
Accessible design: Minimum effort, maximum impactAccessible design: Minimum effort, maximum impact
Accessible design: Minimum effort, maximum impactdawncurless
 
How to Make a Pirate ship Primary Education.pptx
How to Make a Pirate ship Primary Education.pptxHow to Make a Pirate ship Primary Education.pptx
How to Make a Pirate ship Primary Education.pptxmanuelaromero2013
 
Separation of Lanthanides/ Lanthanides and Actinides
Separation of Lanthanides/ Lanthanides and ActinidesSeparation of Lanthanides/ Lanthanides and Actinides
Separation of Lanthanides/ Lanthanides and ActinidesFatimaKhan178732
 
Advanced Views - Calendar View in Odoo 17
Advanced Views - Calendar View in Odoo 17Advanced Views - Calendar View in Odoo 17
Advanced Views - Calendar View in Odoo 17Celine George
 
Paris 2024 Olympic Geographies - an activity
Paris 2024 Olympic Geographies - an activityParis 2024 Olympic Geographies - an activity
Paris 2024 Olympic Geographies - an activityGeoBlogs
 
1029 - Danh muc Sach Giao Khoa 10 . pdf
1029 -  Danh muc Sach Giao Khoa 10 . pdf1029 -  Danh muc Sach Giao Khoa 10 . pdf
1029 - Danh muc Sach Giao Khoa 10 . pdfQucHHunhnh
 
Interactive Powerpoint_How to Master effective communication
Interactive Powerpoint_How to Master effective communicationInteractive Powerpoint_How to Master effective communication
Interactive Powerpoint_How to Master effective communicationnomboosow
 
Sanyam Choudhary Chemistry practical.pdf
Sanyam Choudhary Chemistry practical.pdfSanyam Choudhary Chemistry practical.pdf
Sanyam Choudhary Chemistry practical.pdfsanyamsingh5019
 
Introduction to ArtificiaI Intelligence in Higher Education
Introduction to ArtificiaI Intelligence in Higher EducationIntroduction to ArtificiaI Intelligence in Higher Education
Introduction to ArtificiaI Intelligence in Higher Educationpboyjonauth
 
Call Girls in Dwarka Mor Delhi Contact Us 9654467111
Call Girls in Dwarka Mor Delhi Contact Us 9654467111Call Girls in Dwarka Mor Delhi Contact Us 9654467111
Call Girls in Dwarka Mor Delhi Contact Us 9654467111Sapana Sha
 
Grant Readiness 101 TechSoup and Remy Consulting
Grant Readiness 101 TechSoup and Remy ConsultingGrant Readiness 101 TechSoup and Remy Consulting
Grant Readiness 101 TechSoup and Remy ConsultingTechSoup
 
Beyond the EU: DORA and NIS 2 Directive's Global Impact
Beyond the EU: DORA and NIS 2 Directive's Global ImpactBeyond the EU: DORA and NIS 2 Directive's Global Impact
Beyond the EU: DORA and NIS 2 Directive's Global ImpactPECB
 
Organic Name Reactions for the students and aspirants of Chemistry12th.pptx
Organic Name Reactions  for the students and aspirants of Chemistry12th.pptxOrganic Name Reactions  for the students and aspirants of Chemistry12th.pptx
Organic Name Reactions for the students and aspirants of Chemistry12th.pptxVS Mahajan Coaching Centre
 
Presentation by Andreas Schleicher Tackling the School Absenteeism Crisis 30 ...
Presentation by Andreas Schleicher Tackling the School Absenteeism Crisis 30 ...Presentation by Andreas Schleicher Tackling the School Absenteeism Crisis 30 ...
Presentation by Andreas Schleicher Tackling the School Absenteeism Crisis 30 ...EduSkills OECD
 
Contemporary philippine arts from the regions_PPT_Module_12 [Autosaved] (1).pptx
Contemporary philippine arts from the regions_PPT_Module_12 [Autosaved] (1).pptxContemporary philippine arts from the regions_PPT_Module_12 [Autosaved] (1).pptx
Contemporary philippine arts from the regions_PPT_Module_12 [Autosaved] (1).pptxRoyAbrique
 

Recently uploaded (20)

Web & Social Media Analytics Previous Year Question Paper.pdf
Web & Social Media Analytics Previous Year Question Paper.pdfWeb & Social Media Analytics Previous Year Question Paper.pdf
Web & Social Media Analytics Previous Year Question Paper.pdf
 
microwave assisted reaction. General introduction
microwave assisted reaction. General introductionmicrowave assisted reaction. General introduction
microwave assisted reaction. General introduction
 
mini mental status format.docx
mini    mental       status     format.docxmini    mental       status     format.docx
mini mental status format.docx
 
Accessible design: Minimum effort, maximum impact
Accessible design: Minimum effort, maximum impactAccessible design: Minimum effort, maximum impact
Accessible design: Minimum effort, maximum impact
 
Mattingly "AI & Prompt Design: Structured Data, Assistants, & RAG"
Mattingly "AI & Prompt Design: Structured Data, Assistants, & RAG"Mattingly "AI & Prompt Design: Structured Data, Assistants, & RAG"
Mattingly "AI & Prompt Design: Structured Data, Assistants, & RAG"
 
How to Make a Pirate ship Primary Education.pptx
How to Make a Pirate ship Primary Education.pptxHow to Make a Pirate ship Primary Education.pptx
How to Make a Pirate ship Primary Education.pptx
 
Separation of Lanthanides/ Lanthanides and Actinides
Separation of Lanthanides/ Lanthanides and ActinidesSeparation of Lanthanides/ Lanthanides and Actinides
Separation of Lanthanides/ Lanthanides and Actinides
 
Advanced Views - Calendar View in Odoo 17
Advanced Views - Calendar View in Odoo 17Advanced Views - Calendar View in Odoo 17
Advanced Views - Calendar View in Odoo 17
 
Paris 2024 Olympic Geographies - an activity
Paris 2024 Olympic Geographies - an activityParis 2024 Olympic Geographies - an activity
Paris 2024 Olympic Geographies - an activity
 
1029 - Danh muc Sach Giao Khoa 10 . pdf
1029 -  Danh muc Sach Giao Khoa 10 . pdf1029 -  Danh muc Sach Giao Khoa 10 . pdf
1029 - Danh muc Sach Giao Khoa 10 . pdf
 
Interactive Powerpoint_How to Master effective communication
Interactive Powerpoint_How to Master effective communicationInteractive Powerpoint_How to Master effective communication
Interactive Powerpoint_How to Master effective communication
 
Sanyam Choudhary Chemistry practical.pdf
Sanyam Choudhary Chemistry practical.pdfSanyam Choudhary Chemistry practical.pdf
Sanyam Choudhary Chemistry practical.pdf
 
Staff of Color (SOC) Retention Efforts DDSD
Staff of Color (SOC) Retention Efforts DDSDStaff of Color (SOC) Retention Efforts DDSD
Staff of Color (SOC) Retention Efforts DDSD
 
Introduction to ArtificiaI Intelligence in Higher Education
Introduction to ArtificiaI Intelligence in Higher EducationIntroduction to ArtificiaI Intelligence in Higher Education
Introduction to ArtificiaI Intelligence in Higher Education
 
Call Girls in Dwarka Mor Delhi Contact Us 9654467111
Call Girls in Dwarka Mor Delhi Contact Us 9654467111Call Girls in Dwarka Mor Delhi Contact Us 9654467111
Call Girls in Dwarka Mor Delhi Contact Us 9654467111
 
Grant Readiness 101 TechSoup and Remy Consulting
Grant Readiness 101 TechSoup and Remy ConsultingGrant Readiness 101 TechSoup and Remy Consulting
Grant Readiness 101 TechSoup and Remy Consulting
 
Beyond the EU: DORA and NIS 2 Directive's Global Impact
Beyond the EU: DORA and NIS 2 Directive's Global ImpactBeyond the EU: DORA and NIS 2 Directive's Global Impact
Beyond the EU: DORA and NIS 2 Directive's Global Impact
 
Organic Name Reactions for the students and aspirants of Chemistry12th.pptx
Organic Name Reactions  for the students and aspirants of Chemistry12th.pptxOrganic Name Reactions  for the students and aspirants of Chemistry12th.pptx
Organic Name Reactions for the students and aspirants of Chemistry12th.pptx
 
Presentation by Andreas Schleicher Tackling the School Absenteeism Crisis 30 ...
Presentation by Andreas Schleicher Tackling the School Absenteeism Crisis 30 ...Presentation by Andreas Schleicher Tackling the School Absenteeism Crisis 30 ...
Presentation by Andreas Schleicher Tackling the School Absenteeism Crisis 30 ...
 
Contemporary philippine arts from the regions_PPT_Module_12 [Autosaved] (1).pptx
Contemporary philippine arts from the regions_PPT_Module_12 [Autosaved] (1).pptxContemporary philippine arts from the regions_PPT_Module_12 [Autosaved] (1).pptx
Contemporary philippine arts from the regions_PPT_Module_12 [Autosaved] (1).pptx
 

Geert Driessen (2012) AERA Trends in Educational Disadvantage in Dutch Elementary School

  • 1. Trends in Educational Disadvantage in Dutch Elementary School Dr Geert Driessen ITS, Radboud University Nijmegen, the Netherlands g.driessen@its.ru.nl www.geertdriessen.nl Paper presented at the Annual Meeting of AERA Vancouver, BC, Canada, April 13-17, 2012 Invited session The Cohort Study on Educational Careers in Primary en Secondary Education COOL5-18 Sponsored by The Dutch Program Council for Education Research (PROO), The Netherlands Organization for Scientific Research (NWO)
  • 2. Geert Driessen Trends in Educational Disadvantage in Dutch School 2 Trends in Educational Disadvantage in Dutch Elementary School Dr Geert Driessen ITS, Radboud University Nijmegen, the Netherlands 1. Background 1.1 Current policy on educational disadvantage For almost half a century now, policy has existed in the Netherlands to improve the educational chances of children from situations of disadvantage (Driessen, 2012). This policy has gradually changed with regard to predominantly organization and funding but also new policy domains, themes, objectives and target groups have been defined. In the 1970s, following the example of the USA, compensation programs were developed and implemented to help working class children in a number of large cities in the Netherlands. This local policy was later expanded to become national policy and, in addition to this policy, policy was developed to improve the educational opportunities of minority children. Half way through the 1980s, these two lines of policy were integrated into a single educational disadvantage policy. Initially, this policy was steered by the Ministry of Education. It was later decentralized to the local authorities and school administrations. Specific target groups were identified within the groups of minority and non- minority students but, under the influence of political-societal developments, the ethnic component was omitted in 2006 (Driessen & Merry, 2011; Vasta, 2007). Since that time, no distinction has been made between minority versus non-minority disadvantaged children. And over the years, the focus of policy has shifted from the reduction of educational disadvantage to the prevention of such disadvantage. Increased emphasis is being placed on the preschool and early phases of education and thus the prevention of delays among children in play and preschool groups. The core of the policy involves the allocation of extra financial resources to elementary schools with a given percentage of their students coming from the target groups. This policy instrument is known as “weighted student funding.” The less favorable the home situation, the higher the weighting and the more money the school receives (Ladd & Fiske, 2009). The indicators used to identify target group children and thus the student weighting have been changed on a number of occasions. At this point, the target group consists of parents with little education. Substantively, the emphasis has always been on improving the language and math skills of the children. However, the schools are free in principle to spend the extra funds received from the Ministry of Education as they see fit. 1.2 Monitoring of disadvantage The Dutch educational disadvantage policy has been accompanied from the beginning by large-scale, long-term evaluations (Stevens et al., 2011). This was already the case for the local compensation programs in large cities and continued to be the case for national policy. With the introduction of the educational disadvantage policy in 1985, the large-scale LEO (National Evaluation of the Educational Priority Policy) cohort study was launched (van der Werf, 1995). In 1994, following three biennial measurement moments, a transition was made to the PRIMA cohort study, which entailed six biennial measurement moments (Driessen, Sleegers, & Smit, 2008). In 2007, the PRIMA studied was
  • 3. Geert Driessen Trends in Educational Disadvantage in Dutch School 3 followed by the COOL5-18 cohort study (Driessen & Merry, 2011) with the second measurement occasion held in 2007 and the third planned for 2013. The immense amount of data collected during the cohort studies provides not only an important part of the input for the evaluation of the policy being conducted but is also frequently used to monitor the educational position of the target groups (Driessen, 2009; Herweijer, 2009; Mulder, 1996). 1.3 Prior research In an extended series of studies, the development of the school careers of disadvantaged students has been examined. To give you an impression of the insights provided by the studies to date, the most important findings can be summarized briefly. To do this, we will make use of primarily the review provided by Ledoux and Veen (2009). In addition, we will call upon the studies by Mulder (1996), van Langen and Suhre (2001) and Dagevos and Gijsberts (2009). All of these studies are based on analyses of the databases from the LEO, PRIMA, and COOL cohort studies or — in other words — large-scale national studies of the school careers and achievement of students in elementary education across the period 1988–2007. 1.3.1 Starting differences In the second grade of Dutch elementary school (i.e. when the children are 6 years of age),1 the achievement differences between target group students and non-target group students are large. In particular, Turkish and Moroccan students (i.e., children of so-called “guest workers” in the Netherlands) start their school careers with large delays in both the areas of language and — to a lesser degree — math. In the most recent cohorts, however, a reduction in the initial differences can be seen. Turkish and Moroccan children but also non-minority children of low-educated parents are moving towards the starting level for non-target group students in both the areas of language and math. The gap between target and non-target group students is nevertheless far from being bridged. 1.3.2 Development of minority target group students During the first cohort studies, one could speak of no or at most marginal development in the achievement of target group students. Later cohort studies show some catching up to occur relative to the non-target group students during the course of elementary education for the minority target group students. By grade 8 (i.e., the last grade of Dutch elementary school), the differences in language achievement levels have shrunk — but are still clearly present — while the differences in math achievement levels have largely disappeared — with particularly Moroccan students catching up almost completely. This gain is largely achieved in the upper levels of elementary school (i.e., grades 6 - 8). 1. Dutch elementary schools are for 4- to 12-year-olds and consist of 8 grades. In grades 1 and 2, play takes a central place, but also pre-reading, pre-math, and pre-writing activities commence. In grade 3, formal instruction in reading, math, and writing starts. After the last grade in elementary school, grade 8, the students move on to secondary school. Depending on their attainment levels, they continue in one of the following four tracks of secondary school: special needs education, pre-vocational education, senior general education, or pre-university education (MinOCW, 2007). For an overview, see Appendix 1.
  • 4. Geert Driessen Trends in Educational Disadvantage in Dutch School 4 1.3.3 Development of non-minority target group students A similarly positive development is not seen to occur for non-minority target group students (i.e., the children of low-educated native Dutch parents). In fact, the achievement delays among this group of students relative to the group of non-target students have increased rather than decreased with the delays in math larger than the delays in language. Compared to minority target group students at this moment, non-minority target group students thus perform better in the area of language but not math. 1.3.4 Progression to higher forms of education One can speak of a major increase in the percentage of target group students who progress to a higher level of secondary education. For minority target group students, the increase is predominantly due to the achievements of Surinamese students (i.e., children from a former Dutch colony) and Moroccan students. Non-target group students still progress more than twice as often to a higher level of secondary education than target group students. One can thus speak of perceptible progress among target group students but little catching up to the non-target group students. 1.3.5 In sum Positive gains can be observed for the language and math achievements of minority target group children across the period 1988–2007, but they still have the lowest language scores in the final year of elementary school — scores which are lower than those for non-minority target group students. No positive gains are observed for the elementary school achievements of non-minority target group students. While their starting delays are largely made up during the course of their elementary school careers and the progression to higher forms of secondary education improves for both minority and non-minority target group students, non-target group students still progress considerably more often than target group students to higher levels of secondary education. 2 Definition of the problem In the present research, we examined how the language and math achievements of the students targeted by Dutch educational disadvantage policy developed during the period 1994–2007. The central question was whether the delays of specific groups of students decreased with respect to a reference group of students during this period. We examined developments in the language and math skills of different groups of students between grades 2 and 8 in order to answer this question. As already noted, the weighted student funding criteria and the target groups distinguished using this information have changed on a number of occasions over the years. With the use of a separate set of groups identified specifically for the present research, it was possible to trace the development of different categories of students in considerable detail. 3 Method 3.1 Sample To map student gains in elementary education, we used the data collected on the different measurement occasions for the PRIMA cohort studies and the first measurement occasion for the COOL cohort study. PRIMA started with the first measurement occasion in 1994 and collected
  • 5. Geert Driessen Trends in Educational Disadvantage in Dutch School 5 information on students in grades 2, 4, 6 and 8. Measurement was then repeated every two years through 2004. The Netherlands has some 7000 elementary schools, and a total of some 60,000 students from 600 elementary schools participated in each PRIMA measurement occasion (Driessen et al., 2006). The PRIMA studied was followed by the COOL study in 2007 when information was collected from some 38,000 students in grades 2, 5 and 8 in 550 schools (Driessen et al., 2009; Roeleveld et al., 2011). One can speak of an overrepresentation of schools with many disadvantaged students in the PRIMA and COOL samples. This is intentional and aimed at obtaining sufficient numbers of students for smaller categories of disadvantaged students. Furthermore, disadvantaged students and particularly minority disadvantaged students tend to be concentrated in particular schools. The over- representation of these schools in a sample thus provides a “typical” picture of the minority disadvantaged student. The aim of the present research was also not to obtain a representative picture of the positions of disadvantaged students in the Netherlands but to trace developments within the groups of students targeted by educational disadvantage policy, which means that over-representation is not a problem. For the present analyses, we used the data collected in the years 1994, 1998, and 2002 for the PRIMA study and the year 2007 for the COOL study. The information from students in grades 2 and 8 was selected to represent the start and end points of elementary education. In grade 2, the children receive preparatory reading and math instruction. Grade 8 is the last year of Dutch elementary school; students at the age of about 12 years then proceed to secondary school. 3.2 Measurement instruments and sample characteristics Two types of data stand central in the present research: namely, the social-ethnic backgrounds of the students and their language and math skills during elementary school. The information regarding the social-ethnic backgrounds of the students is based upon the parental level of education and parental place of birth. We first determined the minority versus non- minority status of the parents on the basis of their country of birth and then their levels of education. Within the group of low-educated minority parents, we next distinguished the largest countries of origin: Turkey, Morocco (former guest worker countries for the Netherlands); Suriname and the Dutch Antilles (former colonies of the Netherlands); and other non-Western countries. An overview of the categories used in this study is presented in Table 1.
  • 6. Geert Driessen Trends in Educational Disadvantage in Dutch School 6 Table 1 - Social-ethnic background categories of students Categories Labels Indicators Non-minority Senior vocational plus N-e both parents more than pre-vocational education, at least one higher professional or university education Senior vocational*** N-d both parents senior vocational education Pre-vocational plus** N-c one parent no more than pre-vocational education, the other more Pre-vocational* N-b both parents no more than pre-vocational education Elementary plus* N-a both parents no more than pre-vocational education, at least one no more than elementary school Minority Senior vocational plus M-e both parents more than pre-vocational education, at least one higher professional or university education Senior vocational M-d both parents senior vocational education Pre-vocational plus** M-c one parent no more than pre-vocational education, the other more Pre-vocational* M-b both parents no more than pre-vocational education Elementary plus* M-a both parents no more than pre-vocational education, at least one no more than elementary school * Currently the group targeted by educational disadvantage policy. ** Group also targeted by educational disadvantage policy up until 2006. *** Reference category for present analyses. The language and math skills in both of the cohort studies were measured using the standardized tests developed by the National Institute for Educational Measurement (CITO). The test results are expressed as so-called skill scores for language and math. In the period we studied, the exact same tests were not always used on each measurement occasion. This does not constitute a problem for our analyses, however, as we did not compare actual test scores across cohorts but, rather, the relative positions of the categories of students with respect to each other and any changes in these over time. The tests need not measure exactly the same for this, provided all the students in a cohort have completed the same tests (which is the case). 3.3 Data analysis To map the developments of the students, the mean scores for the categories of students we distinguished were compared to the mean scores for a reference category, which was the category of non-target students of parents who both have more than a high school but no college education (i.e., some form of vocational education). To gain insight into the magnitude of the differences, a so-called effect size (ES) was calculated for each difference (Thompson, 1998). Effect sizes have the advantage of not depending on the size of a sample and, because they involve a standardized coefficient, indicators from different domains can be compared to each other (Coe, 2002). Another advantage is that the research results can be summarized concisely. In its most simple form, an ES is the difference between the means (i.e., test scores here) for two groups divided by the pooled standard deviation; this ES is referred to as the Cohen’s d. With regard to the interpretation of an ES, the rule of thumb provided by Cohen (1988) is usually followed, namely that a coefficient with a value of 0.20 is
  • 7. Geert Driessen Trends in Educational Disadvantage in Dutch School 7 considered “small,” one with a coefficient of 0.50 “medium,” and one with a coefficient of 0.80 “large.” 4 Results 4.1 Language skill In Figures 1 and 2, the effect sizes for language skills are presented for the grade 2 and 8 groups of children, respectively. Figure 1 - Language skills of children in grade 2 between 1994 and 2007 according to social-ethnic background (effect sizes; reference category: Non-minority, maximum of senior vocational education (N-d)) 1994 1998 2002 2007 N-e 0,20 0,17 0,25 0,19 N-d -0,05 -0,08 -0,08 -0,14 N-b -0,32 -0,37 -0,42 -0,32 N-a -0,54 -0,51 -0,77 -0,64 M-e -0,33 -0,35 -0,47 -0,49 M-d -0,50 -0,81 -0,76 -0,84 M-c -0,61 -0,79 -0,98 -0,81 M-b -0,83 -0,96 -1,09 -0,92 M-a -1,30 -1,22 -1,25 -1,09 -1,40 -1,20 -1,00 -0,80 -0,60 -0,40 -0,20 0,00 0,20 0,40 This figure and the following figures can be interpreted as follows. From the first row, it can be seen that in 1994 the standardized difference (ES) between the non-minority (i.e., native Dutch) students with high educated parents (N-e) and the reference category of non-minority students who have parents with no more than a senior vocational education (N-d) is 0.20. This is a small positive effect: The language skills of the children of non-minority, high educated parents are slightly better than those of the children in the reference category. The figures from 1998, 2002, and 2007 show the size of the differences between the two categories of students to remain more or less the same. The second row in the table shows the differences between the non-minority disadvantaged category of students
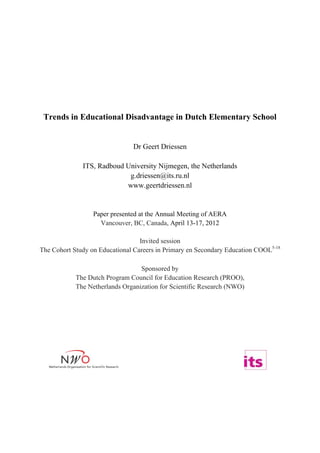
  • 8. Geert Driessen Trends in Educational Disadvantage in Dutch School 8 who were a target of educational disadvantage policy up until 2006 (N-c) relative to the reference category. For 1994, the ES is -0.05, which is a very slight negative effect: The grade 2 language skills of the students previously considered disadvantaged are minimally poorer than those of the students in the reference category. On the subsequent two measurement occasions, this effect remains stable. In 2007, however, the negative effect has increased to -0.14. Apart from the fact that the difference is quite small, this finding shows the difference with respect to the reference category to have increased and the language skills of the grade 2 students in question to thus lag further behind than was previously the case. With regard to the language skills of the grade 2 students across the period examined, one can hardly speak of improvement. Some minor differences can be seen to occur between measurement points, but these do not persist. Progress can only be seen for the heavily disadvantaged category of minority students (M-a) on the last measurement occasion with respect to previous occasions, but the question is whether this improvement persists in later years. Figure 2 - Language skills of children in grade 8 between 1994 and 2007 according to social-ethnic background (effect sizes; reference category: Non-minority, maximum of senior vocational education (N-d)) 1994 1998 2002 2007 N-e 0,27 0,31 0,33 0,39 N-d -0,23 -0,19 -0,14 -0,24 N-b -0,53 -0,51 -0,49 -0,57 N-a -0,85 -0,70 -0,65 -0,72 M-e -0,26 -0,29 -0,13 0,01 M-d -0,68 -0,61 -0,47 -0,40 M-c -0,83 -0,78 -0,64 -0,45 M-b -1,01 -0,98 -0,83 -0,75 M-a -1,57 -1,35 -1,12 -0,76 -2,00 -1,50 -1,00 -0,50 0,00 0,50 All of the minority categories of students in grade 8 show progress across the period we examined with strongly positive development standing out for the category of heavily disadvantaged students (M-a) in particular: During the period under study, their delay with respect to the reference group decreased by 50%.
  • 9. Geert Driessen Trends in Educational Disadvantage in Dutch School 9 When further subdivided according to country of origin, the grade 2 difference between the Turkish children and the reference category decreased across the period under study; they were thus catching up to the students in the reference category. In grade 8, this is found to be the case for more of the minority categories of students and then between the next-to-last and last measurement occasions in particular. 4.2 Math skill In Figures 3 and 4, the effect sizes are presented for the math skills of the students in grades 2 and 8, respectively. Figure 3 - Math skills of children in grade 2 between 1994 and 2007 according to social-ethnic background (effect sizes; reference category: Non-minority, maximum of senior vocational education (N-d)) 1994 1998 2002 2007 N-e 0,18 0,20 0,29 0,24 N-d -0,17 -0,10 -0,04 -0,12 N-b -0,43 -0,38 -0,36 -0,31 N-a -0,63 -0,57 -0,63 -0,52 M-e -0,23 -0,18 -0,25 -0,23 M-d -0,51 -0,59 -0,49 -0,56 M-c -0,60 -0,58 -0,60 -0,49 M-b -0,81 -0,72 -0,73 -0,64 M-a -1,07 -0,93 -0,78 -0,66 -1,20 -1,00 -0,80 -0,60 -0,40 -0,20 0,00 0,20 0,40 Once again, the position of the heavily disadvantage minority children in grade 2 (M-a) can be seen to have markedly improved during the period under study.
  • 10. Geert Driessen Trends in Educational Disadvantage in Dutch School 10 Figure 4 - Math skills of children in grade 8 between 1994 and 2007 according to social-ethnic background (effect sizes; reference category: Non-minority, maximum of senior vocational education (N-d)) 1994 1998 2002 2007 N-e 0,19 0,32 0,34 0,35 N-d -0,16 -0,17 -0,18 -0,16 N-b -0,50 -0,50 -0,52 -0,42 N-a -0,81 -0,72 -0,74 -0,48 M-e -0,23 -0,02 0,07 0,13 M-d -0,52 -0,34 -0,35 -0,32 M-c -0,54 -0,56 -0,40 -0,25 M-b -0,73 -0,76 -0,66 -0,56 M-a -0,98 -0,73 -0,69 -0,44 -1,20 -1,00 -0,80 -0,60 -0,40 -0,20 0,00 0,20 0,40 0,60 What stands out for the math skills of the students in grade 8 during the period under study is improvement in the relative positions of both the minority and non-minority disadvantaged categories of students (N-a, N-b, M-a, M-b). When we further subdivided the data from the minority children according to country of origin, a slight decrease in the disadvantage can be seen to occur for the math skills of the grade 2 students and particularly the Turkish students across the period under study. In grade 8, the gains in the category of other non-Western disadvantaged students stand out in particular. 4.3 Reduction of language and math delays For purposes of the present study, we compared categories of students formed on the basis of the criteria used to determine weighted student funding. Given that these criteria have changed on a number of occasions over the years, we adopted a highly differentiated set of ten categories. In educational disadvantage policy, certain objectives are formulated in terms of a reduction in the delays of target group students relative to non-target group students (MinOCW, 2010). By the end of elementary school in the period 2002–2014, for example, language delays should be reduced by 40%; in the period 2008–2011, this should be 20%.
  • 11. Geert Driessen Trends in Educational Disadvantage in Dutch School 11 In Table 2, we present the results of our analyses showing the degree of reduction in grade 8 for delays in the language skills of the disadvantaged groups of students. The relative differences in the effect sizes for the first and final measurement occasions were calculated for this purpose. For the sake of completeness, we also did this for their math skills. Different comparisons are presented in the table. The changes for the entire target group (i.e., minority plus non-minority students) relative to the non-target group are shown, for example. We then split the total target group into minority versus non-minority disadvantaged groups. And we examine the size of the changes between 1994 and 2007, on the one hand, and 2002 and 2007, on the other hand, that is, the full period under study here and the most recent period under study here, respectively. Table 2 - Differences in the grade 8 language and math skills of target versus non-target group students in 1994, 2002, and 2007 (effect sizes), reduction of delays between 1994 and 2007, and reduction of delays between 2002 and 2007 (in %). Categories 1994 2002 2007 1994–2007 2002–2007 Total target vs. non-target Language skill -0.77 -0.71 -0.61 21% 14% Math Skill -0.62 -0.61 -0.47 24% 23% Non-minority target vs. non-target Language skill -0.50 -0.47 -0.53 -6% -13% Math skill -0.49 -0.55 -0.45 8% 18% Minority target vs. non-target Language skill -1.24 -0.96 -0.67 46% 30% Math skill -0.82 -0.67 -0.49 40% 27% Inspection of the upper part of the table shows major reductions in the delays of the total target group relative to the non-target group for the period 1994–2007. For their language skills, the target group can be seen to have gained 21% on the non-target group. For their math skills, the gain is even larger than for their language skills, namely 24%. In the period 2002–2007, which obviously is shorter, the gain for language skills is more limited with 14% but still 23% for math skills. When the total target group is subdivided into the categories of minority versus non-minority disadvantaged students, a much more differentiated picture presents itself. The minority target group has made major gains: a minimum of 40% for the period 1994–2007 and more than 27% for the period 2002–2007. For the non-minority target group, however, the developments are not nearly so favorable. In the period 1994–2007, their language skills have either hardly improved or — worse yet — declined relative to the non-target group; in the period 2002–2007, a deterioration of 13% relative to the non-target group can be seen. For their math skills, in contrast, some positive developments can be seen: an almost 10% gain in the period 1994–2007 and almost 20% gain in the period 2002–2007.
  • 12. Geert Driessen Trends in Educational Disadvantage in Dutch School 12 5 Conclusions and discussion 5.1 Conclusions Throughout the period we studied, the position of the grade 2 children’s language skills went virtually unchanged. In grade 8, however, the minority target group students show major gains in the position of their language skills relative to the non-minority reference category. And similar major gains are seen for the math skills of the minority target group in both grades 2 and 8. For the situation in grade 8 of elementary school, we examined the extent to which the delays of the target groups were reduced. This indeed happened in both the periods 1994–2007 and 2002– 2007. The results of our analyses nevertheless point to large differences between the minority and non-minority target groups. The minority target group made major gains: a minimum of 40% in the period 1997–2007 and more than 25% in the period 2002–2007. The development of the non- minority target group less rose colored. In the period 1994–2007, one can speak of hardly any progress and even a slight decline in the group’s language skills. In the period 2002–2007, there is a deterioration of almost 15%. With respect to the group’s math skills, positive gains can be seen: almost 10% for the period 1994–2007 and almost 20% for the period 2002–2007. The central question in this study was whether the delays of the different groups targeted by Dutch educational disadvantage policy during the past decades have diminished or not. The results presented here are in line with those of previous overviews (Driessen, 2009; Mulder et al., 2005; van Langen & Suhre, 2001; Vogels & Bronnemans-Helmers, 2003). In short, the conclusion is that large differences exist between disadvantaged and non-disadvantaged students at the start of elementary school. Minority target group students have a substantial language delay. In the last year of elementary school, this delay has diminished somewhat but it is still substantial. The delays of the minority target group students have declined over the years and in the period 1994–2007 by more than 40%. Part of the non-minority target group students also made gains, but these are less than those observed for the minority target group students. Moreover, for the period 2002–2007, the relative position of the non-minority target group students with regard to their language skills can be seen to deteriorate. 5.2 Discussion Various explanations can be offered for the gains made by the minority target group students. To start with, there is the fact that the length of residence in the Netherlands for the minority students has increased and many of them belong to the second or even third generation of immigrants (cf. Mulder, 1996). Such demographic developments generally exert a positive effect on the Dutch language skills of not only parents but also children (Driessen & Merry, 2011). Second, minority parents from later generations also tend to be higher educated than minority parents from first generations. They can thus be expected to have greater “cultural capital” at their disposal, know Dutch society better, and be able to give their children more support with respect to school matters than first-generation immigrant parents. Third, it is also the case that teachers have gained more experience with interacting with minority students and learned to better adapt their teaching to the specific situations of these students. Teachers may have raised their expectations for such students over the years (van den Bergh et al., 2010). Fourth, part of the explanation may also lie in the effects of educational disadvantage policy, but convincing evidence for this is still lacking. Particularly those programs conducted within the
  • 13. Geert Driessen Trends in Educational Disadvantage in Dutch School 13 framework of Preschool and Early Childhood Education and especially those aimed at improving the language skills of minority target group students presumably play a role. It is very much the question if the positive developments observed over the years for minority target group students will continue through the coming years. The changes made in weighted student funding in 2006 have done away with the ethnic component of the equation. For the allocation of extra resources to schools, it no longer matters if the child’s parents were born in a foreign country; the only criterion is now the level of parental education. The consequences of this for special attention to the relevant children in the class are thus as yet unclear. Compared to the development of the minority target group students, the development of the non-minority target group students proceeds less successfully and one can even speak of a relative decline. It is also regularly asked if all the policy attention for minority target group students does not occur at the cost of attention for non-minority target group students. For Vogels and Bronneman- Helmers (2003), this is a reason to refer to the latter group as the “forgotten group.” These authors offer some other possible explanations for the relative decline in the school achievement of non- minority disadvantaged students although it should be noted that it would be very difficult to test these empirically. One explanation might nevertheless be that one can speak of underutilization or insufficient use of the talents and potential of minority students due to their immigrant histories while the reservoir of unused or potential talent among non-minority disadvantaged students is simply more limited to start with. The previously unused talent among non-minority disadvantaged students has, according to this explanation, now been used to its maximum: A ceiling has been reached with regard to inherited capacities and talent. Another explanation for the relative decline points to the marginal level of ambition among low educated non-minority parents in rural areas of the Netherlands (van Ruijven, 2003). This stands in shrill contrast to the high — but often unrealistic — level of ambition among minority parents located in urban areas of the country (Driessen, Smit, & Klaassen, 2011). If this is indeed the case, it can nevertheless only be part of the explanation. Research shows, namely, large variation in the achievement levels of rural students depending on location: they invariably perform poorly in the northern provinces (Friesland, Groningen, Drenthe) but well in the southern province of Limburg (Driessen & Withagen, 1999). One explanation that is frequently offered for this variation points to the possibly negative effects of speaking a dialect. Once again, however, there is only very weak empirical evidence for this: The regional variation is quite marked and one can even speak of a positive effect of speaking the dialect in the province of Limburg (cf. Driessen, 2005). According to the Dutch Education Inspectorate (Inspectie van het Onderwijs, 2001), the achievement differences between the northern and southern rural areas of the Netherlands stem primarily from differences in the quality of the instructional materials, which are often quite limited in the small rural schools located in the northern provinces (also see van Ruijven, 2003). In addition to this, there is often little opportunity to provide sufficient extra attention, such as remedial teaching and student guidance, for those students who need it in such small schools. But it is precisely in these schools that more care is needed because there are also fewer opportunities for special education and thus chances for referral. A final explanation offered by Vogels and Bronneman-Helmers (2003) is the limited extra resources allocated to rural schools in terms of weighted student funding. In 2006, steps were taken to deal with this critique and extra resources were made available for rural areas of the Netherlands. We must nevertheless wait to see what the consequences of these measures are for
  • 14. Geert Driessen Trends in Educational Disadvantage in Dutch School 14 actual educational practice and whether it is really possible to turn the tide for non-minority disadvantaged students without this happening at the cost of minority disadvantaged students. And underlying all of this is the question of the extent to which extra financial means directly translate into better achievement (cf. Mulder, 1996). References Coe, R. (2002). It’s the effect size, stupid! What effect size is and why it is important. Paper presented at the British Educational Research Association annual conference, Exeter, 12-14 September, 2002. Cohen, J. (1988). Statistical power analysis for the behavioral sciences. Hillsdale, NJ: Erlbaum. Dagevos, J., & Gijsberts, M. (Eds.) (2009). Jaarrapport integratie 2009. WODC/SCO/CBS. Den Haag: SCP. Driessen, G. (2005). In Dutch? Usage of Dutch regional languages and dialects. Language, Culture and Curriculum, 18(3), 271-285. Driessen, G. (2009). Prestaties, gedrag en houding van basisschoolleerlingen. Stand van zaken in 2008 en ontwikkelingen sinds 2001. Nijmegen: ITS. Driessen, G. (2012). Combating ethnic educational disadvantage in the Netherlands. An analysis of policies and effects. In C. Kassimeris & M. Vryonides (Eds.), The politics of education Challenging multiculturalism (pp. 31-51). New York: Routledge. Driessen, G., & Merry, M. (2011).The effects of the integration and generation of immigrants on language and numeracy achievement. Educational Studies, 37(5), 581-592. Driessen, G., & Withagen, V. (1999). Language varieties and educational achievement of indigenous primary school pupils. Language, Culture and Curriculum, 12(1), 1-22. Driessen, G., Sleegers, P., & Smit, F. (2008). The transition from primary to secondary education: Meritocracy and ethnicity. European Sociological Review, 24(4), 527-542. Driessen, G., Smit, F., & Klaassen, C. (2011). Connecting ethnic minority parents to school. From empirical research to practical suggestions. Journal of Education Research, 4(1), 9-20. Driessen, G., van Langen, A., & Vierke, H. (2006). Basisonderwijs: Veldwerkverslag, leerlinggegevens en oudervragenlijsten. Basisrapportage PRIMA-cohortonderzoek. Zesde meting 2004-2005. Nijmegen: ITS. Driessen, G., Mulder, L., Ledoux, G., Roeleveld, J., & van der Veen, I. (2009). Cohortonderzoek COOL5-18 . Technisch rapport basisonderwijs, eerste meting 2007/08. Nijmegen: ITS/ Amsterdam: SCO-Kohnstamm Instituut. Herweijer, L. (2009). Making up the gap. Migrant education in the Netherlands. Den Haag: SCP. Inspectie van het Onderwijs (2001). Onderwijsverslag over het jaar 2000. Utrecht: Inspectie van het Onderwijs. Ladd, H., & Fiske, E. (2009). The Dutch experience with weighted student funding: Some lessons for the U.S. Durham, NC: Duke University. Ledoux, G., & Veen, A. (2009). Beleidsdoorlichting onderwijsachterstandenbeleid. Periode 2002- 2008. Amsterdam: SCO-Kohnstamm Instituut. Min OCW (2007). The education system in the Netherlands 2007. Den Haag: Ministerie van OCW.
  • 15. Geert Driessen Trends in Educational Disadvantage in Dutch School 15 MinOCW (2010). Rijksbegroting 2010. VIII Onderwijs, Cultuur en Wetenschap. Den Haag: Ministerie van OCW. Mulder, L. (1996). Meer voorrang, minder achterstand? Het Onderwijsvoorrangsbeleid getoetst. Nijmegen: ITS. Mulder, L., Roeleveld, J., van der Veen, I., & Vierke, H. (2005) Onderwijsachterstanden tussen 1988 en 2002: ontwikkelingen in basis- en voortgezet onderwijs. Nijmegen/Amsterdam: ITS/SCO- Kohnstamm Instituut Roeleveld, J., Driessen, G., Ledoux, G., Cuppen, J. & Meijer, J. (2011). Doelgroepleerlingen in het basisonderwijs; historische ontwikkeling en actuele situatie. Amsterdam/Nijmegen: SCO- Kohnstamm Instituut/ITS. Stevens, P., Clycq, N., Timmerman, C., & Van Houtte, M. (2011). Researching race/ethnicity and educational inequality in the Netherlands: A critical review of the research literature between 1980 and 2008. British Educational Research Journal, 37(1), 5-43. Thompson, B. (1998). Five methodology errors in educational research: The pantheon of statistical significance and other faux pas. Invited address AERA annual meeting, San Diego, US, April 1998. Vasta, E. (2007). From ethnic minorities to ethnic majority policy: Multiculturalism and the shift to assimilationism in the Netherlands. Ethnic and Racial Studies, 30(5), 713-740. Vogels, R., & Bronnemans-Helmers, R. (2003). Autochtone achterstandsleerlingen: een vergeten groep. Den Haag: SCP. Van den Bergh, L., Denessen, E., Hornstra, L., Voeten, M., & Holland, R. (2010).The implicit prejudiced attitudes of teachers relations to teacher expectations and the ethnic achievement gap. American Educational Research Journal, 47( 2), 497-527. Van der Werf, M. (1995). The Educational Priority Policy in the Netherlands. Content, implementation and outcomes. Den Haag: SVO. Van Langen, A., & Suhre, C. (2001). Ontwikkelingen in de schoolloopbanen van achterstandsleerlingen. Vergelijkende analyses van een aantal leerlingcohorten in basis- en voortgezet onderwijs. Nijmegen: ITS. Van Ruijven, E. (2003). Voorsprong of achterstand? Onderzoek naar het onderwijsniveau van de Friese leerlingen in het basisonderwijs en het voortgezet onderwijs. Ljouwert: Fryske Akademy.
  • 16. Geert Driessen Trends in Educational Disadvantage in Dutch School 16 Appendix 1 - An overview of the Dutch education system Elementary education Pre- university education (VWO) Senior general secondary education (HAVO) Pre-vocational secondary education (VMBO) Senior secondary vocational education (MBO) Higher professional education (HBO) University (WO) Basic secondary education Age 4 Age 12 Age 18 Specialelementary education Specialsecondary education Practical training (PRO)