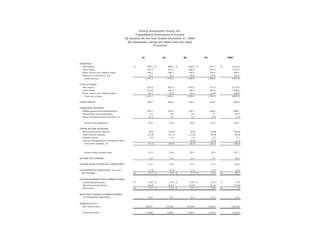
1. Asbury Automotive Group, Inc.
Consolidated Statements of Income
By Quarter for the Year Ended December 31, 2006
(In thousands, except per share and unit data)
(Unaudited)
Q1 Q2 Q3 Q4 2006
REVENUES:
New vehicle $ 798.1 $ 896.0 $ 890.4 $ 831.7 $ 3,416.2
Used vehicle 347.9 373.2 382.0 334.4 1,437.5
Parts, service and collision repair 166.5 168.5 168.2 163.5 666.7
Finance and insurance, net 34.7 42.1 40.0 37.6 154.4
Total revenues 1,347.2 1,479.8 1,480.6 1,367.2 5,674.8
COST OF SALES:
New vehicle 741.8 833.6 827.6 771.0 3,174.0
Used vehicle 315.8 339.3 346.4 303.5 1,305.0
Parts, service and collision repair 83.5 83.3 82.2 79.8 328.8
Total cost of sales 1,141.1 1,256.2 1,256.2 1,154.3 4,807.8
GROSS PROFIT 206.1 223.6 224.4 212.9 867.0
OPERATING EXPENSES:
Selling, general and administrative 160.7 165.9 169.1 165.0 660.7
Depreciation and amortization 4.9 5.0 5.0 5.1 20.0
Other operating expense (income), net (0.1) 0.9 0.5 (2.7) (1.4)
Income from operations 40.6 51.8 49.8 45.5 187.7
OTHER INCOME (EXPENSE):
Floor plan interest expense (8.9) (10.8) (9.9) (10.8) (40.4)
Other interest expense (11.0) (11.1) (11.2) (10.9) (44.2)
Interest income 0.8 1.0 1.5 1.8 5.1
Loss on extinguishment of long-term debt - - (0.9) (0.2) (1.1)
Total other expense, net (19.1) (20.9) (20.5) (20.1) (80.6)
Income before income taxes 21.5 30.9 29.3 25.4 107.1
INCOME TAX EXPENSE 8.0 11.6 11.0 9.7 40.3
INCOME FROM CONTINUING OPERATIONS 13.5 19.3 18.3 15.7 66.8
DISCONTINUED OPERATIONS, net of tax (1.0) (0.3) (1.1) (3.7) (6.1)
NET INCOME $ 12.5 $ 19.0 $ 17.2 $ 12.0 $ 60.7
DILUTED EARNINGS PER COMMON SHARE:
Continuing operations $ 0.40 $ 0.57 $ 0.54 $ 0.46 $ 1.96
Discontinued operations (0.03) (0.01) (0.03) (0.11) (0.18)
Net income $ 0.37 $ 0.56 $ 0.51 $ 0.35 $ 1.78
WEIGHTED AVERAGE COMMON SHARES
OUTSTANDING (DILUTED): 33.6 33.7 33.8 34.2 34.1
VEHICLES SOLD:
New vehicle units 26,057 29,222 29,228 25,831 110,338
Used retail units 14,989 15,891 16,613 14,366 61,859
2. Asbury Automotive Group, Inc.
Consolidated Statements of Income
By Quarter for the Year Ended December 31, 2007
(In thousands, except per share and unit data)
(Unaudited)
Q1 Q2 Q3 Q4 2007
REVENUES:
New vehicle $ 813.7 $ 881.8 $ 882.7 $ 800.9 $ 3,379.1
Used vehicle 372.0 387.9 370.8 324.2 1,454.9
Parts, service and collision repair 172.3 174.0 174.6 177.8 698.7
Finance and insurance, net 38.2 42.9 41.8 39.0 161.9
Total revenues 1,396.2 1,486.6 1,469.9 1,341.9 5,694.6
COST OF SALES:
New vehicle 754.8 820.2 819.1 745.4 3,139.5
Used vehicle 336.5 353.8 341.6 299.6 1,331.5
Parts, service and collision repair 83.7 83.2 83.5 87.4 337.8
Total cost of sales 1,175.0 1,257.2 1,244.2 1,132.4 4,808.8
GROSS PROFIT 221.2 229.4 225.7 209.5 885.8
OPERATING EXPENSES:
Selling, general and administrative 170.9 170.8 173.5 167.2 682.4
Depreciation and amortization 5.3 5.3 5.3 5.5 21.4
Other operating expense (income), net 2.7 (0.2) (0.3) (1.2) 1.0
Income from operations 42.3 53.5 47.2 38.0 181.0
OTHER INCOME (EXPENSE):
Floor plan interest expense (11.1) (11.0) (10.4) (10.5) (43.0)
Other interest expense (11.9) (9.1) (9.1) (9.1) (39.2)
Interest income 2.0 1.0 0.9 0.4 4.3
Loss on extinguishment of long-term debt (17.7) (0.8) - - (18.5)
Total other expense, net (38.7) (19.9) (18.6) (19.2) (96.4)
Income before income taxes 3.6 33.6 28.6 18.8 84.6
INCOME TAX EXPENSE 1.3 12.5 9.3 7.3 30.4
INCOME FROM CONTINUING OPERATIONS 2.3 21.1 19.3 11.5 54.2
DISCONTINUED OPERATIONS, net of tax (1.9) (0.5) (0.3) (0.5) (3.2)
NET INCOME $ 0.4 $ 20.6 $ 19.0 $ 11.0 $ 51.0
DILUTED EARNINGS PER COMMON SHARE:
Continuing operations $ 0.07 $ 0.63 $ 0.58 $ 0.36 $ 1.63
Discontinued operations (0.06) (0.01) (0.01) (0.02) (0.10)
Net income $ 0.01 $ 0.62 $ 0.57 $ 0.34 $ 1.53
WEIGHTED AVERAGE COMMON SHARES
OUTSTANDING (DILUTED): 34.2 33.3 33.2 32.2 33.3
VEHICLES SOLD:
New vehicle units 26,573 28,709 28,887 25,286 109,455
Used retail units 16,303 16,013 15,107 13,000 60,423
3. Asbury Automotive Group, Inc.
Consolidated Statements of Income
By Quarter for the Six Months Ended June 30, 2008
(In thousands, except per share and unit data)
(Unaudited)
Q1 Q2 2008
REVENUES:
New vehicle $ 736.2 $ 785.6 $ 1,521.8
Used vehicle 324.4 314.3 638.7
Parts, service and collision repair 182.6 183.5 366.1
Finance and insurance, net 38.5 39.0 77.5
Total revenues 1,281.7 1,322.4 2,604.1
COST OF SALES:
New vehicle 687.9 733.1 1,421.0
Used vehicle 296.0 287.7 583.7
Parts, service and collision repair 89.8 89.0 178.8
Total cost of sales 1,073.7 1,109.8 2,183.5
GROSS PROFIT 208.0 212.6 420.6
OPERATING EXPENSES:
Selling, general and administrative 167.6 168.7 336.3
Depreciation and amortization 5.5 5.7 11.2
Other operating expense (income), net (0.3) 2.0 1.7
Income from operations 35.2 36.2 71.4
OTHER INCOME (EXPENSE):
Floor plan interest expense (9.1) (8.0) (17.1)
Other interest expense (9.1) (9.4) (18.5)
Interest income 1.0 0.3 1.3
Loss on extinguishment of long-term debt - - -
Total other expense, net (17.2) (17.1) (34.3)
Income before income taxes 18.0 19.1 37.1
INCOME TAX EXPENSE 6.8 7.5 14.3
INCOME FROM CONTINUING OPERATIONS 11.2 11.6 22.8
DISCONTINUED OPERATIONS, net of tax (0.7) (0.7) (1.4)
NET INCOME $ 10.5 $ 10.9 $ 21.4
DILUTED EARNINGS PER COMMON SHARE:
Continuing operations $ 0.35 $ 0.36 $ 0.71
Discontinued operations (0.02) (0.02) (0.05)
Net income $ 0.33 $ 0.34 $ 0.66
WEIGHTED AVERAGE COMMON SHARES
OUTSTANDING (DILUTED): 32.3 32.2 32.2
VEHICLES SOLD:
New vehicle units 24,122 26,023 50,145
Used retail units 13,822 13,794 27,616