1. A n h e u s e r- Bu s c h C o m pa n i e s a n d S u b s i d i a r i e s
Financial Highlights
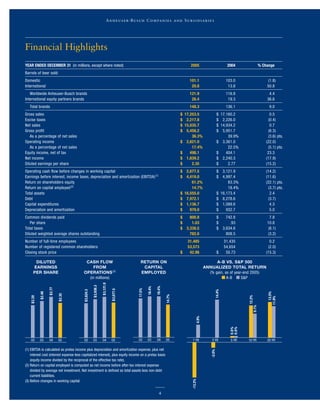
YEAR ENDED DECEMBER 31 (in millions, except where noted) 2005 2004 % Change
Barrels of beer sold:
Domestic 101.1 103.0 (1.8)
International 20.8 13.8 50.8
Worldwide Anheuser-Busch brands 121.9 116.8 4.4
International equity partners brands 26.4 19.3 36.6
Total brands 148.3 136.1 9.0
Gross sales $ 17,253.5 $ 17,160.2 0.5
Excise taxes $ 2,217.8 $ 2,226.0 (0.4)
Net sales $ 15,035.7 $ 14,934.2 0.7
Gross profit $ 5,456.2 $ 5,951.7 (8.3)
As a percentage of net sales 36.3% 39.9% (3.6) pts.
Operating income $ 2,621.0 $ 3,361.0 (22.0)
As a percentage of net sales 17.4% 22.5% (5.1) pts.
Equity income, net of tax $ 498.1 $ 404.1 23.3
Net income $ 1,839.2 $ 2,240.3 (17.9)
Diluted earnings per share $ 2.35 $ 2.77 (15.2)
Operating cash flow before changes in working capital $ 2,677.5 $ 3,121.9 (14.2)
Earnings before interest, income taxes, depreciation and amortization (EBITDA) (1) $ 4,419.0 $ 4,997.4 (11.6)
Return on shareholders equity 61.2% 83.3% (22.1) pts.
Return on capital employed (2) 14.7% 18.4% (3.7) pts.
Total assets $ 16,555.0 $ 16,173.4 2.4
Debt $ 7,972.1 $ 8,278.6 (3.7)
Capital expenditures $ 1,136.7 $ 1,089.6 4.3
Depreciation and amortization $ 979.0 $ 932.7 5.0
Common dividends paid $ 800.8 $ 742.8 7.8
Per share $ 1.03 $ .93 10.8
Total taxes $ 3,338.5 $ 3,634.6 (8.1)
Diluted weighted average shares outstanding 782.6 808.5 (3.2)
Number of full-time employees 31,485 31,435 0.2
Number of registered common shareholders 53,573 54,654 (2.0)
Closing stock price $ 42.96 $ 50.73 (15.3)
DILUTED CASH FLOW RETURN ON A-B VS. S&P 500
EARNINGS FROM CAPITAL ANNUALIZED TOTAL RETURN
OPERATIONS (3)
PER SHARE EMPLOYED (% gain, as of year-end 2005)
(in millions) A-B S&P
$3,121.9
$2,938.3
18.4%
18.4%
$2.77
17.5%
$2,677.5
14.4%
$2,624.3
$2.48
13.5%
$2.35
14.7%
12.2%
$2.20
11.9%
9.1%
4.9%
0.6%
0.6%
02 03 04 05
02 03 04 05 02 03 04 05 1 YR 3 YR 5 YR 10 YR 20 YR
(1) EBITDA is calculated as pretax income plus depreciation and amortization expense, plus net
-2.0%
interest cost (interest expense less capitalized interest), plus equity income on a pretax basis
(equity income divided by the reciprocal of the effective tax rate).
(2) Return on capital employed is computed as net income before after-tax interest expense
divided by average net investment. Net investment is defined as total assets less non-debt
current liabilities.
-13.3%
(3) Before changes in working capital.
4