Call Girls in Dwarka Mor Delhi Contact Us 9654467111
1010-2743-1-SM.pdf
1. Journal of Educational Method and Technology Vol. 2 No. 2, Agustus 2019
P-ISSN 2622-8459 E-ISSN 2622-8467
http://ejournal.unima.ac.id/index.php/jemtec
33
Student Satisfaction Level on Academic and Administrative Services in FMIPA
Universitas Negeri Manado
D D W Kamagi 1
1
Universitas Negeri Manado, Indonesia
corresponding author: 1
deckykamagi@unima.ac.id
Abstract. Student satisfaction as users of academic and administrative
services has been evaluated to find out the extent of service delivery
that has been carried out by the academic and administrative work
units of the Faculty of Mathematics and Natural Sciences, Universitas
Negeri Manado. The level of student satisfaction with academic and
administrative services has been measured using a linkert scale, and
analyzed using the distribution of scores, then presented and served in
tables or diagrams. Measuring the level of satisfaction of students to
academic and administrative services covering six aspects,
including tangibles, responsiveness, reliability, empathy, assurance and
information systems. The six aspects are outlined in a question sheet
with each aspect consisting of several question / statement items with
the same score scale. Question points for all aspects of the assessment
consisted of 42 items. The number of respondents amounted to 265
respondents. The measurement data is completely re-converted to get
the level of student satisfaction with five categories, namely
dissatisfied, less satisfied, quite satisfied, satisfied and very satisfied.
The measurement results show that the level of student satisfaction
with all aspects of academic and administrative services is 5.66% very
satisfied, 23.02% satisfied, 38.11% quite satisfied, 24.91% less
satisfied and 8.30% dissatisfied. While the level of student satisfaction
with academic and administrative services for each aspect of service
shows that only tangibles aspects are the percentage of satisfaction
below 50%
Keywords: Satisfaction; Academic and Administrative Services;
FMIPA Students
1. Introduction
Based on Law No. 12 of 2012, on Higher Education, it has been established
that education is a conscious and planned effort to create an atmosphere of learning
and learning process so that students actively develop their potential to have spiritual
strength, self-control, personality, intelligence, noble character, and skills which is
needed by himself, society, nation and state. In addition, it has also been determined
that tertiary education institutions carry out tertiary education, which is the level of
education after secondary education which includes diploma programs,
2. Journal of Educational Method and Technology Vol. 2 No. 2, Agustus 2019
P-ISSN 2622-8459 E-ISSN 2622-8467
http://ejournal.unima.ac.id/index.php/jemtec
34
undergraduate programs, master programs, doctoral programs and professional
programs, and specialist programs, which are organized by universities based on
Indonesian culture. Higher Education functions (a) develops capabilities and shapes
the dignified character and civilization of the nation in the context of intellectual life
of the nation; (b) developing an innovative, responsive, creative, ingenious,
competitive, and cooperative Academic Community through the implementation of
tridharma; and (c) developing science and technology by observing and applying
humanities values. Higher education aims to (a) develop the potential of students to
become human beings who believe and cautious in The Almighty God and have
noble, healthy, knowledgeable, capable, creative, independent, skilled, competent,
and cultured for the benefit of the nation; (b) the production of graduates who master
the branches of science and / or technology to meet national interests and increase
national competitiveness; (c) the production of science and technology through
research that pays attention to and applies the value of the humanities to benefit the
progress of the nation, as well as the progress of civilization and the well-being of
humanity; and (d) the realization of community service based on reasoning and
research work that is useful in advancing public welfare and intellectual life of the
nation.
In connection with the mandate of the Act, students as students in higher
education are entitled to receive services according to their talents, interests, potential
and abilities. Therefore tertiary education institutions as providers of higher
education are required to provide educational services that are in line with the quality
standards of service to students. The level of success of services to students is closely
related to the level of satisfaction with meeting the needs of students in activities on
campus. Students who are satisfied with the service can be the main capital to
compete because it produces utterances with positive words, retention and loyalty
(Arambewela and Hall, 2009). Academic and administrative services are services
provided to students in the context of achieving academic goals, therefore academic
services should have a relatively large proportion of services in other academic
activities. Quality academic services will have a domino effect, in addition that
students finishing their studies on time, they will also form a mutually beneficial
bond with the institution, indirectly involved with promotion and imaging.
Universities as a form of tertiary education are service providers in the form of
graduates, therefore they must provide services according to established quality
standards, so as to provide guarantees in the competition and trust of stakeholders.
The quality of universities and study programs in Indonesia is currently not at an
ideal condition. The difference in the quality of higher education can be seen from
the results of higher education accreditation and study programs, out of 4,472
universities in Indonesia there are currently only 50 higher education institutions that
have A accreditation and 2,512 A accredited study programs (12% of 20,254
accredited study programs) (Ministry of Research and Higher Education, 2017).
Currently there are 124 State Universities (PT), 3,127 Private Universities, 175
Ministry / Institution Universities, 968 PTAs, and 78 PTAN (PDDikti Data, March
11, 2017). Based on this data, BAN-PT shows that only 1,131 are accredited with the
details of 50 universities having accreditation A (4%), 345 universities accredited B
(31%), and 736 universities accredited C (65%), and the remaining 3,340 are not
accredited. There are 26,672 study programs (PDDikti, 2017) with a total of 20,254
3. Journal of Educational Method and Technology Vol. 2 No. 2, Agustus 2019
P-ISSN 2622-8459 E-ISSN 2622-8467
http://ejournal.unima.ac.id/index.php/jemtec
35
accredited study programs with details of number of study programs with A
accreditation of 2,512 (12%), B accreditation of 9,922 (49%), and C accreditation of
7,820 (39%), in fact there are many non-accredited study programs (BAN-PT, 2017).
These data indicate that the quality of most of the tertiary institutions and study
programs is still far from what is expected.
Related to the quality of academic and administrative services in the FMIPA
work unit of the Universitas Negeri Manado, until now there is no fact about the
level of student satisfaction with these services, even though the level of student
satisfaction with academic and administrative services has a positive correlation (I
Nyoman Rinala, et al, 2013; Susanto, H., 2014), which can encourage students to
finish college on time. In addition, the results of this study can be used as
evaluation material to encourage the achievement of service quality standards
2. Materials and Methods
Time and place
This research was conducted in June-December (odd semester / academic
year 2017/2018) and located in the work unit of the Faculty of Mathematics and
Natural Sciences, Universitas Negeri Manado in Tondano.
Population and Sample
The population of this research is the active students of the class of 2014-
2017. The sampling technique used was proportionate stratified random sampling,
where each department / study program per year was represented by several students
who were taken at random. The minimum number of sample members is determined
based on Supranto, (2006) using the following formula:
where, n = number of sample members
N = total population
d = percentage tolerance of accuracy of sampling error
Data collection technique
Data is collected through the use of a questionnaire with multiple answer
choices and with an attitude scale that contains attitude statements, which is a
statement of attitude about an object. Questionnaire to measure the level of
satisfaction of students to academic services and administrative compiled based on
five factors that determine the quality of service according to Kotler and Armstrong
(2012) which includes: (1) tangible, (2) reliability,(3) responsiveness, (4) assurance,
(5) empathy and (6) information systems. The Likert scale is used to measure attitude
statements with four categories of answers as shown in Table 1.
4. Journal of Educational Method and Technology Vol. 2 No. 2, Agustus 2019
P-ISSN 2622-8459 E-ISSN 2622-8467
http://ejournal.unima.ac.id/index.php/jemtec
36
Table 1. Score Questionnaire Answers About Service Satisfaction
Category Answer Score
Very satisfied 5
Satisfied 4
Quite satisfied 3
Not satisfied 2
Very Dissatisfied 1
The measurement data is completely re-converted to get the level of student
satisfaction with five categories, namely dissatisfied, less satisfied, quite satisfied,
satisfied and very satisfied. Data conversion to obtain the satisfaction level category
is grouped based on frequency distribution with five different interval classes where
each interval class is determined based on the formula ≥ X = average + (1.5 ×
standard deviation) for the interval class with the very satisfied category and ≤ X =
average - (1.5 × standard deviation) for interval classes with dissatisfied categories.
For interval classes with satisfied categories, quite satisfied and less satisfied are
determined by determining the lower class boundary of each interval class by
dividing 3 results from the difference between the largest class limit and the smallest
class limit.
Data analysis
Data analysis using descriptive statistics is data that is processed and then presented
in tables and graphs. The average value of the data is presented in a table to obtain a
description of all aspects measured. Graphs are presented to obtain ease of
understanding, analysis and conclusions.
3. Results and Discussion
Measurement Description
The level of student satisfaction with academic and administrative services
has been measured using a linkert scale, and analyzed using the distribution of
scores, then presented and served in tables or diagrams. Measuring the level of
satisfaction of students to academic and administrative services covering six aspects,
including tangibles, responsiveness, reliability, empathy, assurance and information
systems. The six aspects are outlined in a questionnaire with each aspect consisting
of several questions / statements with the same statement. The questions / statements
for any aspects of the assessment are: aspects of tangibles 8 items, responsiveness 5
items, reliability 11 items, empathy 7 items, assurance 6 items and information
system 5 items. Thus the scoring ratings for each of the following aspects: tangibles
with 8 items, the lowest score = 8 and the highest = 40, the aspect of responsiveness
with 5 items, the lowest score = 5 and the highest = 25, aspects of reliability with 11
items, the lowest score = 11 and the highest = 55, aspects of empathy with 7 items,
the lowest score = 7 and the highest = 35, aspects of assurance with 6 items, the
lowest score = 6 and the highest = 30 and aspects of information systems with 5
items, the lowest score = 5 and the highest = 25. Since the total questions for all
aspects is = 42, mean overall, the lowest score 42 and the highest score is 210.
5. Journal of Educational Method and Technology Vol. 2 No. 2, Agustus 2019
P-ISSN 2622-8459 E-ISSN 2622-8467
http://ejournal.unima.ac.id/index.php/jemtec
37
Description of Measurement Results
Student satisfaction with academic and administrative services at FMIPA
UNIMA has been measured by 42 question items for all aspects with a scale of 1, 2,
3, 4 and 5. The statistical data of the overall level of student satisfaction with all
aspects of academic and administrative services is shown in Table 2.
Table 2 . Statistical data on all aspects of
academic and administrative services
N Min. Max. Average Std.Deviation
Service 265 48 192 121 , 6
1
26 , .62
Valid
N
265
Data conversion of all aspects of academic and administrative services into
frequency distribution with five categories of student satisfaction levels is shown in
Table 3.
Table 3 . Student satisfaction level categories for all aspects of academic and
administrative services
Interval
class
Frequency % Category
≤ 83 22 8.30 Not
satisfied
84 - 109 66 24.91 Less
satisfied
110 - 135 101 38.11 Quite
satisfied
136 - 161 61 23.02 Satisfied
≥ 162 15 5.66 Very
satisfied
amount 265 100%
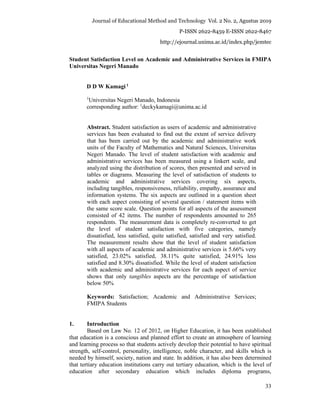
Based on the conversion of data in the frequency distribution obtained a general
description of the level of student satisfaction with academic and administrative
services that is very satisfied 5.66%, satisfied 23.02%, quite satisfied 38.11%, less
satisfied 24.91% and dissatisfied 8, 30% The frequency of each category of level of
student satisfaction with academic and administrative services is shown in Figure 1.
6. Journal of Educational Method and Technology Vol. 2 No. 2, Agustus 2019
P-ISSN 2622-8459 E-ISSN 2622-8467
http://ejournal.unima.ac.id/index.php/jemtec
38
Figure 1. Percentage and frequency for each category of student satisfaction
level of the academic and administrative services.
Student Satisfaction Level Per Academic and Administrative Service Aspects
The level of student satisfaction with academic and administrative services on
tangibles aspects, with the lowest score of 10, the highest score of 38, an average of
20.57 and a standard deviation of 5.52. The level of student satisfaction with
academic and administrative services on the aspect of reliability, with the lowest
score of 11, the highest score of 55, an average of 33.61 and a standard deviation of
7.79. The level of student satisfaction with academic and administrative services in
the aspect of assurances, with the lowest score of 6, the highest score of 30, an
average of 18.29 and a standard deviation of 4.92. The level of student satisfaction
with academic and administrative services on the aspects of empathy, with the lowest
score of 7, the highest score of 35, an average of 20.01 and a standard deviation of
5.33. The level of student satisfaction with academic and administrative services in
the information system aspect, with the lowest score 5 and the highest score of 25, an
average of 14.26 and a standard deviation of 4.28. The average student satisfaction
level per aspect of academic and administrative services is shown in Figure 2 .
7. Journal of Educational Method and Technology Vol. 2 No. 2, Agustus 2019
P-ISSN 2622-8459 E-ISSN 2622-8467
http://ejournal.unima.ac.id/index.php/jemtec
39
Figure 2. Chart of the average level of student satisfaction for each aspect of
academic and administrative services.
Tangibles aspect
Conversion of student satisfaction level data on aspects of academic and
administrative service tangibles with five categories of satisfaction levels is shown in
Table 5.
Table 5. Data conversion level of student satisfaction with the services of
academic and administrative on the aspects of tangibles.
Interval
class
Frequency % Category
<15 8 3.02 Not
satisfied
16-21 155 58.49 Less
satisfied
22-27 64 24,15 Quite
satisfied
28 - 33 30 11.32 Satisfied
> 34 8 3.02 Very
satisfied
amount 265 100%
The frequency and percentage of data conversion according to the level of student
satisfaction on aspects of academic and administrative service tangibles are shown in
Figure 3.
8. Journal of Educational Method and Technology Vol. 2 No. 2, Agustus 2019
P-ISSN 2622-8459 E-ISSN 2622-8467
http://ejournal.unima.ac.id/index.php/jemtec
40
Figure 3. Frequency and percentage of student satisfaction level categories for
academic and administrative services on tangibles aspects.
Reliability aspects
Conversion of student satisfaction level data on aspects of academic and
administrative service reliability with five categories of student satisfaction levels is
shown in Table 6.
Table 6. Conversion of student satisfaction level data on aspects of academic
and administrative service reliability
Interval
class
Frequency % Category
<22 18 6.79 Not
satisfied
23-30 73 27.55 Less
satisfied
31-38 112 42.26 Quite
satisfied
39-45 41 15.47 Satisfied
> 46 21 7.93 Very
satisfied
amount 265 100%
The frequency and percentage of student satisfaction levels on aspects of academic
and administrative service reliability are shown in Figure 4.
9. Journal of Educational Method and Technology Vol. 2 No. 2, Agustus 2019
P-ISSN 2622-8459 E-ISSN 2622-8467
http://ejournal.unima.ac.id/index.php/jemtec
41
Figure 4. Frequency and percentage of student satisfaction level categories in
the aspects of academic and administrative service reliability.
Responsiveness aspects
Conversion of student satisfaction level data on the responsiveness aspects of
academic and administrative services with five categories of student satisfaction
levels is shown in Table 7.
Table 7. Data conversion of student satisfaction levels on the responsiveness
aspects of academic and administrative services
Interval
class
Frequency % Category
≤ 8 24 9.06 Not
satisfied
9-12 56 21.13 Less
satisfied
13-16 96 36.23 Quite
satisfied
17-20 61 23.02 Satisfied
≥ 21 28 10.56 Very
satisfied
amount 265 100%
The frequency and percentage of categories of student satisfaction with academic and
administrative services in the aspect of responsiveness are shown in Figure 5.
10. Journal of Educational Method and Technology Vol. 2 No. 2, Agustus 2019
P-ISSN 2622-8459 E-ISSN 2622-8467
http://ejournal.unima.ac.id/index.php/jemtec
42
Figure 5. Frequency and percentage of student satisfaction level categories on
the responsiveness aspects of academic and administrative services.
Assurance aspects
Conversion of student satisfaction level data on assurance aspects of academic and
administrative services with five categories of student satisfaction levels is shown in
Table 8.
Table 8. Conversion of student satisfaction level on assurance aspect of
academic and administrative services.
Interval
class
F
frequency
% Category
≤ 10 17 6.41 Not
satisfied
11-15 57 21.51 Less
satisfied
16-20 104 39.25 Quite
satisfied
21-25 65 24.53 Satisfied
≥ 26 22 8.3 Very
satisfied
amount 265 100%
The frequency and percentage of each category of student satisfaction level in the
aspect of academic and administrative service’s assurance are shown in Figure 6.
11. Journal of Educational Method and Technology Vol. 2 No. 2, Agustus 2019
P-ISSN 2622-8459 E-ISSN 2622-8467
http://ejournal.unima.ac.id/index.php/jemtec
43
Figure 6. Frequency and percentage of student satisfaction level categories on
the aspects of academic and administrative service assurance.
Empathy aspect
Conversion of student satisfaction level data on aspects of academic and administrative
service empathy with five categories of student satisfaction levels is shown in Table 9.
Table 9. Data conversion of student satisfaction levels on aspects of academic
and administrative service empathy.
Interval
class
Frequency % Category
≤ 12 21 7.93 Not
satisfied
13-17 64 24,15 Less
satisfied
18-22 98 36.98 Quite
satisfied
23-27 57 21.51 Satisfied
≥ 28 25 9.43 Very
satisfied
amount 265 100%
The frequency and percentage of student satisfaction level categories in the aspects
of academic and administrative service empathy are shown in Figure 7.
12. Journal of Educational Method and Technology Vol. 2 No. 2, Agustus 2019
P-ISSN 2622-8459 E-ISSN 2622-8467
http://ejournal.unima.ac.id/index.php/jemtec
44
Figure 7. Frequency and percentage of student satisfaction level categories in
the aspects of academic and administrative service empathy.
Information system aspects
Conversion of student satisfaction level data on aspects of academic and
administrative service information systems with five categories of student satisfaction
levels is shown in Table 10.
Table 10 . Conversion of student satisfaction level data on information system
aspects of academic and administrative service.
Interval
class
Frequency % Category
≤ 8 24 9.05 Not
satisfied
9-12 68 25.67 Less
satisfied
13-16 98 36.98 Quite
satisfied
17-20 52 19.62 Satisfied
≥ 21 23 8.68 Very
satisfied
amount 265 100%
The frequency and percentage of student satisfaction level categories in the academic
and administrative service information system aspects are shown in Figure 8.
13. Journal of Educational Method and Technology Vol. 2 No. 2, Agustus 2019
P-ISSN 2622-8459 E-ISSN 2622-8467
http://ejournal.unima.ac.id/index.php/jemtec
45
Figure 8 . Frequency and percentage of student satisfaction level categories on
the information system aspects of academic and administrative services.
4. Discussion
Overall Evaluation of Academic and Administrative Service Aspects
The results of measurements of the level of student satisfaction with academic
and administrative services in the work unit of the Faculty of Mathematics and
Natural Sciences, on all aspects of academic and administrative services showed
5.66% very satisfied, 23.02% satisfied, 38.11% quite satisfied, 24, 91% less satisfied
and 8.30 dissatisfied. Thus in general it can be said that academic and administrative
services in the FMIPA work unit are not bad but also not yet optimal, this is
indicated by 33.21% of students who are not satisfied with the service but students
who are quite satisfied to the point of satisfaction are quite large ie 66.79%.
Handayani et al ., (2003) states that to achieve a high level of satisfaction in service
requires an understanding of what is desired by consumers. Although the level of
consumer satisfaction is individual, which depends on the values adopted and
applies, but the level of satisfaction is the level of one's feelings when measuring the
results of a comparison of what he expected and what he has received (Kotler, 2000).
This means that the smaller the difference between what is expected and what is
received by consumers, the higher the level of customer satisfaction with services.
Related to this, it indicates that student satisfaction with academic and administrative
services depends on the quality of service they expect and what they receive.
Academic and administrative services are said to be of high quality if the service is
equal or even exceeds student expectations. Quality of service on students has a
positive effect on student satisfaction (Indah , Elza Putri 2012; I Nyoman Rinala, et
al., 2013 ; Aris Fita Bayu Apriliana, et al., 2014 ). More emphaticly Effiyadi (2008);
I Nyoman Rinala, et al., 2013 , stated that aspects of academic services to students
simultaneously had a positive effect on student satisfaction. Furthermore it is said
14. Journal of Educational Method and Technology Vol. 2 No. 2, Agustus 2019
P-ISSN 2622-8459 E-ISSN 2622-8467
http://ejournal.unima.ac.id/index.php/jemtec
46
that service quality has an influence on satisfaction, and satisfaction subsequently
affects student loyalty. Thus, improving the quality of academic services will
increase student satisfaction, and will further affect student loyalty.
Evaluation of Each Academic and Administrative Service Aspect
The results of measurements of the level of student satisfaction with each of
the aspects of academic and administrative services show that in the tangibles aspect
of the dissatisfied to less satisfied category of 61.51%, quite satisfied until very
satisfied 38.49%, the reliability aspect with the dissatisfied category until less
satisfied at 34.34%, quite satisfied until very satisfied 65.66%, responsiveness
aspects with the category of dissatisfied to less satisfied at 30.19%, satisfied until
very satisfied 69.81%, assurance aspects with the category of dissatisfied to less
satisfied is 27.92%, quite satisfied until very satisfied 72.08%, empathy aspects with
the dissatisfied category until less satisfied are 32.08%, quite satisfied until very
satisfied 67.92%, and aspects of the information system with the category of
dissatisfied to less satisfied by 34.72%, quite satisfied to 65.28% very satisfied.
Based on the results of these measurements except aspects of tangibles, obtained the
fact that the level of student satisfaction with each aspect of academic and
administrative services is sufficient to meet the desires of students. In this connection
Srinadi et al. (2008), states that the quality of service aspects tangibles, reliability,
responsiveness, assurance and empathy have positive effects and simultaneously
affect student satisfaction.
The results of the evaluation of several aspects of academic and
administrative services, the aspect that still do not meet the expectations of students
is tangibles aspect, while other aspects are sufficient to meet student desires. The
tangibles aspect relates to education and learning facilities and infrastructure
variables: lecture halls, lecture aids, learning media, laboratories, governance of
space use, libraries, availability of reference books, toilet facilities, worship facilities,
and internet networks. It has been stated before, that aspects of the service
simultaneously affect student satisfaction so that service quality improvement must
be carried out simultaneously as well. If the quality of service in tangibles aspects is
addressed, other aspects will be affected, or vice versa. Implementation of education
should look at the quality of service. Educational activities are not only oriented
towards the final result the educational process, but also through the proof of
accountability includes quality assurance, quality control, and quality improvement.
5. Conclusions And Suggestions
Conclusion
The level of student satisfaction with academic and administrative services
for all aspects of service is very satisfied 5.66%, 23.02% satisfied, 38.11% quite
satisfied, 24.91% less satisfied and 8.30% dissatisfied, while for each aspect includes
aspects of tangibles shows 3.02% dissatisfied categories, 61.51% less satisfied,
24.15% quite satisfied, 11.32% satisfied, and 3.02% very satisfied. The reliability
aspect shows that the dissatisfied category is 6.79%, less satisfied 27.55%, quite
satisfied 42.26%, satisfied 1.47%, and very satisfied 7.93%. Responsiveness
assumptions shows 9.06% dissatisfied categories, 21.13% less satisfied, 26.23%
quite satisfied, 23.02% satisfied, and 10.56% very satisfied. The assurance aspect
15. Journal of Educational Method and Technology Vol. 2 No. 2, Agustus 2019
P-ISSN 2622-8459 E-ISSN 2622-8467
http://ejournal.unima.ac.id/index.php/jemtec
47
shows that the category of dissatisfaction is 6.41%, less than 21.51%, quite satisfied
39.25%, satisfied 24.53%, and very satisfied 8.3%. Empathy aspect shows that the
category of dissatisfaction is 7.93%, unsatisfied 24.15%, quite satisfied 36.98%,
satisfied 21.51%, and very satisfied 9.43%. Information system aspects showed that
the category of dissatisfaction was 9.05%, unsatisfied 25.67%, quite satisfied
36.98%, satisfied 19.62%, and very satisfied 8.68%.
Suggestion
In general, the level of satisfaction of FMIPA students towards academic and
administrative services in general is quite high. This shows that the academic and
administrative services in the FMIPA work unit are quite good, but need to be
improved again, especially in the tangibles aspect, which is related to the provision
of physical facilities and infrastructure and supporting learning.
References
Aris Fita Bayu Apriliana, Sigit Santoso, Sri Sumaryati, 2014. Pengaruh Kualitas
Pelayanan Akademik terhadap Kepuasan Mahasiswa BKK Pendidikan
Akuntansi Program Studi Pendidikan Ekonomi Fakultas Keguruan dan Ilmu
Pendidikan Universitas Sebelas Maret Surakarta. Jupe UNS, Vol 2, No 3, Hal
211-223. Juni, 2014.
Budi, Santoso. 2008. Upaya Peningkatan Manajemen Perguruan Tinggi Swasta agar
dapat Bersaing di Era Global. Materi Dies Reader Universitas PGRI
Yogyakarta. UPY Yogyakarta.
Detha, Rintiansyah Putri. 2012. Kepuasan Warga Sekolah Terhadap Implementasi
Sistem Manajemen Mutu Dalam Hal Pelayanan Di SMK N 2 Yogyakarta.
Skripsi. Universitas Negeri Yogyakarta.
Effiyaldi. (2008). Analisis kualitas pelayanan terhadap kepuasan mahasiswa pada
perpustakaan STIKOM Dinamika Bangsa. Jurnal Media Akademik, vol 2(1):
68-76.
Handayani, R, Yermias T. K., & Ratminto. (2003). Analisis kepuasan pemakai
terhadap pelayanan perpustakaan nasional provinsi daerah istimewa
Yogyakarta. Sosiosains, vol 17(2), April 2003. Pasca Sarjana Fisipol UGM,
Yogyakarta.
I Nyoman Rinala, I Made Yudana, I Nyoman Natajaya, 2013. Pengaruh Kualitas
Pelayanan Akademik Terhadap Kepuasan Dan Loyalitas Mahasiswa Pada
Sekolah Tinggi Pariwisata Nusa Dua Bali, e-Journal Program Pascasarjana
Universitas Pendidikan Ganesha Program Studi Administrasi Pendidikan.
Volume 4.
Indah, Elza Putri. 2012. Tanggapan Mahasiswa Terhadap Kualitas Pelayanan
Akademik Di Fakultas Ilmu Sosial Dan Ilmu Politik Universitas Hasanuddin.
Skripsi. Universitas Hasanuddin.
Kotler, P. dan Armstrong G., 2012. Principles of Marketing 14th Edition. England:
Pearson Education Limited
Srinadi, I Gusti Ayu Made & Desak Putu Eka Nilakusmawati. (2008). Faktor-
faktor penentu kepuasan mahasiswa terhadap pelayanan fakultas sebagai
16. Journal of Educational Method and Technology Vol. 2 No. 2, Agustus 2019
P-ISSN 2622-8459 E-ISSN 2622-8467
http://ejournal.unima.ac.id/index.php/jemtec
48
lembaga pendidikan (studi kasus FMIPA Universitas Udayana). Cakrawala
pendidikan Tahun XXVII No 3, Denpasar